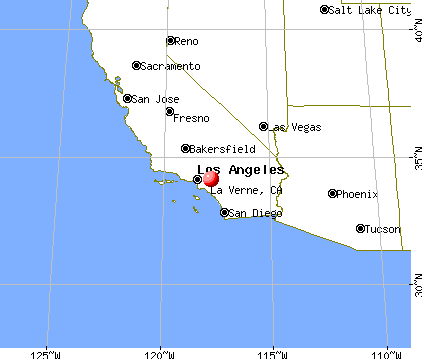
La Verne, California
Submit your own pictures of this city and show them to the world
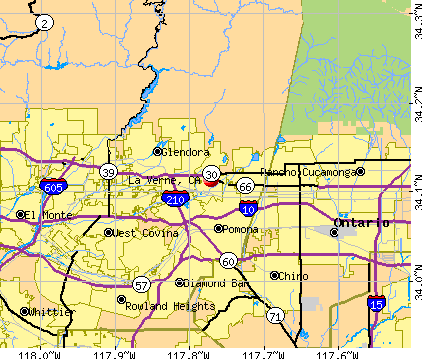
- OSM Map
- General Map
- Google Map
- MSN Map
Population change since 2000: -4.0%
 |
| Males: 14,681 | |
| Females: 15,699 |
| Median resident age: | 46.8 years |
| California median age: | 37.9 years |
Zip codes: 91767.
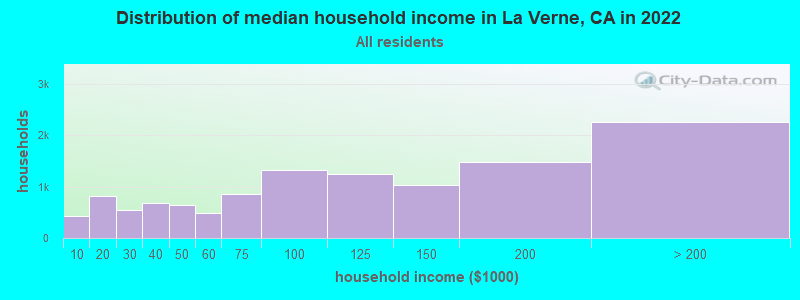
| La Verne: | $102,702 |
| CA: | $91,551 |
Estimated per capita income in 2022: $50,104 (it was $26,689 in 2000)
La Verne city income, earnings, and wages data
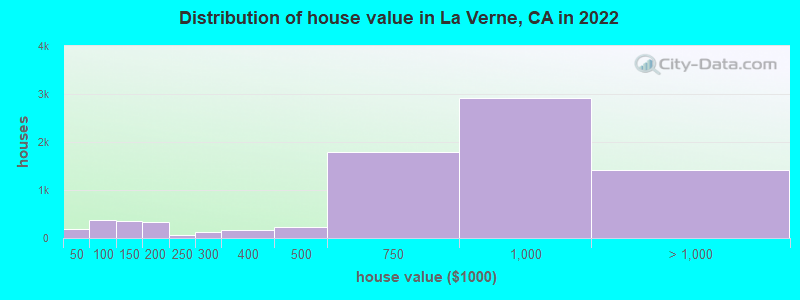
Estimated median house or condo value in 2022: $808,241 (it was $219,400 in 2000)
| La Verne: | $808,241 |
| CA: | $715,900 |
Mean prices in 2022: all housing units: $801,764; detached houses: $972,285; townhouses or other attached units: $528,905; in 3-to-4-unit structures: $324,508; in 5-or-more-unit structures: $346,161; mobile homes: $127,629
Median gross rent in 2022: $1,985.
(5.9% for White Non-Hispanic residents, 30.4% for Black residents, 10.1% for Hispanic or Latino residents, 7.2% for American Indian residents, 21.2% for other race residents, 5.6% for two or more races residents)
Detailed information about poverty and poor residents in La Verne, CA


Compare current foreclosures near La Verne, CA:
| Photo | Address | Area | Beds / Baths | Price | Details |
|---|---|---|---|---|---|

|
#1
Canyon Park Ln
La Verne, CA 91750
|
1,144 sq. feet
|
2 baths 2 beds |
show details | |

|
#2
Williams Ave
La Verne, CA 91750
|
2,214 sq. feet
|
3 baths 4 beds |
show details | |

|
#3
Oriole Ave
La Verne, CA 91750
|
1,980 sq. feet
|
3 baths 3 beds |
show details | |

|
#4
San Dimas Canyon Rd
La Verne, CA 91750
|
1,828 sq. feet
|
2 baths 4 beds |
show details | |

|
#5
Bixby Dr
La Verne, CA 91750
|
1,336 sq. feet
|
2 baths 4 beds |
show details | |

|
#6
Fordland Ave
La Verne, CA 91750
|
1,107 sq. feet
|
2 baths 3 beds |
show details | |

|
#7
Pinyon Pl
La Verne, CA 91750
|
1,867 sq. feet
|
3 baths 3 beds |
show details | |

|
#8
Baseline Rd
La Verne, CA 91750
|
2,982 sq. feet
|
4 baths 5 beds |
show details | |

|
#9
2nd St
La Verne, CA 91750
|
830 sq. feet
|
1 baths 2 beds |
show details | |

|
#10
Elmcrest St
La Verne, CA 91750
|
1,543 sq. feet
|
2 baths 3 beds |
show details |
| Photo | Address | Area | Beds / Baths | Price | Details |
|---|---|---|---|---|---|

|
#11
Calle Del Bravo
La Verne, CA 91750
|
3,045 sq. feet
|
3 baths 4 beds |
show details | |

|
#12
Williams Ave
La Verne, CA 91750
|
1,773 sq. feet
|
2 baths 4 beds |
show details | |

|
#13
Todd Pl
La Verne, CA 91750
|
1,159 sq. feet
|
2 baths 3 beds |
show details | |

|
#14
Elmcrest St
La Verne, CA 91750
|
1,543 sq. feet
|
2 baths 3 beds |
show details | |

|
#15
Warm Springs Ave
La Verne, CA 91750
|
1,924 sq. feet
|
2 baths 3 beds |
show details | |

|
#16
Bolling Ave
La Verne, CA 91750
|
771 sq. feet
|
1 baths 2 beds |
show details | |

|
#17
N White Ave Unit 7010
La Verne, CA 91750
|
- sq. feet
|
- baths - beds |
show details | |

|
#18
Ramona Ave Apt 6
La Verne, CA 91750
|
- sq. feet
|
- baths - beds |
show details | |

|
#19
Foothill Blvd Ste 212
La Verne, CA 91750
|
- sq. feet
|
- baths - beds |
show details | |

|
#20
Bradford St Spc 96
La Verne, CA 91750
|
- sq. feet
|
- baths - beds |
show details |
| Photo | Address | Area | Beds / Baths | Price | Details |
|---|---|---|---|---|---|

|
#21
Bonita Ave
La Verne, CA 91750
|
- sq. feet
|
- baths - beds |
show details | |

|
#22
E St
La Verne, CA 91750
|
- sq. feet
|
- baths - beds |
show details | |

|
#23
Bradford St Spc 249
La Verne, CA 91750
|
- sq. feet
|
- baths - beds |
show details | |

|
#24
E G St
Ontario, CA 91764
|
1,036 sq. feet
|
1 baths 3 beds |
$577,200
|
show details |

|
#25
E Norma Ave
West Covina, CA 91791
|
1,134 sq. feet
|
2 baths 3 beds |
$599,000
|
show details |

|
#26
Millbury Ave
Baldwin Park, CA 91706
|
1,632 sq. feet
|
2 baths 4 beds |
$869,000
|
show details |

|
#27
E Holton St
West Covina, CA 91791
|
- sq. feet
|
2 baths 3 beds |
$450,000
|
show details |

|
#28
Celebration St
Chino, CA 91708
|
1,644 sq. feet
|
2 baths 3 beds |
show details | |

|
#29
Apple Court
Upland, CA 91786
|
1,655 sq. feet
|
2 baths 2 beds |
show details | |

|
#30
E Merion St
Ontario, CA 91761
|
2,220 sq. feet
|
2 baths 4 beds |
show details |
| Photo | Address | Area | Beds / Baths | Price | Details |
|---|---|---|---|---|---|

|
#31
Churchill Dr
Rancho Cucamonga, CA 91739
|
4,857 sq. feet
|
6 baths 4 beds |
show details | |

|
#32
Basetdale Ave
La Puente, CA 91746
|
1,328 sq. feet
|
2 baths 4 beds |
show details | |

|
#33
East Chip Smith Way
Ontario, CA 91762
|
1,656 sq. feet
|
2 baths 3 beds |
show details | |

|
#34
Sylvan Glen Rd Unit E
Diamond Bar, CA 91765
|
999 sq. feet
|
2 baths 2 beds |
show details | |

|
#35
W 4th St
Ontario, CA 91762
|
1,248 sq. feet
|
2 baths 3 beds |
show details | |

|
#36
N Vista Bonita Ave
Glendora, CA 91741
|
3,934 sq. feet
|
3 baths 4 beds |
show details | |

|
#37
Meadow View Dr
Pomona, CA 91766
|
1,538 sq. feet
|
2 baths 4 beds |
show details | |

|
#38
S Bender Ave
Glendora, CA 91740
|
1,410 sq. feet
|
2 baths 3 beds |
show details | |

|
#39
Roberts Pl
Rancho Cucamonga, CA 91739
|
2,905 sq. feet
|
3 baths 4 beds |
show details | |

|
#40
Roberts Pl
Rancho Cucamonga, CA 91739
|
2,905 sq. feet
|
3 baths 4 beds |
show details |
| Photo | Address | Area | Beds / Baths | Price | Details |
|---|---|---|---|---|---|

|
#41
Skyview Cir
Pomona, CA 91766
|
2,060 sq. feet
|
3 baths 4 beds |
show details | |

|
#42
Englewild Dr
Glendora, CA 91741
|
4,585 sq. feet
|
4 baths 4 beds |
show details | |

|
#43
Pamela Ln
La Habra, CA 90631
|
2,848 sq. feet
|
3 baths 5 beds |
show details | |

|
#44
N Traymore Ave
Covina, CA 91722
|
1,755 sq. feet
|
2 baths 4 beds |
show details | |

|
#45
Lansdale Ave
El Monte, CA 91732
|
1,866 sq. feet
|
3 baths 6 beds |
show details | |

|
#46
Bryant Rd
El Monte, CA 91731
|
1,080 sq. feet
|
1 baths 2 beds |
show details | |

|
#47
Highland Oaks Dr
Arcadia, CA 91006
|
2,212 sq. feet
|
3 baths 3 beds |
show details | |

|
#48
Topaz Ave
La Habra, CA 90631
|
2,481 sq. feet
|
3 baths 5 beds |
show details | |

|
#49
S Towne Ave
Pomona, CA 91766
|
1,980 sq. feet
|
3 baths 3 beds |
show details | |

|
Check over 1 million property listings on Foreclosure.com!
|
browse all offers | |||


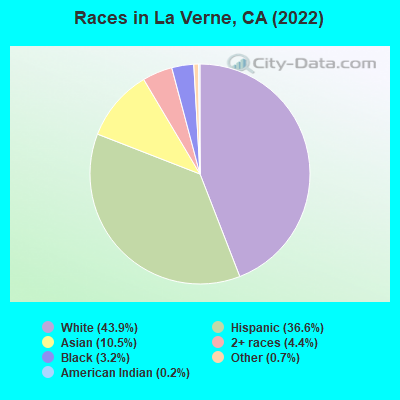
- 13,41243.9%White alone
- 11,18236.6%Hispanic
- 3,20010.5%Asian alone
- 1,3494.4%Two or more races
- 9723.2%Black alone
- 2260.7%Other race alone
- 740.2%American Indian alone
- 90.03%Native Hawaiian and Other
Pacific Islander alone
According to our research of California and other state lists, there were 25 registered sex offenders living in La Verne, California as of April 27, 2024.
The ratio of all residents to sex offenders in La Verne is 1,293 to 1.
The ratio of registered sex offenders to all residents in this city is lower than the state average.
Type |
2009 |
2010 |
2011 |
2012 |
2013 |
2014 |
2015 |
2016 |
2017 |
2018 |
2019 |
2020 |
2021 |
2022 |
|---|---|---|---|---|---|---|---|---|---|---|---|---|---|---|
| Murders (per 100,000) | 0 (0.0) | 0 (0.0) | 0 (0.0) | 0 (0.0) | 0 (0.0) | 0 (0.0) | 0 (0.0) | 0 (0.0) | 0 (0.0) | 0 (0.0) | 1 (3.1) | 0 (0.0) | 0 (0.0) | 0 (0.0) |
| Rapes (per 100,000) | 3 (8.9) | 4 (12.9) | 1 (3.2) | 8 (25.3) | 1 (3.2) | 14 (43.7) | 29 (89.0) | 11 (33.3) | 11 (33.7) | 18 (55.1) | 6 (18.6) | 8 (24.9) | 11 (34.1) | 10 (33.3) |
| Robberies (per 100,000) | 27 (79.8) | 18 (57.9) | 13 (41.4) | 15 (47.5) | 21 (66.8) | 14 (43.7) | 18 (55.2) | 10 (30.3) | 27 (82.8) | 11 (33.7) | 13 (40.2) | 11 (34.3) | 9 (27.9) | 17 (56.6) |
| Assaults (per 100,000) | 25 (73.9) | 34 (109.5) | 49 (155.9) | 27 (85.5) | 15 (47.7) | 18 (56.1) | 21 (64.4) | 20 (60.6) | 54 (165.6) | 58 (177.6) | 31 (95.8) | 25 (77.9) | 27 (83.6) | 30 (99.8) |
| Burglaries (per 100,000) | 146 (431.4) | 130 (418.5) | 135 (429.6) | 142 (449.7) | 158 (502.6) | 169 (527.0) | 187 (573.7) | 121 (366.5) | 137 (420.1) | 129 (395.0) | 133 (411.2) | 94 (293.1) | 114 (353.1) | 123 (409.2) |
| Thefts (per 100,000) | 511 (1,510) | 477 (1,536) | 481 (1,530) | 637 (2,017) | 548 (1,743) | 606 (1,890) | 693 (2,126) | 409 (1,239) | 563 (1,726) | 538 (1,647) | 447 (1,382) | 485 (1,512) | 513 (1,589) | 489 (1,627) |
| Auto thefts (per 100,000) | 40 (118.2) | 36 (115.9) | 31 (98.6) | 44 (139.4) | 47 (149.5) | 45 (140.3) | 48 (147.3) | 31 (93.9) | 66 (202.4) | 75 (229.7) | 47 (145.3) | 63 (196.4) | 40 (123.9) | 52 (173.0) |
| Arson (per 100,000) | 2 (5.9) | 3 (9.7) | 4 (12.7) | 3 (9.5) | 1 (3.2) | 3 (9.4) | 11 (33.7) | 8 (24.2) | 3 (9.2) | 1 (3.1) | 2 (6.2) | 8 (24.9) | 0 (0.0) | 1 (3.3) |
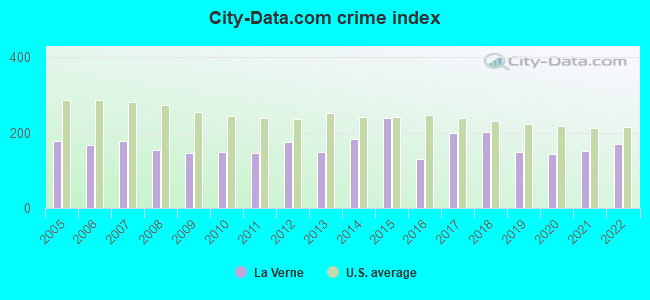
| City-Data.com crime index | 145.9 | 149.6 | 145.3 | 174.9 | 149.0 | 183.0 | 237.6 | 130.6 | 199.6 | 201.6 | 147.9 | 142.5 | 150.5 | 171.1 |
The City-Data.com crime index weighs serious crimes and violent crimes more heavily. Higher means more crime, U.S. average is 246.1. It adjusts for the number of visitors and daily workers commuting into cities.
Crime rate in La Verne detailed stats: murders, rapes, robberies, assaults, burglaries, thefts, arson
Full-time law enforcement employees in 2021, including police officers: 59 (41 officers - 36 male; 5 female).
| Officers per 1,000 residents here: | 1.27 |
| California average: | 2.30 |
 Recent articles from our blog. Our writers, many of them Ph.D. graduates or candidates, create easy-to-read articles on a wide variety of topics.

 | Anyone moved to Texas and moved back to LA? (220 replies) |
| Bay Area exodus: Residents still want out, new poll finds. Here’s who is most anxious to leave (229 replies) |
| Is the Pomona/LA Verne border safe? (5 replies) |
| Is the La Verne/Pomona border safe? (4 replies) |
| White middle class in Los Angeles and Orange County (17 replies) |
| Commuting to Pasadena- Better from East or West? (12 replies) |
Latest news from La Verne, CA collected exclusively by city-data.com from local newspapers, TV, and radio stations
Ancestries: German (4.7%), English (4.4%), Italian (4.0%), Irish (3.1%), American (3.0%), Armenian (2.7%).
Current Local Time: PST time zone
Elevation: 1060 feet
Land area: 8.31 square miles.
Population density: 3,654 people per square mile (average).
5,166 residents are foreign born (9.3% Asia, 5.6% Latin America).
| This city: | 16.9% |
| California: | 26.5% |
Median real estate property taxes paid for housing units with mortgages in 2022: $6,010 (0.7%)
Median real estate property taxes paid for housing units with no mortgage in 2022: $3,218 (0.5%)
Nearest city with pop. 50,000+: Pomona, CA  (3.8 miles , pop. 149,473).
Nearest city with pop. 200,000+: East San Gabriel Valley, CA (6.1 miles , pop. 933,557).
Nearest city with pop. 1,000,000+: Los Angeles, CA (34.7 miles , pop. 3,694,820).
Nearest cities:
), Latitude: 34.11 N, Longitude: 117.77 W
Daytime population change due to commuting: -2,440 (-8.0%)
Workers who live and work in this city: 4,029 (28.3%)
Area code commonly used in this area: 909
Property values in La Verne, CA

La Verne, California accommodation & food services, waste management - Economy and Business Data
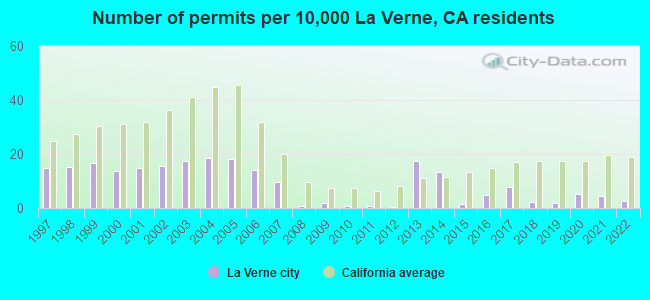
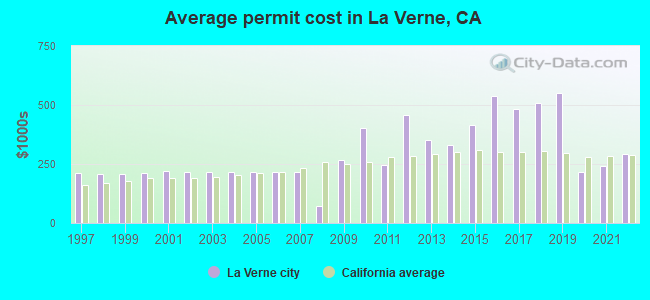
Single-family new house construction building permits:
- 2022: 8 buildings, average cost: $293,100
- 2021: 14 buildings, average cost: $239,700
- 2020: 17 buildings, average cost: $215,900
- 2019: 6 buildings, average cost: $549,200
- 2018: 7 buildings, average cost: $508,900
- 2017: 25 buildings, average cost: $482,900
- 2016: 15 buildings, average cost: $537,900
- 2015: 5 buildings, average cost: $416,100
- 2014: 42 buildings, average cost: $329,800
- 2013: 55 buildings, average cost: $353,100
- 2012: 1 building, cost: $456,000
- 2011: 2 buildings, average cost: $247,000
- 2010: 2 buildings, average cost: $403,500
- 2009: 6 buildings, average cost: $268,500
- 2008: 2 buildings, average cost: $69,500
- 2007: 30 buildings, average cost: $217,500
- 2006: 44 buildings, average cost: $217,400
- 2005: 57 buildings, average cost: $217,500
- 2004: 59 buildings, average cost: $217,400
- 2003: 55 buildings, average cost: $217,600
- 2002: 49 buildings, average cost: $216,700
- 2001: 47 buildings, average cost: $220,700
- 2000: 43 buildings, average cost: $210,700
- 1999: 53 buildings, average cost: $207,700
- 1998: 48 buildings, average cost: $206,300
- 1997: 47 buildings, average cost: $212,000
| Here: | 4.7% |
| California: | 5.1% |
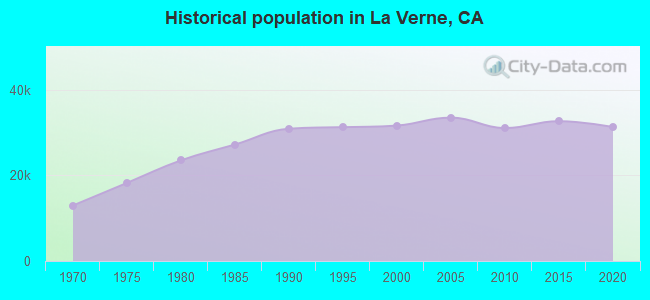
Population change in the 1990s: +748 (+2.4%).
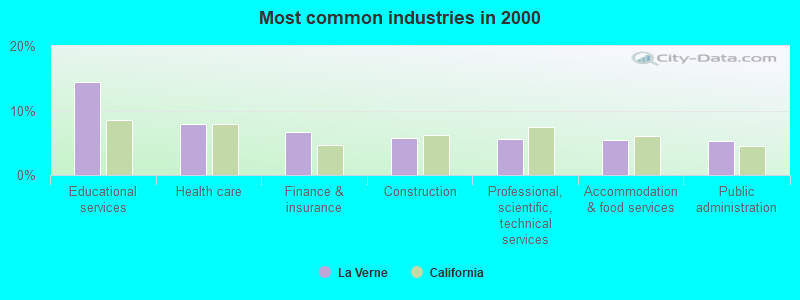
- Educational services (14.4%)
- Health care (7.9%)
- Finance & insurance (6.6%)
- Construction (5.7%)
- Professional, scientific, technical services (5.6%)
- Accommodation & food services (5.4%)
- Public administration (5.3%)
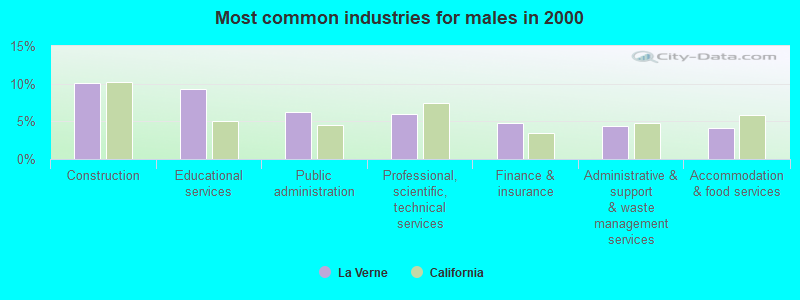
- Construction (10.1%)
- Educational services (9.3%)
- Public administration (6.3%)
- Professional, scientific, technical services (5.9%)
- Finance & insurance (4.8%)
- Administrative & support & waste management services (4.4%)
- Accommodation & food services (4.1%)
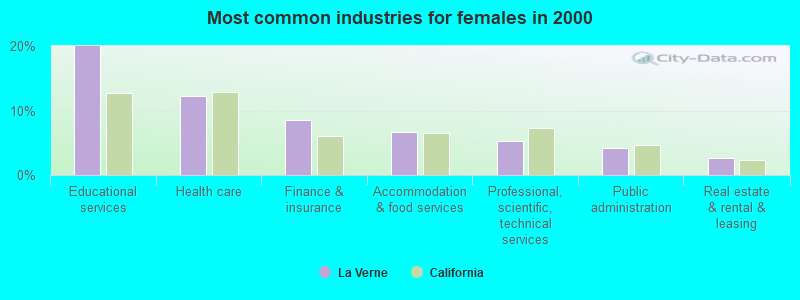
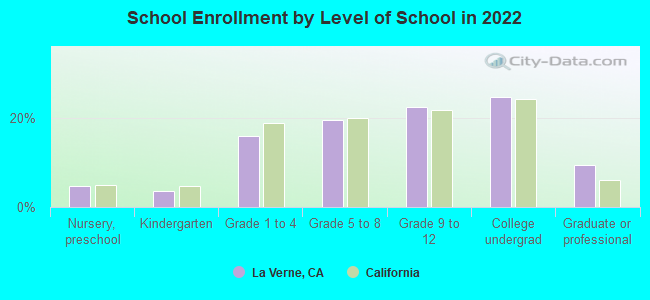
- Educational services (19.9%)
- Health care (12.2%)
- Finance & insurance (8.5%)
- Accommodation & food services (6.7%)
- Professional, scientific, technical services (5.2%)
- Public administration (4.3%)
- Real estate & rental & leasing (2.7%)
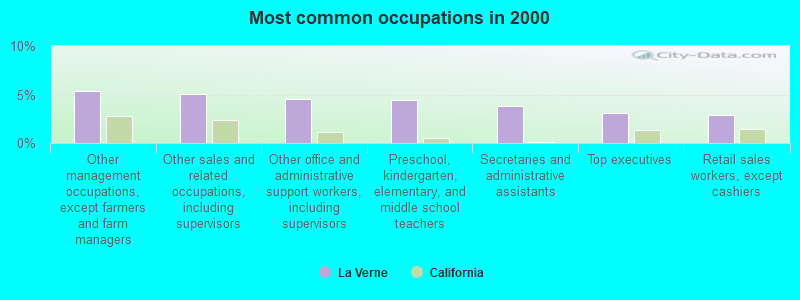
- Other management occupations, except farmers and farm managers (5.4%)
- Other sales and related occupations, including supervisors (5.0%)
- Other office and administrative support workers, including supervisors (4.6%)
- Preschool, kindergarten, elementary, and middle school teachers (4.4%)
- Secretaries and administrative assistants (3.8%)
- Top executives (3.1%)
- Retail sales workers, except cashiers (2.9%)
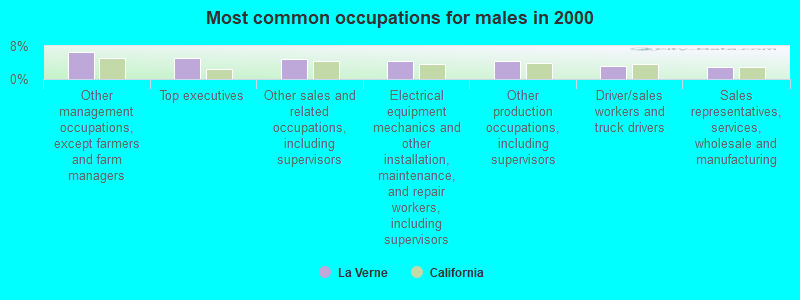
- Other management occupations, except farmers and farm managers (6.6%)
- Top executives (5.1%)
- Other sales and related occupations, including supervisors (4.9%)
- Electrical equipment mechanics and other installation, maintenance, and repair workers, including supervisors (4.3%)
- Other production occupations, including supervisors (4.2%)
- Driver/sales workers and truck drivers (3.1%)
- Sales representatives, services, wholesale and manufacturing (2.8%)
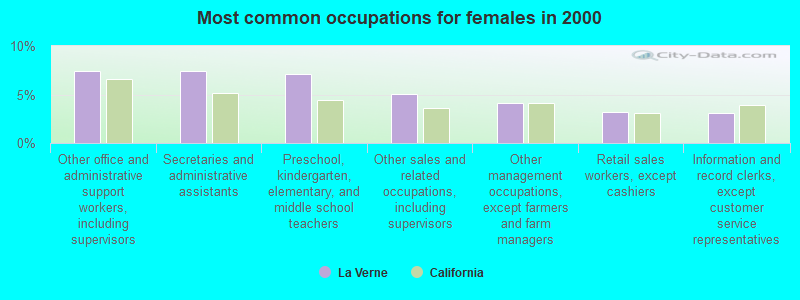
- Other office and administrative support workers, including supervisors (7.5%)
- Secretaries and administrative assistants (7.4%)
- Preschool, kindergarten, elementary, and middle school teachers (7.2%)
- Other sales and related occupations, including supervisors (5.1%)
- Other management occupations, except farmers and farm managers (4.1%)
- Retail sales workers, except cashiers (3.2%)
- Information and record clerks, except customer service representatives (3.1%)
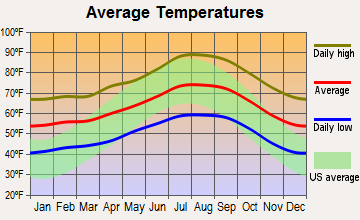
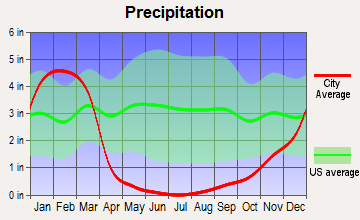
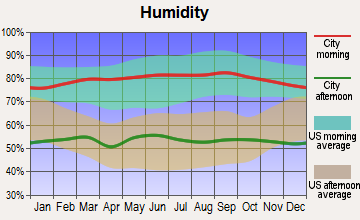
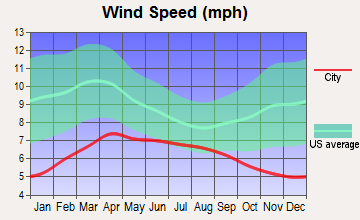
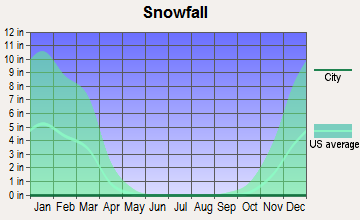
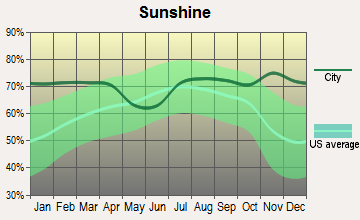
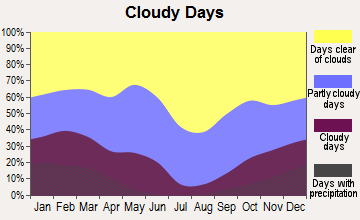
Average climate in La Verne, California
Based on data reported by over 4,000 weather stations
|
|

(lower is better)
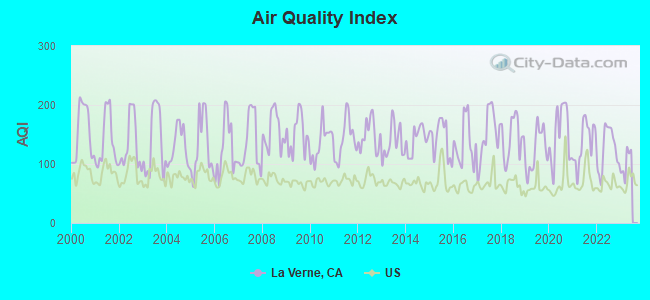
Air Quality Index (AQI) level in 2022 was 125. This is significantly worse than average.
| City: | 125 |
| U.S.: | 73 |
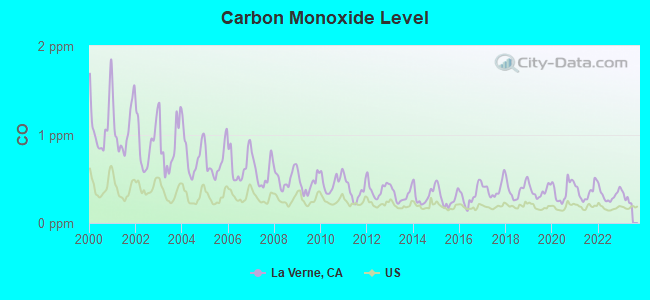
Carbon Monoxide (CO) [ppm] level in 2022 was 0.316. This is worse than average. Closest monitor was 3.5 miles away from the city center.
| City: | 0.316 |
| U.S.: | 0.251 |
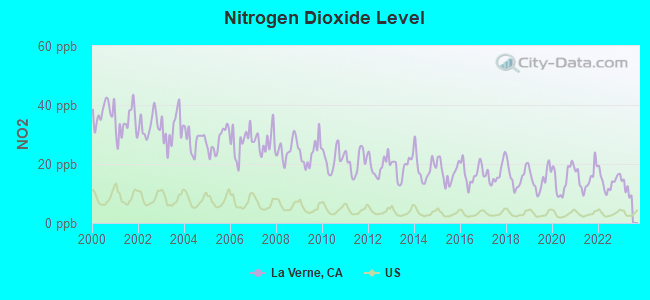
Nitrogen Dioxide (NO2) [ppb] level in 2022 was 14.1. This is significantly worse than average. Closest monitor was 3.5 miles away from the city center.
| City: | 14.1 |
| U.S.: | 5.1 |
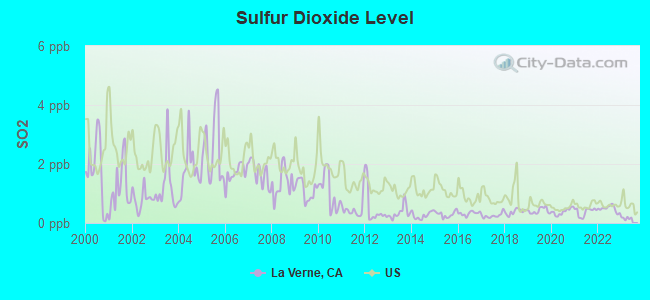
Sulfur Dioxide (SO2) [ppb] level in 2022 was 0.484. This is significantly better than average. Closest monitor was 3.5 miles away from the city center.
| City: | 0.484 |
| U.S.: | 1.515 |
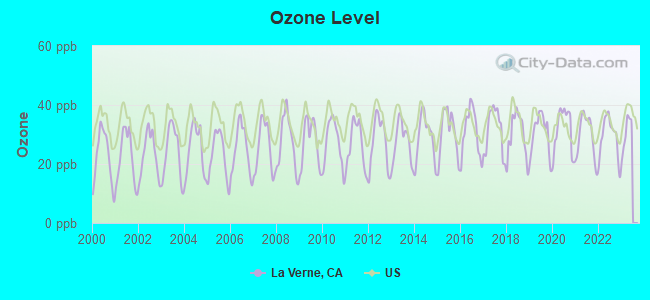
Ozone [ppb] level in 2022 was 29.1. This is about average. Closest monitor was 4.9 miles away from the city center.
| City: | 29.1 |
| U.S.: | 33.3 |
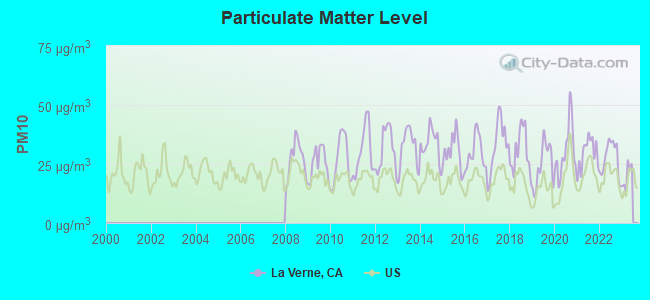
Particulate Matter (PM10) [µg/m3] level in 2022 was 27.5. This is significantly worse than average. Closest monitor was 5.0 miles away from the city center.
| City: | 27.5 |
| U.S.: | 19.2 |
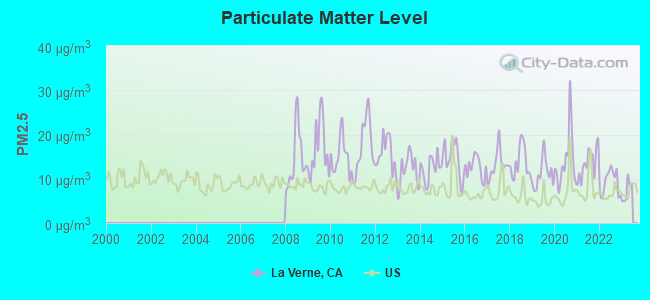
Particulate Matter (PM2.5) [µg/m3] level in 2022 was 9.30. This is about average. Closest monitor was 7.1 miles away from the city center.
| City: | 9.30 |
| U.S.: | 8.11 |
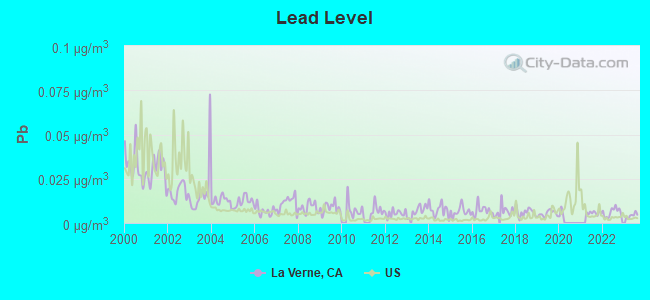
Lead (Pb) [µg/m3] level in 2023 was 0.00426. This is significantly better than average. Closest monitor was 5.0 miles away from the city center.
| City: | 0.00426 |
| U.S.: | 0.00931 |
Earthquake activity:
La Verne-area historical earthquake activity is significantly above California state average. It is 7266% greater than the overall U.S. average.On 7/21/1952 at 11:52:14, a magnitude 7.7 (7.7 UK, Class: Major, Intensity: VIII - XII) earthquake occurred 93.0 miles away from the city center, causing $50,000,000 total damage
On 6/28/1992 at 11:57:34, a magnitude 7.6 (6.2 MB, 7.6 MS, 7.3 MW, Depth: 0.7 mi) earthquake occurred 71.1 miles away from the city center, causing 3 deaths (1 shaking deaths, 2 other deaths) and 400 injuries, causing $100,000,000 total damage and $40,000,000 insured losses
On 10/16/1999 at 09:46:44, a magnitude 7.4 (6.3 MB, 7.4 MS, 7.2 MW, 7.3 ML) earthquake occurred 81.2 miles away from the city center
On 11/4/1927 at 13:51:53, a magnitude 7.5 (7.5 UK) earthquake occurred 193.8 miles away from the city center
On 4/21/1918 at 22:32:30, a magnitude 6.8 (6.8 UK, Class: Strong, Intensity: VII - IX) earthquake occurred 28.3 miles away from La Verne center
On 6/28/1992 at 15:05:30, a magnitude 6.9 (6.3 MB, 6.7 MS, 6.5 MW, 6.9 ME, Depth: 3.1 mi) earthquake occurred 55.9 miles away from La Verne center
Magnitude types: body-wave magnitude (MB), energy magnitude (ME), local magnitude (ML), surface-wave magnitude (MS), moment magnitude (MW)
Natural disasters:
The number of natural disasters in Los Angeles County (57) is a lot greater than the US average (15).Major Disasters (Presidential) Declared: 27
Emergencies Declared: 3
Causes of natural disasters: Fires: 37, Floods: 16, Storms: 9, Winter Storms: 6, Landslides: 5, Mudslides: 5, Earthquakes: 3, Freeze: 1, Heavy Rain: 1, Hurricane: 1, Snow: 1, Tornado: 1, Wind: 1, Other: 1 (Note: some incidents may be assigned to more than one category).

Hospitals and medical centers in La Verne:
- STAR HOME HEALTH RESOURCES, INC (1768 ARROW HIGHWAY, SUITE 105)
- WOODS HEALTH SERVICES (2600 A STREET)
Other hospitals and medical centers near La Verne:
- FLORINDA STREET HOME (Hospital, about 2 miles away; POMONA, CA)
- MARKWAY HOUSE (Hospital, about 2 miles away; POMONA, CA)
- CLAREMONT CARE CENTER (Nursing Home, about 2 miles away; POMONA, CA)
- CASA BONITA CONVALESCENT (Nursing Home, about 2 miles away; SAN DIMAS, CA)
- CASA COLINA HOSP DP/SNF (Nursing Home, about 2 miles away; POMONA, CA)
- ROYALE HOME HEALTH CARE, INC (Home Health Center, about 3 miles away; SAN DIMAS, CA)
- GAREY DIALYSIS CENTER PARTNERSHIP (Dialysis Facility, about 3 miles away; POMONA, CA)
Airports located in La Verne:
- Brackett Field Airport (POC) (Runways: 2, Air Taxi Ops: 600, Itinerant Ops: 61,304, Local Ops: 53,304, Military Ops: 400)
Amtrak stations near La Verne:
- 4 miles: CLAREMONT (200 W. 1ST ST.) - Bus Station . Services: fully wheelchair accessible, public payphones, full-service food facilities, free short-term parking, free long-term parking, call for car rental service, call for taxi service, public transit connection.
- 4 miles: POMONA (156 W. COMMERCIAL ST.) . Services: partially wheelchair accessible, public payphones, free short-term parking, free long-term parking, call for taxi service, public transit connection.
- 8 miles: ONTARIO (228 S. PLUM ST.) . Services: fully wheelchair accessible, public payphones, vending machines, free short-term parking, call for taxi service.
College/University in La Verne:
Other colleges/universities with over 2000 students near La Verne:
- DeVry University-California (about 5 miles; Pomona, CA; Full-time enrollment: 10,875)
- California State Polytechnic University-Pomona (about 5 miles; Pomona, CA; FT enrollment: 18,141)
- Mt San Antonio College (about 7 miles; Walnut, CA; FT enrollment: 19,891)
- Citrus College (about 7 miles; Glendora, CA; FT enrollment: 8,456)
- Azusa Pacific University (about 7 miles; Azusa, CA; FT enrollment: 9,427)
- Universal Technical Institute of California Inc (about 12 miles; Rancho Cucamonga, CA; FT enrollment: 4,158)
- Chaffey College (about 12 miles; Rancho Cucamonga, CA; FT enrollment: 10,496)
Public high schools in La Verne:
- CRESCENTA VALLEY HIGH (Students: 2,140, Location: 2900 COMM AVE., Grades: 9-12)
- ANDERSON W. CLARK MAGNET HIGH (Students: 842, Location: 4747 NEW YORK AVE., Grades: 9-12)
- LOS ANGELES COUNTY ONLINE HIGH (Students: 185, Location: 2600 FOOTHILL BLVD, #301, Grades: 9-12, Charter school)
- VERDUGO ACADEMY (Location: 4717 DUNSMORE AVE., Grades: KG-12)
Private high school in La Verne:
Public elementary/middle schools in La Verne:
- ROSEMONT MIDDLE (Students: 1,348, Location: 4725 ROSEMONT AVE., Grades: 7-8)
- MONTE VISTA ELEMENTARY (Students: 426, Location: 2620 ORANGE AVE., Grades: KG-6)
- MOUNTAIN AVENUE ELEMENTARY (Students: 411, Location: 2307 MOUNTAIN AVE., Grades: KG-6)
- ABRAHAM LINCOLN ELEMENTARY (Students: 365, Location: 4310 NEW YORK AVE., Grades: KG-6)
- DUNSMORE ELEMENTARY (Students: 340, Location: 4717 DUNSMORE AVE., Grades: KG-6)
- VALLEY VIEW ELEMENTARY (Students: 315, Location: 4900 MARYLAND AVE., Grades: KG-6)
- LA CRESCENTA ELEMENTARY (Location: 4343 LA CRESCENTA AVE., Grades: KG-6)
Private elementary/middle school in La Verne:
Points of interest:
Notable locations in La Verne: Weymouth Filtration Plant (A), Sierra La Verne Golf Course (B), Veterans Hall (C), La Verne Community Center (D), La Verne City Hall (E), La Verne Branch County of Los Angeles Public Library (F), La Verne Fire Department Station 2 (G), La Verne Fire Department Station 1 Headquarters (H). Display/hide their locations on the map
Churches in La Verne include: Church of Christ (A), Church of the Brethren (B), First Baptist Church of La Verne (C), First Foursquare Gospel Church of La Verne (D), House of Praise (E), La Verne Heights Presbyterian Church (F), Love and Faith World Outreach Church (G), Saint Lukes Anglican Catholic Church (H), United Methodist Church of La Verne (I). Display/hide their locations on the map
Cemetery: Evergreen Cemetery (1). Display/hide its location on the map
Creek: Marshall Creek (A). Display/hide its location on the map
Parks in La Verne include: Spartan Stadium (1), Kuns Park (2), Emerald Park (3), Heritage Park (4), La Verne Recreation Park (5), Las Flores Park (6), Lincoln Mini Park (7), Los Encinos Park (8), Lowell Brandt Park (9). Display/hide their locations on the map
Birthplace of: Noah Clarke - Ice hockey player, Evan Ellingson - Actor, Freddie Brown (American football) - Football player.
| This city: | 2.7 people |
| California: | 2.9 people |
| This city: | 72.9% |
| Whole state: | 68.7% |
| This city: | 4.4% |
| Whole state: | 7.2% |
Likely homosexual households (counted as self-reported same-sex unmarried-partner households)
- Lesbian couples: 0.4% of all households
- Gay men: 0.2% of all households
People in group quarters in La Verne in 2010:
- 414 people in college/university student housing
- 104 people in nursing facilities/skilled-nursing facilities
- 59 people in residential treatment centers for juveniles (non-correctional)
- 54 people in workers' group living quarters and job corps centers
- 26 people in group homes intended for adults
- 12 people in group homes for juveniles (non-correctional)
- 7 people in residential treatment centers for adults
People in group quarters in La Verne in 2000:
- 435 people in college dormitories (includes college quarters off campus)
- 156 people in nursing homes
- 70 people in other noninstitutional group quarters
- 22 people in homes for the mentally retarded
- 16 people in homes for the physically handicapped
- 6 people in other group homes
- 3 people in local jails and other confinement facilities (including police lockups)
Banks with branches in La Verne (2011 data):
- OneWest Bank, FSB: 1413 Foothill Boulevard Branch at 1413 Foothill Boulevard, branch established on 1997/03/31; 2111 Bonita Avenue Branch at 2111 Bonita Avenue, branch established on 1936/07/06. Info updated 2011/07/21: Bank assets: $26,181.3 mil, Deposits: $15,408.4 mil, headquarters in Pasadena, CA, positive income, 79 total offices
- JPMorgan Chase Bank, National Association: La Verne Branch at 2086 Foothill Blvd., Suite B, branch established on 2005/11/28. Info updated 2011/11/10: Bank assets: $1,811,678.0 mil, Deposits: $1,190,738.0 mil, headquarters in Columbus, OH, positive income, International Specialization, 5577 total offices, Holding Company: Jpmorgan Chase & Co.
- California Bank & Trust: La Verne Branch at 2100 East Foothill Boulevard, branch established on 1981/05/20. Info updated 2009/07/20: Bank assets: $10,894.1 mil, Deposits: $9,193.9 mil, headquarters in San Diego, CA, positive income, Commercial Lending Specialization, 109 total offices, Holding Company: Zions Bancorporation
- Wells Fargo Bank, National Association: La Verne Branch at 1487 Foothill Boulevard, branch established on 2000/01/24. Info updated 2011/04/05: Bank assets: $1,161,490.0 mil, Deposits: $905,653.0 mil, headquarters in Sioux Falls, SD, positive income, 6395 total offices, Holding Company: Wells Fargo & Company
- Bank of America, National Association: La Verne Branch at 1399 East Foothill Boulevard, branch established on 1974/05/01. Info updated 2009/11/18: Bank assets: $1,451,969.3 mil, Deposits: $1,077,176.8 mil, headquarters in Charlotte, NC, positive income, 5782 total offices, Holding Company: Bank Of America Corporation
- U.S. Bank National Association: La Verne Branch at 1933 Foothill Blvd, branch established on 1892/01/01. Info updated 2012/01/30: Bank assets: $330,470.8 mil, Deposits: $236,091.5 mil, headquarters in Cincinnati, OH, positive income, 3121 total offices, Holding Company: U.S. Bancorp
For population 15 years and over in La Verne:
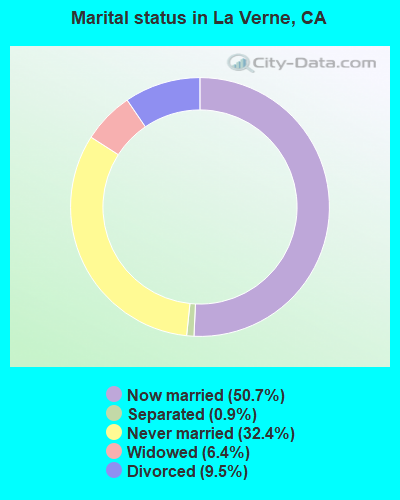
- Never married: 32.4%
- Now married: 50.7%
- Separated: 0.9%
- Widowed: 6.4%
- Divorced: 9.5%
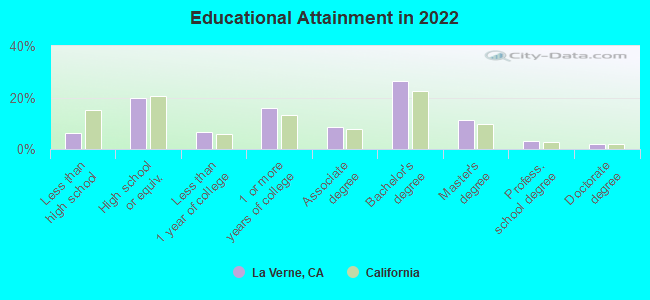
For population 25 years and over in La Verne:
- High school or higher: 93.5%
- Bachelor's degree or higher: 41.6%
- Graduate or professional degree: 15.7%
- Unemployed: 5.1%
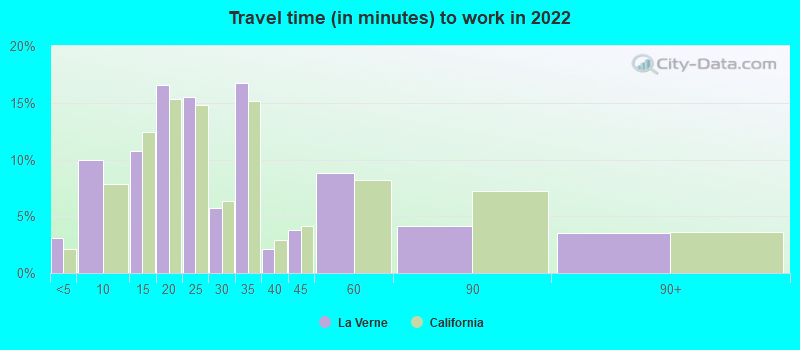
- Mean travel time to work (commute): 24.5 minutes
| Here: | 11.0 |
| California average: | 15.5 |


Graphs represent county-level data. Detailed 2008 Election Results
Neighborhoods in La Verne:
(La Verne, California Neighborhood Map)Religion statistics for La Verne, CA (based on Los Angeles County data)


| Religion | Adherents | Congregations |
|---|---|---|
| Catholic | 3,542,994 | 275 |
| Evangelical Protestant | 814,611 | 3,249 |
| Other | 451,594 | 1,023 |
| Mainline Protestant | 229,056 | 860 |
| Black Protestant | 112,338 | 290 |
| Orthodox | 63,517 | 76 |
| None | 4,604,495 | - |
Food Environment Statistics:
| Los Angeles County: | 2.12 / 10,000 pop. |
| California: | 2.14 / 10,000 pop. |
| Here: | 0.03 / 10,000 pop. |
| State: | 0.04 / 10,000 pop. |
| Los Angeles County: | 0.58 / 10,000 pop. |
| State: | 0.62 / 10,000 pop. |
| This county: | 1.23 / 10,000 pop. |
| California: | 1.49 / 10,000 pop. |
| Los Angeles County: | 7.15 / 10,000 pop. |
| California: | 7.42 / 10,000 pop. |
| Los Angeles County: | 7.5% |
| California: | 7.3% |
| Los Angeles County: | 20.4% |
| California: | 21.3% |
| Los Angeles County: | 18.6% |
| California: | 17.9% |
Health and Nutrition:
| La Verne: | 51.7% |
| California: | 49.4% |
| Here: | 50.5% |
| California: | 48.0% |
| La Verne: | 28.3 |
| California: | 28.1 |
| La Verne: | 19.5% |
| California: | 20.2% |
| La Verne: | 10.7% |
| State: | 11.2% |
| La Verne: | 6.8 |
| State: | 6.8 |
| Here: | 34.2% |
| California: | 31.5% |
| La Verne: | 58.0% |
| State: | 56.4% |
| This city: | 80.3% |
| California: | 80.9% |
More about Health and Nutrition of La Verne, CA Residents
| Local government employment and payroll (March 2022) | |||||
| Function | Full-time employees | Monthly full-time payroll | Average yearly full-time wage | Part-time employees | Monthly part-time payroll |
|---|---|---|---|---|---|
| Police Protection - Officers | 44 | $545,142 | $148,675 | 2 | $6,105 |
| Firefighters | 32 | $430,956 | $161,609 | 0 | $0 |
| Water Supply | 14 | $90,403 | $77,488 | 3 | $8,217 |
| Police - Other | 13 | $75,380 | $69,582 | 10 | $11,363 |
| Health | 12 | $19,059 | $19,059 | 0 | $0 |
| Other Government Administration | 11 | $96,601 | $105,383 | 7 | $5,747 |
| Financial Administration | 8 | $50,384 | $75,576 | 2 | $5,438 |
| Parks and Recreation | 8 | $37,577 | $56,366 | 35 | $37,691 |
| Streets and Highways | 6 | $34,585 | $69,170 | 1 | $2,978 |
| Other and Unallocable | 5 | $30,234 | $72,562 | 0 | $0 |
| Solid Waste Management | 4 | $29,276 | $87,828 | 0 | $0 |
| Fire - Other | 2 | $9,292 | $55,752 | 0 | $0 |
| Sewerage | 1 | $6,896 | $82,752 | 0 | $0 |
| Totals for Government | 160 | $1,455,786 | $109,184 | 60 | $77,538 |
La Verne government finances - Expenditure in 2017 (per resident):
- Construction - Water Utilities: $536,000 ($17.64)
Police Protection: $385,000 ($12.67)
Transit Utilities: $310,000 ($10.20)
Regular Highways: $285,000 ($9.38)
Local Fire Protection: $193,000 ($6.35)
Sewerage: $187,000 ($6.16)
Housing and Community Development: $118,000 ($3.88)
- Current Operations - Police Protection: $12,960,000 ($426.60)
Water Utilities: $8,701,000 ($286.41)
Local Fire Protection: $5,152,000 ($169.59)
Central Staff Services: $4,357,000 ($143.42)
Parks and Recreation: $3,567,000 ($117.41)
Health - Other: $3,338,000 ($109.87)
Regular Highways: $2,287,000 ($75.28)
Solid Waste Management: $2,263,000 ($74.49)
Housing and Community Development: $1,349,000 ($44.40)
General - Other: $1,320,000 ($43.45)
Transit Utilities: $1,296,000 ($42.66)
Sewerage: $1,072,000 ($35.29)
Protective Inspection and Regulation - Other: $781,000 ($25.71)
Financial Administration: $519,000 ($17.08)
- General - Interest on Debt: $856,000 ($28.18)
- Intergovernmental to Local - Other - General - Other: $100,000 ($3.29)
- Other Capital Outlay - Water Utilities: $1,091,000 ($35.91)
General - Other: $376,000 ($12.38)
Parks and Recreation: $202,000 ($6.65)
Central Staff Services: $117,000 ($3.85)
La Verne government finances - Revenue in 2017 (per resident):
- Charges - Other: $6,769,000 ($222.81)
Solid Waste Management: $2,577,000 ($84.83)
Sewerage: $1,469,000 ($48.35)
Parks and Recreation: $1,346,000 ($44.31)
Regular Highways: $162,000 ($5.33)
- Federal Intergovernmental - Other: $44,000 ($1.45)
Housing and Community Development: $19,000 ($0.63)
- Local Intergovernmental - Other: $207,000 ($6.81)
- Miscellaneous - Rents: $2,277,000 ($74.95)
Interest Earnings: $986,000 ($32.46)
Fines and Forfeits: $899,000 ($29.59)
General Revenue - Other: $468,000 ($15.40)
- Revenue - Water Utilities: $9,272,000 ($305.20)
- State Intergovernmental - Other: $992,000 ($32.65)
Highways: $631,000 ($20.77)
General Local Government Support: $31,000 ($1.02)
- Tax - Property: $10,171,000 ($334.79)
General Sales and Gross Receipts: $6,091,000 ($200.49)
Public Utilities Sales: $3,459,000 ($113.86)
Other License: $2,259,000 ($74.36)
Occupation and Business License - Other: $484,000 ($15.93)
Documentary and Stock Transfer: $131,000 ($4.31)
La Verne government finances - Debt in 2017 (per resident):
- Long Term Debt - Beginning Outstanding - Unspecified Public Purpose: $14,960,000 ($492.43)
Outstanding Unspecified Public Purpose: $10,550,000 ($347.27)
Retired Unspecified Public Purpose: $4,410,000 ($145.16)
La Verne government finances - Cash and Securities in 2017 (per resident):
- Bond Funds - Cash and Securities: $10,081,000 ($331.83)
- Other Funds - Cash and Securities: $42,052,000 ($1384.20)
- Sinking Funds - Cash and Securities: $61,000 ($2.01)
2.98% of this county's 2021 resident taxpayers lived in other counties in 2020 ($81,235 average adjusted gross income)
| Here: | 2.98% |
| California average: | 5.19% |
0.01% of residents moved from foreign countries ($155 average AGI)
Los Angeles County: 0.01% California average: 0.03%
Top counties from which taxpayers relocated into this county between 2020 and 2021:
| from Orange County, CA | |
| from San Bernardino County, CA | |
| from Riverside County, CA |
4.68% of this county's 2020 resident taxpayers moved to other counties in 2021 ($97,324 average adjusted gross income)
| Here: | 4.68% |
| California average: | 6.14% |
0.01% of residents moved to foreign countries ($196 average AGI)
Los Angeles County: 0.01% California average: 0.02%
Top counties to which taxpayers relocated from this county between 2020 and 2021:
| to Orange County, CA | |
| to San Bernardino County, CA | |
| to Riverside County, CA |
| Businesses in La Verne, CA | ||||
| Name | Count | Name | Count | |
|---|---|---|---|---|
| 7-Eleven | 1 | Little Caesars Pizza | 1 | |
| 99 Cents Only Stores | 1 | MasterBrand Cabinets | 1 | |
| AutoZone | 1 | McDonald's | 1 | |
| CVS | 1 | New Balance | 1 | |
| Carl\s Jr. | 1 | Nike | 3 | |
| Circle K | 1 | Panda Express | 1 | |
| Curves | 1 | Payless | 1 | |
| DHL | 2 | Pizza Hut | 1 | |
| Decora Cabinetry | 1 | Quiznos | 1 | |
| Dennys | 1 | RadioShack | 1 | |
| El Pollo Loco | 1 | Rite Aid | 1 | |
| Famous Footwear | 1 | Safeway | 1 | |
| FedEx | 4 | Starbucks | 4 | |
| GNC | 1 | Subway | 1 | |
| GameStop | 1 | T-Mobile | 3 | |
| H&R Block | 1 | Target | 1 | |
| IHOP | 1 | Toys"R"Us | 1 | |
| Jamba Juice | 1 | U-Haul | 1 | |
| Kohl's | 1 | UPS | 2 | |
| LA Fitness | 1 | Vons | 1 | |
Strongest AM radio stations in La Verne:
- KLAC (570 AM; 50 kW; LOS ANGELES, CA; Owner: AMFM RADIO LICENSES, L.L.C.)
- KTNQ (1020 AM; 50 kW; LOS ANGELES, CA; Owner: KTNQ-AM LICENSE CORP.)
- KDIS (1110 AM; 50 kW; PASADENA, CA; Owner: ABC,INC.)
- KXTA (1150 AM; 50 kW; LOS ANGELES, CA; Owner: CITICASTERS LICENSES, L.P.)
- KPLS (830 AM; 50 kW; ORANGE, CA; Owner: CRN LICENSES, LLC)
- KFI (640 AM; 50 kW; LOS ANGELES, CA; Owner: CAPSTAR TX LIMITED PARTNERSHIP)
- KFWB (980 AM; 50 kW; LOS ANGELES, CA; Owner: INFINITY BROADCASTING OPERATIONS, INC.)
- KSPA (1510 AM; 10 kW; ONTARIO, CA; Owner: ONTARIO BROADCASTING, LLC)
- KMNY (1600 AM; 5 kW; POMONA, CA; Owner: MULTICULTURAL RADIO BROADCASTING, INC.)
- KMPC (1540 AM; 50 kW; LOS ANGELES, CA; Owner: ROSE CITY RADIO CORPORATION)
- KALI (900 AM; 6 kW; WEST COVINA, CA; Owner: MULTICULTURAL RADIO BROADCASTING, INC.)
- KSPN (710 AM; 50 kW; LOS ANGELES, CA; Owner: KABC-AM RADIO, INC.)
- KBLA (1580 AM; 50 kW; SANTA MONICA, CA)
Strongest FM radio stations in La Verne:
- KRCV (98.3 FM; WEST COVINA, CA; Owner: HBC LICENSE CORPORATION)
- K264AF (100.7 FM; GUASTI, CA; Owner: EDUCATIONAL MEDIA FOUNDATION)
- KCBS-FM (93.1 FM; LOS ANGELES, CA; Owner: INFINITY BROADCASTING OPERATIONS, INC.)
- KSCA (101.9 FM; GLENDALE, CA; Owner: HBC LICENSE CORPORATION)
- KLOS (95.5 FM; LOS ANGELES, CA; Owner: KLOS-FM RADIO, INC.)
- KOST (103.5 FM; LOS ANGELES, CA; Owner: CAPSTAR TX LIMITED PARTNERSHIP)
- K212FA (90.3 FM; TEMPLE CITY, CA; Owner: EDUCATIONAL MEDIA FOUNDATION)
- KIIS-FM (102.7 FM; LOS ANGELES, CA; Owner: CITICASTERS LICENSES, L.P.)
- KLVE (107.5 FM; LOS ANGELES, CA; Owner: KLVE-FM LICENSE CORP.)
- KPCC (89.3 FM; PASADENA, CA; Owner: PASADENA AREA COMMUNITY COLLEGE DISTRICT)
- KHHT (92.3 FM; LOS ANGELES, CA; Owner: AMFM RADIO LICENSES, L.L.C.)
- KBIG-FM (104.3 FM; LOS ANGELES, CA; Owner: AMFM RADIO LICENSES, L.L.C.)
- KTWV (94.7 FM; LOS ANGELES, CA; Owner: INFINITY BROADCASTING OPERATIONS, INC.)
- KMZT-FM (105.1 FM; LOS ANGELES, CA; Owner: MOUNT WILSON FM BROADCASTERS, INC.)
- KPFK (90.7 FM; LOS ANGELES, CA; Owner: PACIFICA FOUNDATION, INC)
- K216EM (91.1 FM; ARCADIA, CA; Owner: LIFE ON THE WAY COMMUNICATIONS, INC.)
- KZLA-FM (93.9 FM; LOS ANGELES, CA; Owner: EMMIS RADIO LICENSE CORPORATION)
- KPWR (105.9 FM; LOS ANGELES, CA; Owner: EMMIS RADIO LICENSE CORPORATION)
- KLSX (97.1 FM; LOS ANGELES, CA; Owner: INFINITY BROADCASTING OPERATIONS, INC.)
- KUSC (91.5 FM; LOS ANGELES, CA; Owner: UNIVERSITY OF SOUTHERN CALIFORNIA)
TV broadcast stations around La Verne:
- KTRO-LP (Channel 50; LANCASTER, CA; Owner: ROBERT D. ADELMAN)
- KCBS-TV (Channel 2; LOS ANGELES, CA; Owner: CBS BROADCASTING INC.)
- KRCA (Channel 62; RIVERSIDE, CA; Owner: KRCA LICENSE CORP.)
- KPXN (Channel 30; SAN BERNARDINO, CA; Owner: PAXSON LOS ANGELES LICENSE, INC.)
- KHIZ (Channel 64; BARSTOW, CA; Owner: SUNBELT TELEVISION, INC.)
- KTLA-TV (Channel 5; LOS ANGELES, CA; Owner: KTLA INC.)
- KABC-TV (Channel 7; LOS ANGELES, CA; Owner: ABC HOLDING COMPANY, INC.)
- KCAL-TV (Channel 9; LOS ANGELES, CA; Owner: VIACOM TELEVISION STATIONS GROUP OF LOS ANGELES LLC)
- KNBC (Channel 4; LOS ANGELES, CA; Owner: NBC SUBSIDIARY (KNBC-TV), INC.)
- KMEX-TV (Channel 34; LOS ANGELES, CA; Owner: KMEX LICENSE PARTNERSHIP, G.P.)
- KAZA-TV (Channel 54; AVALON, CA; Owner: PAPPAS SOUTHERN CALIFORNIA LICENSE LLC)
- KDOC-TV (Channel 56; ANAHEIM, CA; Owner: GOLDEN ORANGE BROADCASTING CO., INC.)
- KOCE-TV (Channel 50; HUNTINGTON BEACH, CA; Owner: BD. OF TRUSTEES, COAST COMMUNITY COLLEGE DIST.)
- KSCI (Channel 18; LONG BEACH, CA; Owner: KSLS, INC.)
- KCET (Channel 28; LOS ANGELES, CA; Owner: COMMUNITY TELEVISION OF SOUTHERN CALIFORNIA)
- KXLA (Channel 44; RANCHO PALOS VERDES, CA; Owner: RANCHO PALOS VERDES BROADCASTERS, INC.)
- KFTR (Channel 46; ONTARIO, CA; Owner: TELEFUTURA LOS ANGELES LLC)
- KTTV (Channel 11; LOS ANGELES, CA; Owner: FOX TELEVISION STATIONS, INC.)
- KWHY-TV (Channel 22; LOS ANGELES, CA; Owner: TELEMUNDO OF LOS ANGELES LICENSE CORPORATION)
- KVEA (Channel 52; CORONA, CA; Owner: ESTRELLA LICENSE CORPORATION)
- KCOP-TV (Channel 13; LOS ANGELES, CA; Owner: FOX TELEVISION STATIONS, INC.)
- KTBN-TV (Channel 40; SANTA ANA, CA; Owner: TRINITY BROADCASTING NETWORK, INC.)
- KLCS (Channel 58; LOS ANGELES, CA; Owner: LOS ANGELES UNIFIED SCHOOL DISTRICT)
- National Bridge Inventory (NBI) Statistics
- 32Number of bridges
- 144ft / 44.3mTotal length
- 1,825,050Total average daily traffic
- 11,574Total average daily truck traffic
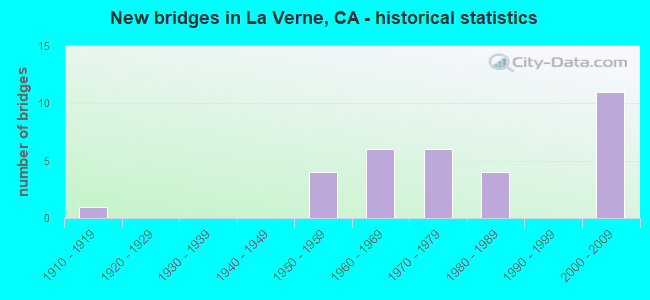
- New bridges - historical statistics
- 11910-1919
- 41950-1959
- 61960-1969
- 61970-1979
- 41980-1989
- 112000-2009
FCC Registered Broadcast Land Mobile Towers: 15 (See the full list of FCC Registered Broadcast Land Mobile Towers in La Verne, CA)
FCC Registered Microwave Towers: 27 (See the full list of FCC Registered Microwave Towers in this town)
FCC Registered Paging Towers: 1 (See the full list of FCC Registered Paging Towers)
FCC Registered Maritime Coast & Aviation Ground Towers: 2 (See the full list of FCC Registered Maritime Coast & Aviation Ground Towers)
FCC Registered Amateur Radio Licenses: 326 (See the full list of FCC Registered Amateur Radio Licenses in La Verne)
FAA Registered Aircraft Manufacturers and Dealers: 6 (See the full list of FAA Registered Manufacturers and Dealers in La Verne)
FAA Registered Aircraft: 50 (See the full list of FAA Registered Aircraft)
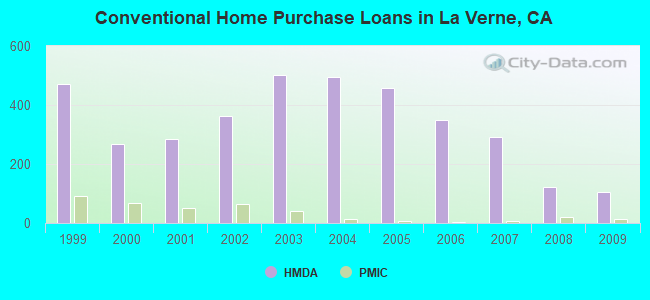
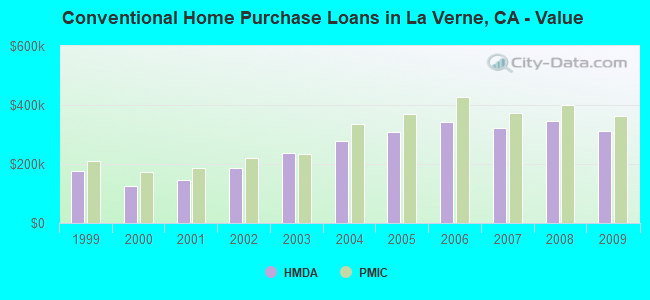
| Home Mortgage Disclosure Act Aggregated Statistics For Year 2009 (Based on 4 full and 3 partial tracts) | ||||||||||||||
| A) FHA, FSA/RHS & VA Home Purchase Loans | B) Conventional Home Purchase Loans | C) Refinancings | D) Home Improvement Loans | E) Loans on Dwellings For 5+ Families | F) Non-occupant Loans on < 5 Family Dwellings (A B C & D) | G) Loans On Manufactured Home Dwelling (A B C & D) | ||||||||
|---|---|---|---|---|---|---|---|---|---|---|---|---|---|---|
| Number | Average Value | Number | Average Value | Number | Average Value | Number | Average Value | Number | Average Value | Number | Average Value | Number | Average Value | |
| LOANS ORIGINATED | 72 | $353,019 | 104 | $312,835 | 715 | $303,957 | 39 | $229,380 | 0 | $0 | 34 | $259,711 | 15 | $55,199 |
| APPLICATIONS APPROVED, NOT ACCEPTED | 4 | $365,435 | 12 | $200,116 | 70 | $332,713 | 15 | $106,745 | 1 | $9,281,000 | 5 | $354,000 | 6 | $49,942 |
| APPLICATIONS DENIED | 12 | $313,192 | 30 | $215,412 | 212 | $339,380 | 19 | $167,452 | 1 | $9,210,000 | 13 | $238,129 | 21 | $57,562 |
| APPLICATIONS WITHDRAWN | 7 | $366,006 | 16 | $341,264 | 140 | $307,336 | 11 | $206,604 | 0 | $0 | 6 | $202,227 | 1 | $60,000 |
| FILES CLOSED FOR INCOMPLETENESS | 1 | $344,480 | 6 | $320,177 | 37 | $357,922 | 3 | $167,947 | 0 | $0 | 2 | $404,885 | 1 | $32,000 |
Detailed HMDA statistics for the following Tracts: 4002.03 , 4002.04, 4003.02, 4015.00, 4016.01, 4016.02, 4016.03
| Private Mortgage Insurance Companies Aggregated Statistics For Year 2009 (Based on 4 full and 3 partial tracts) | ||||
| A) Conventional Home Purchase Loans | B) Refinancings | |||
|---|---|---|---|---|
| Number | Average Value | Number | Average Value | |
| LOANS ORIGINATED | 12 | $363,796 | 8 | $374,010 |
| APPLICATIONS APPROVED, NOT ACCEPTED | 1 | $260,920 | 2 | $500,315 |
| APPLICATIONS DENIED | 0 | $0 | 4 | $418,588 |
| APPLICATIONS WITHDRAWN | 0 | $0 | 1 | $502,630 |
| FILES CLOSED FOR INCOMPLETENESS | 2 | $397,875 | 0 | $0 |
Detailed PMIC statistics for the following Tracts: 4002.03 , 4002.04, 4003.02, 4015.00, 4016.01, 4016.02, 4016.03
2002 - 2018 National Fire Incident Reporting System (NFIRS) incidents
- Fire incident types reported to NFIRS in La Verne, CA
- 30637.2%Outside Fires
- 26932.7%Structure Fires
- 18021.9%Mobile Property/Vehicle Fires
- 688.3%Other
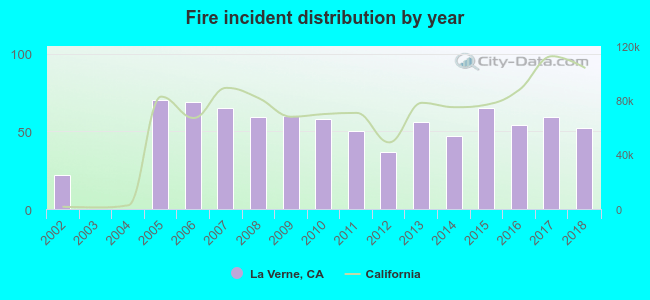 Based on the data from the years 2002 - 2018 the average number of fires per year is 48. The highest number of reported fires - 70 took place in 2005, and the least - 0 in 2003. The data has a rising trend.
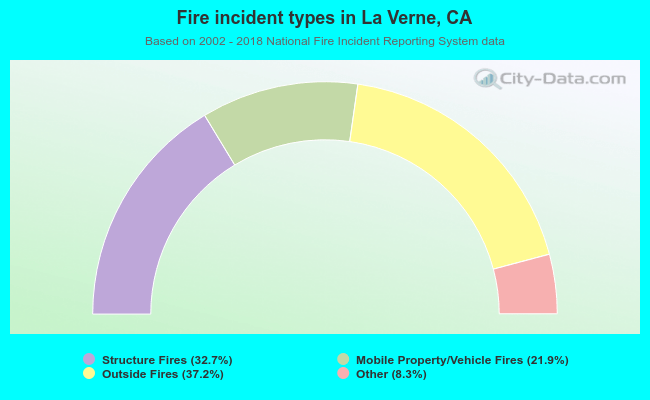 When looking into fire subcategories, the most reports belonged to: Outside Fires (37.2%), and Structure Fires (32.7%).
| Most common first names in La Verne, CA among deceased individuals | ||
| Name | Count | Lived (average) |
|---|---|---|
| Mary | 179 | 79.9 years |
| John | 156 | 78.4 years |
| William | 144 | 76.0 years |
| Robert | 141 | 73.6 years |
| James | 109 | 74.0 years |
| Helen | 88 | 81.1 years |
| Charles | 87 | 75.5 years |
| Ruth | 87 | 81.5 years |
| George | 85 | 75.9 years |
| Dorothy | 76 | 81.5 years |
| Most common last names in La Verne, CA among deceased individuals | ||
| Last name | Count | Lived (average) |
|---|---|---|
| Smith | 75 | 80.7 years |
| Johnson | 47 | 75.2 years |
| Miller | 45 | 80.3 years |
| Brown | 37 | 75.0 years |
| Lopez | 33 | 78.9 years |
| Jones | 31 | 81.6 years |
| Davis | 28 | 77.7 years |
| Moore | 25 | 82.6 years |
| Anderson | 23 | 79.6 years |
| Nelson | 23 | 79.1 years |
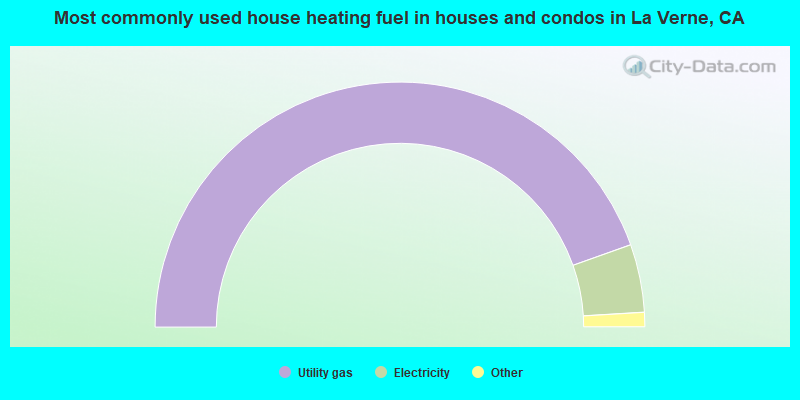
- 89.2%Utility gas
- 9.0%Electricity
- 0.8%Bottled, tank, or LP gas
- 0.6%Solar energy
- 0.4%No fuel used
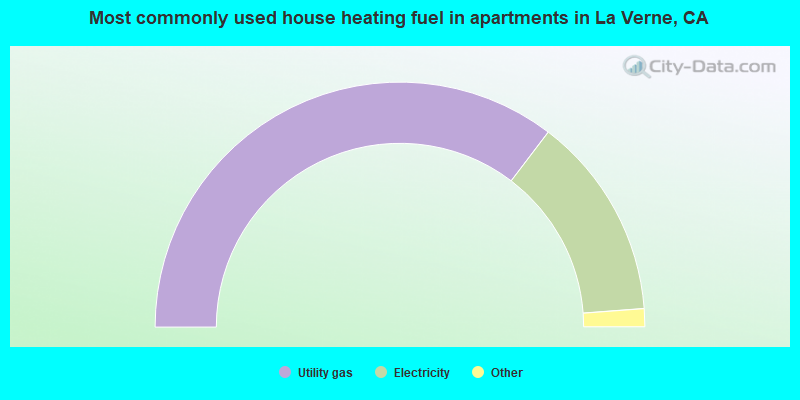
- 70.7%Utility gas
- 26.9%Electricity
- 1.5%No fuel used
- 0.9%Bottled, tank, or LP gas
La Verne compared to California state average:
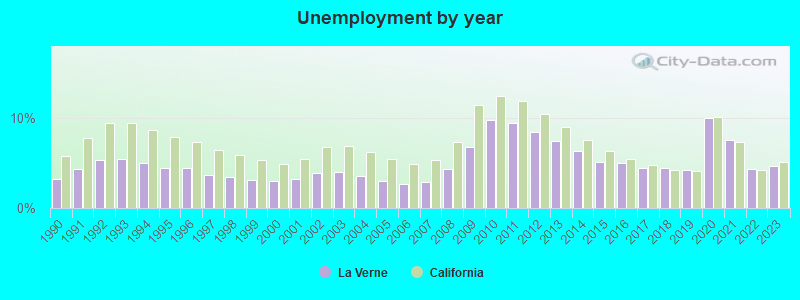
- Unemployed percentage significantly below state average.
- Median age significantly above state average.
- Foreign-born population percentage below state average.
- Renting percentage below state average.
- Length of stay since moving in above state average.
- Percentage of population with a bachelor's degree or higher above state average.
La Verne on our top lists:
- #97 on the list of "Top 101 cities with the most residents born in Syria (population 500+)"
- #1 on the list of "Top 101 counties with the most Evangelical Protestant congregations"
- #1 on the list of "Top 101 counties with the most Mainline Protestant congregations"
- #1 on the list of "Top 101 counties with the most Orthodox adherents"
- #1 on the list of "Top 101 counties with the highest ground withdrawal of fresh water for public supply (pop. 50,000+)"
- #1 on the list of "Top 101 counties with the most Catholic adherents (pop. 50,000+)"

|
|
Total of 111 patent applications in 2008-2024.