Glendora, California Submit your own pictures of this city and show them to the world
OSM Map
General Map
Google Map
MSN Map
OSM Map
General Map
Google Map
MSN Map
OSM Map
General Map
Google Map
MSN Map
OSM Map
General Map
Google Map
MSN Map
Please wait while loading the map...
Population in 2022: 50,824 (100% urban, 0% rural). Population change since 2000: +2.9%Males: 24,366 Females: 26,458
March 2022 cost of living index in Glendora: 137.0 (high, U.S. average is 100) Percentage of residents living in poverty in 2022: 7.2%for White Non-Hispanic residents , 14.7% for Black residents , 6.1% for Hispanic or Latino residents , 10.6% for American Indian residents , 5.6% for Native Hawaiian and other Pacific Islander residents , 8.4% for other race residents , 3.8% for two or more races residents )
Profiles of local businesses
Business Search - 14 Million verified businesses
Data:
Median household income ($)
Median household income (% change since 2000)
Household income diversity
Ratio of average income to average house value (%)
Ratio of average income to average rent
Median household income ($) - White
Median household income ($) - Black or African American
Median household income ($) - Asian
Median household income ($) - Hispanic or Latino
Median household income ($) - American Indian and Alaska Native
Median household income ($) - Multirace
Median household income ($) - Other Race
Median household income for houses/condos with a mortgage ($)
Median household income for apartments without a mortgage ($)
Races - White alone (%)
Races - White alone (% change since 2000)
Races - Black alone (%)
Races - Black alone (% change since 2000)
Races - American Indian alone (%)
Races - American Indian alone (% change since 2000)
Races - Asian alone (%)
Races - Asian alone (% change since 2000)
Races - Hispanic (%)
Races - Hispanic (% change since 2000)
Races - Native Hawaiian and Other Pacific Islander alone (%)
Races - Native Hawaiian and Other Pacific Islander alone (% change since 2000)
Races - Two or more races (%)
Races - Two or more races (% change since 2000)
Races - Other race alone (%)
Races - Other race alone (% change since 2000)
Racial diversity
Unemployment (%)
Unemployment (% change since 2000)
Unemployment (%) - White
Unemployment (%) - Black or African American
Unemployment (%) - Asian
Unemployment (%) - Hispanic or Latino
Unemployment (%) - American Indian and Alaska Native
Unemployment (%) - Multirace
Unemployment (%) - Other Race
Population density (people per square mile)
Population - Males (%)
Population - Females (%)
Population - Males (%) - White
Population - Males (%) - Black or African American
Population - Males (%) - Asian
Population - Males (%) - Hispanic or Latino
Population - Males (%) - American Indian and Alaska Native
Population - Males (%) - Multirace
Population - Males (%) - Other Race
Population - Females (%) - White
Population - Females (%) - Black or African American
Population - Females (%) - Asian
Population - Females (%) - Hispanic or Latino
Population - Females (%) - American Indian and Alaska Native
Population - Females (%) - Multirace
Population - Females (%) - Other Race
Coronavirus confirmed cases (Apr 27, 2024)
Deaths caused by coronavirus (Apr 27, 2024)
Coronavirus confirmed cases (per 100k population) (Apr 27, 2024)
Deaths caused by coronavirus (per 100k population) (Apr 27, 2024)
Daily increase in number of cases (Apr 27, 2024)
Weekly increase in number of cases (Apr 27, 2024)
Cases doubled (in days) (Apr 27, 2024)
Hospitalized patients (Apr 18, 2022)
Negative test results (Apr 18, 2022)
Total test results (Apr 18, 2022)
COVID Vaccine doses distributed (per 100k population) (Sep 19, 2023)
COVID Vaccine doses administered (per 100k population) (Sep 19, 2023)
COVID Vaccine doses distributed (Sep 19, 2023)
COVID Vaccine doses administered (Sep 19, 2023)
Likely homosexual households (%)
Likely homosexual households (% change since 2000)
Likely homosexual households - Lesbian couples (%)
Likely homosexual households - Lesbian couples (% change since 2000)
Likely homosexual households - Gay men (%)
Likely homosexual households - Gay men (% change since 2000)
Cost of living index
Median gross rent ($)
Median contract rent ($)
Median monthly housing costs ($)
Median house or condo value ($)
Median house or condo value ($ change since 2000)
Mean house or condo value by units in structure - 1, detached ($)
Mean house or condo value by units in structure - 1, attached ($)
Mean house or condo value by units in structure - 2 ($)
Mean house or condo value by units in structure by units in structure - 3 or 4 ($)
Mean house or condo value by units in structure - 5 or more ($)
Mean house or condo value by units in structure - Boat, RV, van, etc. ($)
Mean house or condo value by units in structure - Mobile home ($)
Median house or condo value ($) - White
Median house or condo value ($) - Black or African American
Median house or condo value ($) - Asian
Median house or condo value ($) - Hispanic or Latino
Median house or condo value ($) - American Indian and Alaska Native
Median house or condo value ($) - Multirace
Median house or condo value ($) - Other Race
Median resident age
Resident age diversity
Median resident age - Males
Median resident age - Females
Median resident age - White
Median resident age - Black or African American
Median resident age - Asian
Median resident age - Hispanic or Latino
Median resident age - American Indian and Alaska Native
Median resident age - Multirace
Median resident age - Other Race
Median resident age - Males - White
Median resident age - Males - Black or African American
Median resident age - Males - Asian
Median resident age - Males - Hispanic or Latino
Median resident age - Males - American Indian and Alaska Native
Median resident age - Males - Multirace
Median resident age - Males - Other Race
Median resident age - Females - White
Median resident age - Females - Black or African American
Median resident age - Females - Asian
Median resident age - Females - Hispanic or Latino
Median resident age - Females - American Indian and Alaska Native
Median resident age - Females - Multirace
Median resident age - Females - Other Race
Commute - mean travel time to work (minutes)
Travel time to work - Less than 5 minutes (%)
Travel time to work - Less than 5 minutes (% change since 2000)
Travel time to work - 5 to 9 minutes (%)
Travel time to work - 5 to 9 minutes (% change since 2000)
Travel time to work - 10 to 19 minutes (%)
Travel time to work - 10 to 19 minutes (% change since 2000)
Travel time to work - 20 to 29 minutes (%)
Travel time to work - 20 to 29 minutes (% change since 2000)
Travel time to work - 30 to 39 minutes (%)
Travel time to work - 30 to 39 minutes (% change since 2000)
Travel time to work - 40 to 59 minutes (%)
Travel time to work - 40 to 59 minutes (% change since 2000)
Travel time to work - 60 to 89 minutes (%)
Travel time to work - 60 to 89 minutes (% change since 2000)
Travel time to work - 90 or more minutes (%)
Travel time to work - 90 or more minutes (% change since 2000)
Marital status - Never married (%)
Marital status - Now married (%)
Marital status - Separated (%)
Marital status - Widowed (%)
Marital status - Divorced (%)
Median family income ($)
Median family income (% change since 2000)
Median non-family income ($)
Median non-family income (% change since 2000)
Median per capita income ($)
Median per capita income (% change since 2000)
Median family income ($) - White
Median family income ($) - Black or African American
Median family income ($) - Asian
Median family income ($) - Hispanic or Latino
Median family income ($) - American Indian and Alaska Native
Median family income ($) - Multirace
Median family income ($) - Other Race
Median year house/condo built
Median year apartment built
Year house built - Built 2005 or later (%)
Year house built - Built 2000 to 2004 (%)
Year house built - Built 1990 to 1999 (%)
Year house built - Built 1980 to 1989 (%)
Year house built - Built 1970 to 1979 (%)
Year house built - Built 1960 to 1969 (%)
Year house built - Built 1950 to 1959 (%)
Year house built - Built 1940 to 1949 (%)
Year house built - Built 1939 or earlier (%)
Average household size
Household density (households per square mile)
Average household size - White
Average household size - Black or African American
Average household size - Asian
Average household size - Hispanic or Latino
Average household size - American Indian and Alaska Native
Average household size - Multirace
Average household size - Other Race
Occupied housing units (%)
Vacant housing units (%)
Owner occupied housing units (%)
Renter occupied housing units (%)
Vacancy status - For rent (%)
Vacancy status - For sale only (%)
Vacancy status - Rented or sold, not occupied (%)
Vacancy status - For seasonal, recreational, or occasional use (%)
Vacancy status - For migrant workers (%)
Vacancy status - Other vacant (%)
Residents with income below the poverty level (%)
Residents with income below 50% of the poverty level (%)
Children below poverty level (%)
Poor families by family type - Married-couple family (%)
Poor families by family type - Male, no wife present (%)
Poor families by family type - Female, no husband present (%)
Poverty status for native-born residents (%)
Poverty status for foreign-born residents (%)
Poverty among high school graduates not in families (%)
Poverty among people who did not graduate high school not in families (%)
Residents with income below the poverty level (%) - White
Residents with income below the poverty level (%) - Black or African American
Residents with income below the poverty level (%) - Asian
Residents with income below the poverty level (%) - Hispanic or Latino
Residents with income below the poverty level (%) - American Indian and Alaska Native
Residents with income below the poverty level (%) - Multirace
Residents with income below the poverty level (%) - Other Race
Air pollution - Air Quality Index (AQI)
Air pollution - CO
Air pollution - NO2
Air pollution - SO2
Air pollution - Ozone
Air pollution - PM10
Air pollution - PM25
Air pollution - Pb
Crime - Murders per 100,000 population
Crime - Rapes per 100,000 population
Crime - Robberies per 100,000 population
Crime - Assaults per 100,000 population
Crime - Burglaries per 100,000 population
Crime - Thefts per 100,000 population
Crime - Auto thefts per 100,000 population
Crime - Arson per 100,000 population
Crime - City-data.com crime index
Crime - Violent crime index
Crime - Property crime index
Crime - Murders per 100,000 population (5 year average)
Crime - Rapes per 100,000 population (5 year average)
Crime - Robberies per 100,000 population (5 year average)
Crime - Assaults per 100,000 population (5 year average)
Crime - Burglaries per 100,000 population (5 year average)
Crime - Thefts per 100,000 population (5 year average)
Crime - Auto thefts per 100,000 population (5 year average)
Crime - Arson per 100,000 population (5 year average)
Crime - City-data.com crime index (5 year average)
Crime - Violent crime index (5 year average)
Crime - Property crime index (5 year average)
1996 Presidential Elections Results (%) - Democratic Party (Clinton)
1996 Presidential Elections Results (%) - Republican Party (Dole)
1996 Presidential Elections Results (%) - Other
2000 Presidential Elections Results (%) - Democratic Party (Gore)
2000 Presidential Elections Results (%) - Republican Party (Bush)
2000 Presidential Elections Results (%) - Other
2004 Presidential Elections Results (%) - Democratic Party (Kerry)
2004 Presidential Elections Results (%) - Republican Party (Bush)
2004 Presidential Elections Results (%) - Other
2008 Presidential Elections Results (%) - Democratic Party (Obama)
2008 Presidential Elections Results (%) - Republican Party (McCain)
2008 Presidential Elections Results (%) - Other
2012 Presidential Elections Results (%) - Democratic Party (Obama)
2012 Presidential Elections Results (%) - Republican Party (Romney)
2012 Presidential Elections Results (%) - Other
2016 Presidential Elections Results (%) - Democratic Party (Clinton)
2016 Presidential Elections Results (%) - Republican Party (Trump)
2016 Presidential Elections Results (%) - Other
2020 Presidential Elections Results (%) - Democratic Party (Biden)
2020 Presidential Elections Results (%) - Republican Party (Trump)
2020 Presidential Elections Results (%) - Other
Ancestries Reported - Arab (%)
Ancestries Reported - Czech (%)
Ancestries Reported - Danish (%)
Ancestries Reported - Dutch (%)
Ancestries Reported - English (%)
Ancestries Reported - French (%)
Ancestries Reported - French Canadian (%)
Ancestries Reported - German (%)
Ancestries Reported - Greek (%)
Ancestries Reported - Hungarian (%)
Ancestries Reported - Irish (%)
Ancestries Reported - Italian (%)
Ancestries Reported - Lithuanian (%)
Ancestries Reported - Norwegian (%)
Ancestries Reported - Polish (%)
Ancestries Reported - Portuguese (%)
Ancestries Reported - Russian (%)
Ancestries Reported - Scotch-Irish (%)
Ancestries Reported - Scottish (%)
Ancestries Reported - Slovak (%)
Ancestries Reported - Subsaharan African (%)
Ancestries Reported - Swedish (%)
Ancestries Reported - Swiss (%)
Ancestries Reported - Ukrainian (%)
Ancestries Reported - United States (%)
Ancestries Reported - Welsh (%)
Ancestries Reported - West Indian (%)
Ancestries Reported - Other (%)
Educational Attainment - No schooling completed (%)
Educational Attainment - Less than high school (%)
Educational Attainment - High school or equivalent (%)
Educational Attainment - Less than 1 year of college (%)
Educational Attainment - 1 or more years of college (%)
Educational Attainment - Associate degree (%)
Educational Attainment - Bachelor's degree (%)
Educational Attainment - Master's degree (%)
Educational Attainment - Professional school degree (%)
Educational Attainment - Doctorate degree (%)
School Enrollment - Nursery, preschool (%)
School Enrollment - Kindergarten (%)
School Enrollment - Grade 1 to 4 (%)
School Enrollment - Grade 5 to 8 (%)
School Enrollment - Grade 9 to 12 (%)
School Enrollment - College undergrad (%)
School Enrollment - Graduate or professional (%)
School Enrollment - Not enrolled in school (%)
School enrollment - Public schools (%)
School enrollment - Private schools (%)
School enrollment - Not enrolled (%)
Median number of rooms in houses and condos
Median number of rooms in apartments
Housing units lacking complete plumbing facilities (%)
Housing units lacking complete kitchen facilities (%)
Density of houses
Urban houses (%)
Rural houses (%)
Households with people 60 years and over (%)
Households with people 65 years and over (%)
Households with people 75 years and over (%)
Households with one or more nonrelatives (%)
Households with no nonrelatives (%)
Population in households (%)
Family households (%)
Nonfamily households (%)
Population in families (%)
Family households with own children (%)
Median number of bedrooms in owner occupied houses
Mean number of bedrooms in owner occupied houses
Median number of bedrooms in renter occupied houses
Mean number of bedrooms in renter occupied houses
Median number of vehichles in owner occupied houses
Mean number of vehichles in owner occupied houses
Median number of vehichles in renter occupied houses
Mean number of vehichles in renter occupied houses
Mortgage status - with mortgage (%)
Mortgage status - with second mortgage (%)
Mortgage status - with home equity loan (%)
Mortgage status - with both second mortgage and home equity loan (%)
Mortgage status - without a mortgage (%)
Average family size
Average family size - White
Average family size - Black or African American
Average family size - Asian
Average family size - Hispanic or Latino
Average family size - American Indian and Alaska Native
Average family size - Multirace
Average family size - Other Race
Geographical mobility - Same house 1 year ago (%)
Geographical mobility - Moved within same county (%)
Geographical mobility - Moved from different county within same state (%)
Geographical mobility - Moved from different state (%)
Geographical mobility - Moved from abroad (%)
Place of birth - Born in state of residence (%)
Place of birth - Born in other state (%)
Place of birth - Native, outside of US (%)
Place of birth - Foreign born (%)
Housing units in structures - 1, detached (%)
Housing units in structures - 1, attached (%)
Housing units in structures - 2 (%)
Housing units in structures - 3 or 4 (%)
Housing units in structures - 5 to 9 (%)
Housing units in structures - 10 to 19 (%)
Housing units in structures - 20 to 49 (%)
Housing units in structures - 50 or more (%)
Housing units in structures - Mobile home (%)
Housing units in structures - Boat, RV, van, etc. (%)
House/condo owner moved in on average (years ago)
Renter moved in on average (years ago)
Year householder moved into unit - Moved in 1999 to March 2000 (%)
Year householder moved into unit - Moved in 1995 to 1998 (%)
Year householder moved into unit - Moved in 1990 to 1994 (%)
Year householder moved into unit - Moved in 1980 to 1989 (%)
Year householder moved into unit - Moved in 1970 to 1979 (%)
Year householder moved into unit - Moved in 1969 or earlier (%)
Means of transportation to work - Drove car alone (%)
Means of transportation to work - Carpooled (%)
Means of transportation to work - Public transportation (%)
Means of transportation to work - Bus or trolley bus (%)
Means of transportation to work - Streetcar or trolley car (%)
Means of transportation to work - Subway or elevated (%)
Means of transportation to work - Railroad (%)
Means of transportation to work - Ferryboat (%)
Means of transportation to work - Taxicab (%)
Means of transportation to work - Motorcycle (%)
Means of transportation to work - Bicycle (%)
Means of transportation to work - Walked (%)
Means of transportation to work - Other means (%)
Working at home (%)
Industry diversity
Most Common Industries - Agriculture, forestry, fishing and hunting, and mining (%)
Most Common Industries - Agriculture, forestry, fishing and hunting (%)
Most Common Industries - Mining, quarrying, and oil and gas extraction (%)
Most Common Industries - Construction (%)
Most Common Industries - Manufacturing (%)
Most Common Industries - Wholesale trade (%)
Most Common Industries - Retail trade (%)
Most Common Industries - Transportation and warehousing, and utilities (%)
Most Common Industries - Transportation and warehousing (%)
Most Common Industries - Utilities (%)
Most Common Industries - Information (%)
Most Common Industries - Finance and insurance, and real estate and rental and leasing (%)
Most Common Industries - Finance and insurance (%)
Most Common Industries - Real estate and rental and leasing (%)
Most Common Industries - Professional, scientific, and management, and administrative and waste management services (%)
Most Common Industries - Professional, scientific, and technical services (%)
Most Common Industries - Management of companies and enterprises (%)
Most Common Industries - Administrative and support and waste management services (%)
Most Common Industries - Educational services, and health care and social assistance (%)
Most Common Industries - Educational services (%)
Most Common Industries - Health care and social assistance (%)
Most Common Industries - Arts, entertainment, and recreation, and accommodation and food services (%)
Most Common Industries - Arts, entertainment, and recreation (%)
Most Common Industries - Accommodation and food services (%)
Most Common Industries - Other services, except public administration (%)
Most Common Industries - Public administration (%)
Occupation diversity
Most Common Occupations - Management, business, science, and arts occupations (%)
Most Common Occupations - Management, business, and financial occupations (%)
Most Common Occupations - Management occupations (%)
Most Common Occupations - Business and financial operations occupations (%)
Most Common Occupations - Computer, engineering, and science occupations (%)
Most Common Occupations - Computer and mathematical occupations (%)
Most Common Occupations - Architecture and engineering occupations (%)
Most Common Occupations - Life, physical, and social science occupations (%)
Most Common Occupations - Education, legal, community service, arts, and media occupations (%)
Most Common Occupations - Community and social service occupations (%)
Most Common Occupations - Legal occupations (%)
Most Common Occupations - Education, training, and library occupations (%)
Most Common Occupations - Arts, design, entertainment, sports, and media occupations (%)
Most Common Occupations - Healthcare practitioners and technical occupations (%)
Most Common Occupations - Health diagnosing and treating practitioners and other technical occupations (%)
Most Common Occupations - Health technologists and technicians (%)
Most Common Occupations - Service occupations (%)
Most Common Occupations - Healthcare support occupations (%)
Most Common Occupations - Protective service occupations (%)
Most Common Occupations - Fire fighting and prevention, and other protective service workers including supervisors (%)
Most Common Occupations - Law enforcement workers including supervisors (%)
Most Common Occupations - Food preparation and serving related occupations (%)
Most Common Occupations - Building and grounds cleaning and maintenance occupations (%)
Most Common Occupations - Personal care and service occupations (%)
Most Common Occupations - Sales and office occupations (%)
Most Common Occupations - Sales and related occupations (%)
Most Common Occupations - Office and administrative support occupations (%)
Most Common Occupations - Natural resources, construction, and maintenance occupations (%)
Most Common Occupations - Farming, fishing, and forestry occupations (%)
Most Common Occupations - Construction and extraction occupations (%)
Most Common Occupations - Installation, maintenance, and repair occupations (%)
Most Common Occupations - Production, transportation, and material moving occupations (%)
Most Common Occupations - Production occupations (%)
Most Common Occupations - Transportation occupations (%)
Most Common Occupations - Material moving occupations (%)
People in Group quarters - Institutionalized population (%)
People in Group quarters - Correctional institutions (%)
People in Group quarters - Federal prisons and detention centers (%)
People in Group quarters - Halfway houses (%)
People in Group quarters - Local jails and other confinement facilities (including police lockups) (%)
People in Group quarters - Military disciplinary barracks (%)
People in Group quarters - State prisons (%)
People in Group quarters - Other types of correctional institutions (%)
People in Group quarters - Nursing homes (%)
People in Group quarters - Hospitals/wards, hospices, and schools for the handicapped (%)
People in Group quarters - Hospitals/wards and hospices for chronically ill (%)
People in Group quarters - Hospices or homes for chronically ill (%)
People in Group quarters - Military hospitals or wards for chronically ill (%)
People in Group quarters - Other hospitals or wards for chronically ill (%)
People in Group quarters - Hospitals or wards for drug/alcohol abuse (%)
People in Group quarters - Mental (Psychiatric) hospitals or wards (%)
People in Group quarters - Schools, hospitals, or wards for the mentally retarded (%)
People in Group quarters - Schools, hospitals, or wards for the physically handicapped (%)
People in Group quarters - Institutions for the deaf (%)
People in Group quarters - Institutions for the blind (%)
People in Group quarters - Orthopedic wards and institutions for the physically handicapped (%)
People in Group quarters - Wards in general hospitals for patients who have no usual home elsewhere (%)
People in Group quarters - Wards in military hospitals for patients who have no usual home elsewhere (%)
People in Group quarters - Juvenile institutions (%)
People in Group quarters - Long-term care (%)
People in Group quarters - Homes for abused, dependent, and neglected children (%)
People in Group quarters - Residential treatment centers for emotionally disturbed children (%)
People in Group quarters - Training schools for juvenile delinquents (%)
People in Group quarters - Short-term care, detention or diagnostic centers for delinquent children (%)
People in Group quarters - Type of juvenile institution unknown (%)
People in Group quarters - Noninstitutionalized population (%)
People in Group quarters - College dormitories (includes college quarters off campus) (%)
People in Group quarters - Military quarters (%)
People in Group quarters - On base (%)
People in Group quarters - Barracks, unaccompanied personnel housing (UPH), (Enlisted/Officer), ;and similar group living quarters for military personnel (%)
People in Group quarters - Transient quarters for temporary residents (%)
People in Group quarters - Military ships (%)
People in Group quarters - Group homes (%)
People in Group quarters - Homes or halfway houses for drug/alcohol abuse (%)
People in Group quarters - Homes for the mentally ill (%)
People in Group quarters - Homes for the mentally retarded (%)
People in Group quarters - Homes for the physically handicapped (%)
People in Group quarters - Other group homes (%)
People in Group quarters - Religious group quarters (%)
People in Group quarters - Dormitories (%)
People in Group quarters - Agriculture workers' dormitories on farms (%)
People in Group quarters - Job Corps and vocational training facilities (%)
People in Group quarters - Other workers' dormitories (%)
People in Group quarters - Crews of maritime vessels (%)
People in Group quarters - Other nonhousehold living situations (%)
People in Group quarters - Other noninstitutional group quarters (%)
Residents speaking English at home (%)
Residents speaking English at home - Born in the United States (%)
Residents speaking English at home - Native, born elsewhere (%)
Residents speaking English at home - Foreign born (%)
Residents speaking Spanish at home (%)
Residents speaking Spanish at home - Born in the United States (%)
Residents speaking Spanish at home - Native, born elsewhere (%)
Residents speaking Spanish at home - Foreign born (%)
Residents speaking other language at home (%)
Residents speaking other language at home - Born in the United States (%)
Residents speaking other language at home - Native, born elsewhere (%)
Residents speaking other language at home - Foreign born (%)
Class of Workers - Employee of private company (%)
Class of Workers - Self-employed in own incorporated business (%)
Class of Workers - Private not-for-profit wage and salary workers (%)
Class of Workers - Local government workers (%)
Class of Workers - State government workers (%)
Class of Workers - Federal government workers (%)
Class of Workers - Self-employed workers in own not incorporated business and Unpaid family workers (%)
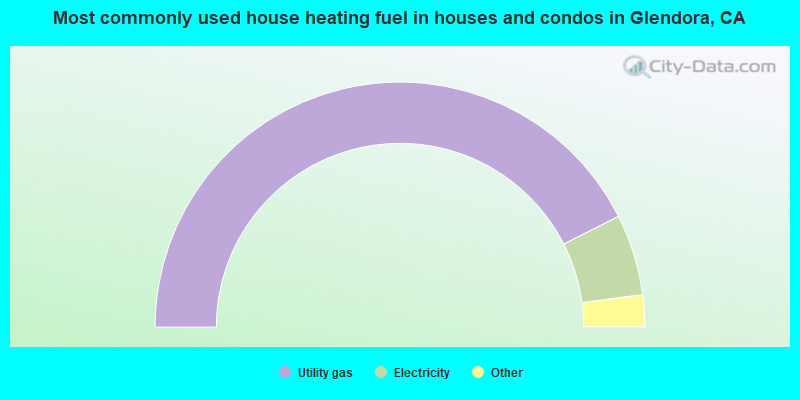
House heating fuel used in houses and condos - Utility gas (%)
House heating fuel used in houses and condos - Bottled, tank, or LP gas (%)
House heating fuel used in houses and condos - Electricity (%)
House heating fuel used in houses and condos - Fuel oil, kerosene, etc. (%)
House heating fuel used in houses and condos - Coal or coke (%)
House heating fuel used in houses and condos - Wood (%)
House heating fuel used in houses and condos - Solar energy (%)
House heating fuel used in houses and condos - Other fuel (%)
House heating fuel used in houses and condos - No fuel used (%)
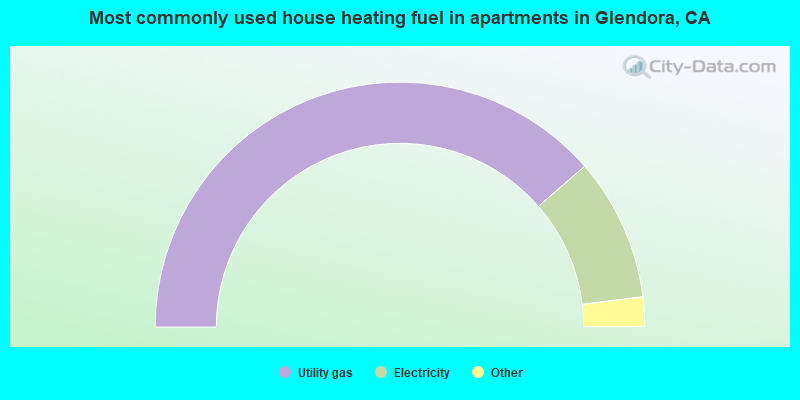
House heating fuel used in apartments - Utility gas (%)
House heating fuel used in apartments - Bottled, tank, or LP gas (%)
House heating fuel used in apartments - Electricity (%)
House heating fuel used in apartments - Fuel oil, kerosene, etc. (%)
House heating fuel used in apartments - Coal or coke (%)
House heating fuel used in apartments - Wood (%)
House heating fuel used in apartments - Solar energy (%)
House heating fuel used in apartments - Other fuel (%)
House heating fuel used in apartments - No fuel used (%)
Armed forces status - In Armed Forces (%)
Armed forces status - Civilian (%)
Armed forces status - Civilian - Veteran (%)
Armed forces status - Civilian - Nonveteran (%)
Fatal accidents locations in years 2005-2021
Fatal accidents locations in 2005
Fatal accidents locations in 2006
Fatal accidents locations in 2007
Fatal accidents locations in 2008
Fatal accidents locations in 2009
Fatal accidents locations in 2010
Fatal accidents locations in 2011
Fatal accidents locations in 2012
Fatal accidents locations in 2013
Fatal accidents locations in 2014
Fatal accidents locations in 2015
Fatal accidents locations in 2016
Fatal accidents locations in 2017
Fatal accidents locations in 2018
Fatal accidents locations in 2019
Fatal accidents locations in 2020
Fatal accidents locations in 2021
Alcohol use - People drinking some alcohol every month (%)
Alcohol use - People not drinking at all (%)
Alcohol use - Average days/month drinking alcohol
Alcohol use - Average drinks/week
Alcohol use - Average days/year people drink much
Audiometry - Average condition of hearing (%)
Audiometry - People that can hear a whisper from across a quiet room (%)
Audiometry - People that can hear normal voice from across a quiet room (%)
Audiometry - Ears ringing, roaring, buzzing (%)
Audiometry - Had a job exposure to loud noise (%)
Audiometry - Had off-work exposure to loud noise (%)
Blood Pressure & Cholesterol - Has high blood pressure (%)
Blood Pressure & Cholesterol - Checking blood pressure at home (%)
Blood Pressure & Cholesterol - Frequently checking blood cholesterol (%)
Blood Pressure & Cholesterol - Has high cholesterol level (%)
Consumer Behavior - Money monthly spent on food at supermarket/grocery store
Consumer Behavior - Money monthly spent on food at other stores
Consumer Behavior - Money monthly spent on eating out
Consumer Behavior - Money monthly spent on carryout/delivered foods
Consumer Behavior - Income spent on food at supermarket/grocery store (%)
Consumer Behavior - Income spent on food at other stores (%)
Consumer Behavior - Income spent on eating out (%)
Consumer Behavior - Income spent on carryout/delivered foods (%)
Current Health Status - General health condition (%)
Current Health Status - Blood donors (%)
Current Health Status - Has blood ever tested for HIV virus (%)
Current Health Status - Left-handed people (%)
Dermatology - People using sunscreen (%)
Diabetes - Diabetics (%)
Diabetes - Had a blood test for high blood sugar (%)
Diabetes - People taking insulin (%)
Diet Behavior & Nutrition - Diet health (%)
Diet Behavior & Nutrition - Milk product consumption (# of products/month)
Diet Behavior & Nutrition - Meals not home prepared (#/week)
Diet Behavior & Nutrition - Meals from fast food or pizza place (#/week)
Diet Behavior & Nutrition - Ready-to-eat foods (#/month)
Diet Behavior & Nutrition - Frozen meals/pizza (#/month)
Drug Use - People that ever used marijuana or hashish (%)
Drug Use - Ever used hard drugs (%)
Drug Use - Ever used any form of cocaine (%)
Drug Use - Ever used heroin (%)
Drug Use - Ever used methamphetamine (%)
Health Insurance - People covered by health insurance (%)
Kidney Conditions-Urology - Avg. # of times urinating at night
Medical Conditions - People with asthma (%)
Medical Conditions - People with anemia (%)
Medical Conditions - People with psoriasis (%)
Medical Conditions - People with overweight (%)
Medical Conditions - Elderly people having difficulties in thinking or remembering (%)
Medical Conditions - People who ever received blood transfusion (%)
Medical Conditions - People having trouble seeing even with glass/contacts (%)
Medical Conditions - People with arthritis (%)
Medical Conditions - People with gout (%)
Medical Conditions - People with congestive heart failure (%)
Medical Conditions - People with coronary heart disease (%)
Medical Conditions - People with angina pectoris (%)
Medical Conditions - People who ever had heart attack (%)
Medical Conditions - People who ever had stroke (%)
Medical Conditions - People with emphysema (%)
Medical Conditions - People with thyroid problem (%)
Medical Conditions - People with chronic bronchitis (%)
Medical Conditions - People with any liver condition (%)
Medical Conditions - People who ever had cancer or malignancy (%)
Mental Health - People who have little interest in doing things (%)
Mental Health - People feeling down, depressed, or hopeless (%)
Mental Health - People who have trouble sleeping or sleeping too much (%)
Mental Health - People feeling tired or having little energy (%)
Mental Health - People with poor appetite or overeating (%)
Mental Health - People feeling bad about themself (%)
Mental Health - People who have trouble concentrating on things (%)
Mental Health - People moving or speaking slowly or too fast (%)
Mental Health - People having thoughts they would be better off dead (%)
Oral Health - Average years since last visit a dentist
Oral Health - People embarrassed because of mouth (%)
Oral Health - People with gum disease (%)
Oral Health - General health of teeth and gums (%)
Oral Health - Average days a week using dental floss/device
Oral Health - Average days a week using mouthwash for dental problem
Oral Health - Average number of teeth
Pesticide Use - Households using pesticides to control insects (%)
Pesticide Use - Households using pesticides to kill weeds (%)
Physical Activity - People doing vigorous-intensity work activities (%)
Physical Activity - People doing moderate-intensity work activities (%)
Physical Activity - People walking or bicycling (%)
Physical Activity - People doing vigorous-intensity recreational activities (%)
Physical Activity - People doing moderate-intensity recreational activities (%)
Physical Activity - Average hours a day doing sedentary activities
Physical Activity - Average hours a day watching TV or videos
Physical Activity - Average hours a day using computer
Physical Functioning - People having limitations keeping them from working (%)
Physical Functioning - People limited in amount of work they can do (%)
Physical Functioning - People that need special equipment to walk (%)
Physical Functioning - People experiencing confusion/memory problems (%)
Physical Functioning - People requiring special healthcare equipment (%)
Prescription Medications - Average number of prescription medicines taking
Preventive Aspirin Use - Adults 40+ taking low-dose aspirin (%)
Reproductive Health - Vaginal deliveries (%)
Reproductive Health - Cesarean deliveries (%)
Reproductive Health - Deliveries resulted in a live birth (%)
Reproductive Health - Pregnancies resulted in a delivery (%)
Reproductive Health - Women breastfeeding newborns (%)
Reproductive Health - Women that had a hysterectomy (%)
Reproductive Health - Women that had both ovaries removed (%)
Reproductive Health - Women that have ever taken birth control pills (%)
Reproductive Health - Women taking birth control pills (%)
Reproductive Health - Women that have ever used Depo-Provera or injectables (%)
Reproductive Health - Women that have ever used female hormones (%)
Sexual Behavior - People 18+ that ever had sex (vaginal, anal, or oral) (%)
Sexual Behavior - Males 18+ that ever had vaginal sex with a woman (%)
Sexual Behavior - Males 18+ that ever performed oral sex on a woman (%)
Sexual Behavior - Males 18+ that ever had anal sex with a woman (%)
Sexual Behavior - Males 18+ that ever had any sex with a man (%)
Sexual Behavior - Females 18+ that ever had vaginal sex with a man (%)
Sexual Behavior - Females 18+ that ever performed oral sex on a man (%)
Sexual Behavior - Females 18+ that ever had anal sex with a man (%)
Sexual Behavior - Females 18+ that ever had any kind of sex with a woman (%)
Sexual Behavior - Average age people first had sex
Sexual Behavior - Average number of female sex partners in lifetime (males 18+)
Sexual Behavior - Average number of female vaginal sex partners in lifetime (males 18+)
Sexual Behavior - Average age people first performed oral sex on a woman (18+)
Sexual Behavior - Average number of woman performed oral sex on in lifetime (18+)
Sexual Behavior - Average number of male sex partners in lifetime (males 18+)
Sexual Behavior - Average number of male anal sex partners in lifetime (males 18+)
Sexual Behavior - Average age people first performed oral sex on a man (18+)
Sexual Behavior - Average number of male oral sex partners in lifetime (18+)
Sexual Behavior - People using protection when performing oral sex (%)
Sexual Behavior - Average number of times people have vaginal or anal sex a year
Sexual Behavior - People having sex without condom (%)
Sexual Behavior - Average number of male sex partners in lifetime (females 18+)
Sexual Behavior - Average number of male vaginal sex partners in lifetime (females 18+)
Sexual Behavior - Average number of female sex partners in lifetime (females 18+)
Sexual Behavior - Circumcised males 18+ (%)
Sleep Disorders - Average hours sleeping at night
Sleep Disorders - People that has trouble sleeping (%)
Smoking-Cigarette Use - People smoking cigarettes (%)
Taste & Smell - People 40+ having problems with smell (%)
Taste & Smell - People 40+ having problems with taste (%)
Taste & Smell - People 40+ that ever had wisdom teeth removed (%)
Taste & Smell - People 40+ that ever had tonsils teeth removed (%)
Taste & Smell - People 40+ that ever had a loss of consciousness because of a head injury (%)
Taste & Smell - People 40+ that ever had a broken nose or other serious injury to face or skull (%)
Taste & Smell - People 40+ that ever had two or more sinus infections (%)
Weight - Average height (inches)
Weight - Average weight (pounds)
Weight - Average BMI
Weight - People that are obese (%)
Weight - People that ever were obese (%)
Weight - People trying to lose weight (%)
20,799 40.8% White alone 20,556 40.3% Hispanic 5,636 11.1% Asian alone 2,059 4.0% Two or more races 1,177 2.3% Black alone 446 0.9% Other race alone 92 0.2% American Indian alone 51 0.1% Native Hawaiian and Other
According to our research of California and other state lists, there were 45 registered sex offenders living in Glendora, California as of April 27, 2024 . The ratio of all residents to sex offenders in Glendora is 1,149 to 1.The ratio of registered sex offenders to all residents in this city is lower than the state average.
The City-Data.com crime index weighs serious crimes and violent crimes more heavily. Higher means more crime, U.S. average is 246.1. It adjusts for the number of visitors and daily workers commuting into cities.
- means the value is smaller than the state average.
- means the value is about the same as the state average.
- means the value is bigger than the state average.
- means the value is much bigger than the state average.
Crime rate in Glendora detailed stats: murders, rapes, robberies, assaults, burglaries, thefts, arson Officers per 1,000 residents here:
0.99California average:
2.30
Latest news from Glendora, CA collected exclusively by city-data.com from local newspapers, TV, and radio stations
Ancestries: American (3.8%), English (3.8%), German (3.8%), Italian (2.4%), Irish (2.3%), European (1.8%).
Current Local Time:
Land area: 19.1 square miles.
Population density: 2,655 people per square mile (average).
9,430 residents are foreign born (9.4% Asia , 7.1% Latin America ).
This city:
18.5%California:
26.5%
Median real estate property taxes paid for housing units with mortgages in 2022: $5,813 (0.7%)Median real estate property taxes paid for housing units with no mortgage in 2022: $3,976 (0.5%)
Nearest city with pop. 50,000+: East San Gabriel Valley, CA
Nearest city with pop. 1,000,000+: Los Angeles, CA
Nearest cities:
Latitude: 34.13 N, Longitude: 117.85 W
Daytime population change due to commuting: -3,439 (-6.7%)Workers who live and work in this city: 6,618 (27.6%)
Property values in Glendora, CA
Single-family new house construction building permits:
2022: 78 buildings , average cost: $221,1002021: 53 buildings , average cost: $176,3002020: 28 buildings , average cost: $169,1002019: 41 buildings , average cost: $209,5002018: 50 buildings , average cost: $342,3002017: 101 buildings , average cost: $285,0002016: 218 buildings , average cost: $266,3002015: 90 buildings , average cost: $386,7002014: 4 buildings , average cost: $318,2002013: 2 buildings , average cost: $626,5002012: 2 buildings , average cost: $284,4002011: 3 buildings , average cost: $520,7002010: 1 building , cost: $752,8002009: 5 buildings , average cost: $456,3002008: 56 buildings , average cost: $253,2002007: 15 buildings , average cost: $209,1002006: 10 buildings , average cost: $386,8002005: 30 buildings , average cost: $377,9002004: 20 buildings , average cost: $338,5002003: 39 buildings , average cost: $385,9002002: 56 buildings , average cost: $352,3002001: 15 buildings , average cost: $287,4002000: 34 buildings , average cost: $234,8001999: 50 buildings , average cost: $334,8001998: 6 buildings , average cost: $354,3001997: 11 buildings , average cost: $238,300Unemployment in December 2023:
Population change in the 1990s: +1,339 (+2.8%).
Most common occupations in Glendora, CA (%)
Both Males Females
Other management occupations, except farmers and farm managers (5.1%)
Other sales and related occupations, including supervisors (4.7%)
Other office and administrative support workers, including supervisors (4.5%)
Preschool, kindergarten, elementary, and middle school teachers (3.8%)
Secretaries and administrative assistants (3.7%)
Sales representatives, services, wholesale and manufacturing (2.9%)
Other production occupations, including supervisors (2.9%)
Other management occupations, except farmers and farm managers (6.3%)
Other sales and related occupations, including supervisors (5.8%)
Other production occupations, including supervisors (4.3%)
Electrical equipment mechanics and other installation, maintenance, and repair workers, including supervisors (4.0%)
Sales representatives, services, wholesale and manufacturing (3.9%)
Top executives (3.7%)
Engineers (3.6%)
Secretaries and administrative assistants (7.7%)
Other office and administrative support workers, including supervisors (6.8%)
Preschool, kindergarten, elementary, and middle school teachers (6.4%)
Information and record clerks, except customer service representatives (4.2%)
Registered nurses (3.8%)
Other management occupations, except farmers and farm managers (3.6%)
Bookkeeping, accounting, and auditing clerks (3.5%)
Earthquake activity:
Glendora-area historical earthquake activity is significantly above California state average. It is 7252% greater than the overall U.S. average. On 7/21/1952 at 11:52:14, a magnitude 7.7 (7.7 UK, Class: Major, Intensity: VIII - XII) earthquake occurred 88.7 miles away from the city center, causing $50,000,000 total damage On 6/28/1992 at 11:57:34, a magnitude 7.6 (6.2 MB, 7.6 MS, 7.3 MW, Depth: 0.7 mi) earthquake occurred 75.8 miles away from the city center, causing 3 deaths ( 1 shaking deaths, 2 other deaths) and 400 injuries, causing $100,000,000 total damage and $40,000,000 insured lossesOn 10/16/1999 at 09:46:44, a magnitude 7.4 (6.3 MB, 7.4 MS, 7.2 MW, 7.3 ML) earthquake occurred 85.3 miles away from the city center On 11/4/1927 at 13:51:53, a magnitude 7.5 (7.5 UK) earthquake occurred 189.0 miles away from the city center On 4/21/1918 at 22:32:30, a magnitude 6.8 (6.8 UK, Class: Strong, Intensity: VII - IX) earthquake occurred 32.4 miles away from the city center On 6/28/1992 at 15:05:30, a magnitude 6.9 (6.3 MB, 6.7 MS, 6.5 MW, 6.9 ME, Depth: 3.1 mi) earthquake occurred 60.3 miles away from Glendora center Magnitude types: body-wave magnitude (MB), energy magnitude (ME), local magnitude (ML), surface-wave magnitude (MS), moment magnitude (MW) Natural disasters: The number of natural disasters in Los Angeles County (57) is a lot greater than the US average (15).Major Disasters (Presidential) Declared: 27Emergencies Declared: 3Fires: 37, Floods: 16, Storms: 9, Winter Storms: 6, Landslides: 5, Mudslides: 5, Earthquakes: 3, Freeze: 1, Heavy Rain: 1, Hurricane: 1, Snow: 1, Tornado: 1, Wind: 1, Other: 1 (Note: some incidents may be assigned to more than one category). Main business address for: FOOTHILL INDEPENDENT BANCORP STATE COMMERCIAL BANKS ).
Hospitals in Glendora: COMMUNITY CARE HOSPICE (222 W FOOTHILL BLVD) EAST VALLEY HOSPITAL MEDICAL CENTER (Voluntary non-profit - Private, provides emergency services, 150 WEST ROUTE 66) FOOTHILL PRESBYTERIAN HOSPITAL (Voluntary non-profit - Private, provides emergency services, 250 S GRAND AVE) GRAND AVENUE HOME (412 NORTH GRAND AVENUE) Nursing Homes in Glendora: ARBOR GLEN CARE CENTER (1033 E. ARROW HIGHWAY) EMMANUEL ICF - GLENDORA (1771 S GRAND AVENUE) GLADSTONE CARE AND REHABILITAT (435 E. GLADSTONE AVENUE) GLENDORA GRAND, INC (805 W. ARROW HWY.) KINDRED TRANSITIONAL CARE AND REHAB-FOOTHIL (401 W. ADA AVE.) MESA GLEN CARE CENTER (638 E COLORADO AVENUE) Dialysis Facilities in Glendora: MOHAN DIALYSIS CENTER OF GLENDORA (638 S. GLENDORA AVENUE) RAI-FOOTHILL BLVD.-GLENDORA (120 W. FOOTHILL BLVD.) Home Health Centers in Glendora: ACCU - RITE HEALTH SERVICES, INC (163 W ARROW HIGHWAY) ADVENT HOME HEALTH CARE SERVICES, INC (1128 E ROUTE 66) CARE UNLIMITED HEALTH SERVICES (1025 WEST ARROW HIGHWAY SUITE 105) IDEAL HOME CARE INC (1751 S GRAND AVE) LIFELINK HEALTH PROVIDERS, INC (626 W ROUTE 66, SUITE G) SERENITY HEALTH CARE, INC (1139 S GRAND AVENUE) UNIQUE HEALTHCARE, INC (620 WEST ROUTE 66, STE 207) Heliports located in Glendora: Amtrak stations near Glendora: 8 miles: POMONA (156 W. COMMERCIAL ST.) Services: partially wheelchair accessible, public payphones, free short-term parking, free long-term parking, call for taxi service, public transit connection.
9 miles: CLAREMONT (200 W. 1ST ST.) - Bus Station Services: fully wheelchair accessible, public payphones, full-service food facilities, free short-term parking, free long-term parking, call for car rental service, call for taxi service, public transit connection.
13 miles: ONTARIO (228 S. PLUM ST.) Services: fully wheelchair accessible, public payphones, vending machines, free short-term parking, call for taxi service.
Colleges/Universities in Glendora: Citrus College Full-time enrollment: 8,456; Location: 1000 W Foothill Blvd; Public; Website: www.citruscollege.edu)
Azusa Pacific Online University Full-time enrollment: 366; Location: 511 W Citrus Edge St; Private, not-for-profit; Website: www.apu.edu/apou/)
Other colleges/universities with over 2000 students near Glendora:
Azusa Pacific University (about 2 miles; Azusa, CA ; Full-time enrollment: 9,427)
University of La Verne (about 6 miles; La Verne, CA ; FT enrollment: 6,983)
DeVry University-California (about 6 miles; Pomona, CA ; FT enrollment: 10,875)
California State Polytechnic University-Pomona (about 6 miles; Pomona, CA ; FT enrollment: 18,141)
Mt San Antonio College (about 7 miles; Walnut, CA ; FT enrollment: 19,891)
Hacienda La Puente Adult Education (about 11 miles; La Puente, CA ; FT enrollment: 2,750)
Rio Hondo College (about 13 miles; Whittier, CA ; FT enrollment: 9,610)
Public high schools in Glendora: GLENDORA HIGH Students: 1,742, Location: 1600 E. FOOTHILL BLVD., Grades: 9-12)OAK KNOLL ALTERNATIVE Students: 149, Location: 1505 S. SUNFLOWER AVE, Grades: KG-12)ARROW HIGH (CONTINUATION) Students: 36, Location: 1505 S. SUNFLOWER AVE, Grades: 9-12)WHITCOMB CONTINUATION HIGH Students: 34, Location: 350 W. MAUNA LOA AVE., Grades: 9-12)BRIDGES COMMUNITY DAY Students: 12, Location: 1505 S. SUNFLOWER AVE, Grades: 7-12)SIERRA HIGH Location: 1134 S. BARRANCA, Grades: 9-12)
Private high school in Glendora: ST LUCYS PRIORY HIGH SCHOOL Students: 666, Location: 655 W SIERRA MADRE AVE, Grades: 9-12, Girls only )
Public elementary/middle schools in Glendora: GODDARD MIDDLE Students: 847, Location: 859 E. SIERRA MADRE AVE., Grades: 6-8)SANDBURG MIDDLE Students: 759, Location: 819 W. BENNETT AVE., Grades: 6-8)CULLEN ELEMENTARY Students: 395, Location: 440 N. LIVE OAK AVE., Grades: KG-5)LA FETRA ELEMENTARY Students: 383, Location: 547 W. BENNETT AVE., Grades: KG-5)SUTHERLAND ELEMENTARY Students: 327, Location: 1330 N. AMELIA AVE., Grades: KG-5)SELLERS ELEMENTARY Students: 325, Location: 500 N. LORAINE AVE., Grades: KG-5)WASHINGTON ELEMENTARY Students: 315, Location: 325 W. GLADSTONE, Grades: KG-6)STANTON ELEMENTARY Students: 256, Location: 725 S. VECINO AVE., Grades: KG-5)WILLOW ELEMENTARY Location: 1427 S. WILLOW, Grades: KG-6)
Private elementary/middle schools in Glendora: FOOTHILL CHRISTIAN SCHOOL Students: 793, Location: 242 W BASELINE RD, Grades: PK-8)
ST DOROTHY ELEMENTARY SCHOOL Students: 245, Location: 215 S VALLEY CENTER AVE, Grades: KG-8)
HOPE LUTHERAN ELEMENTARY SCHOOL Students: 171, Location: 1041 E FOOTHILL BLVD, Grades: PK-8)
See full list of schools located in Glendora Library in Glendora: GLENDORA LIBRARY & CULTURAL CENTER Operating income: $2,375,391; Location: 140 SOUTH GLENDORA AVE.; 121,108 books ; 7,175 e-books ; 9,499 audio materials ; 8,163 video materials ; 23 other licensed databases ; 249 print serial subscriptions )
Notable locations in Glendora: (A) , Dalton Forest Service Facility (B) , Bluebird Estates (C) , Dalton Station (D) , Camp Aventura (E) , Glen Oaks Golf Course (F) , Glendora Country Club (G) , Glendora Public Library (H) , Glendora City Hall (I) , West Gymnasium (J) , Hayden Library (K) , Hayden Hall (L) , Haugh Performing Arts Center (M) , Handy Campus Center (N) , Los Angeles County Fire Department Station 151 (O) , Los Angeles County Fire Department Station 86 (P) , Los Angeles County Fire Department Station 85 (Q) . Display/hide their locations on the map
Shopping Centers: (1) , Lone Hill Shopping Center (2) , Glendora Shopping Center (3) , Arrow Plaza Shopping Center (4) . Display/hide their locations on the map
Main business address in Glendora: (A) . Display/hide its location on the map
Churches in Glendora include: (A) , Cornerstone Bible Church (B) , First Christian Church (C) , Glendora Alliance Church (D) , Grace Episcopal Church (E) , Hope Lutheran Church (F) , Loraine Avenue Baptist Church (G) , Saint Dorothy's Church (H) , United Methodist Church of Glendora (I) . Display/hide their locations on the map
Cemetery: (1) . Display/hide its location on the map
Reservoir: (A) . Display/hide its location on the map
Streams, rivers, and creeks: (A) . Display/hide its location on the map
Parks in Glendora include: (1) , Glen Dora Sports Park (2) , South Hills Park (3) , Finkbiner Park (4) , George Manooshian Park (5) , Ole Hammer Park (6) , Willow Springs Park (7) , Dawson Park (8) . Display/hide their locations on the map
Hotel:
Birthplace of: Casey Jacobsen - Basketball player, Dennis Weathersby - 2005 NFL player (Cincinnati Bengals, born : Jun 16, 1980), J.J. Davis - 2005 Major League Baseball player (Colorado Rockies, born : Oct 25, 1978), Shawn Wooten - 2005 Major League Baseball player (Boston Red Sox, born : Jul 24, 1972), Soleil Moon Frye - Actress, Blaine Thomas - Baseball player, Bob Joles - Actor, Greggy Soriano - Chef, James Powell - College basketball player (UC Santa Barbara Gauchos), Jonathon Amaya - Football player.
Los Angeles County has a predicted average indoor radon screening level between 2 and 4 pCi/L (pico curies per liter) - Moderate Potential Average household size: This city:
2.9 peopleCalifornia:
2.9 people
Percentage of family households: This city:
75.9%Whole state:
68.7%
Percentage of households with unmarried partners: This city:
5.0%Whole state:
7.2%
Likely homosexual households (counted as self-reported same-sex unmarried-partner households)
Lesbian couples: 0.4% of all households Gay men: 0.3% of all households
People in group quarters in Glendora in 2010:
519 people in nursing facilities/skilled-nursing facilities
91 people in residential treatment centers for adults
79 people in group homes intended for adults
37 people in hospitals with patients who have no usual home elsewhere
20 people in workers' group living quarters and job corps centers
15 people in mental (psychiatric) hospitals and psychiatric units in other hospitals
2 people in residential schools for people with disabilities
2 people in other noninstitutional facilities
People in group quarters in Glendora in 2000:
671 people in nursing homes
103 people in mental (psychiatric) hospitals or wards
87 people in homes for the mentally retarded
71 people in other noninstitutional group quarters
25 people in college dormitories (includes college quarters off campus)
13 people in homes for the mentally ill
12 people in homes for abused, dependent, and neglected children
12 people in other nonhousehold living situations
6 people in other group homes
4 people in homes for the physically handicapped
3 people in religious group quarters
Banks with branches in Glendora (2011 data):
Bank of America, National Association: Charter Oak Branch at 843 East Arrow Highway, branch established on 1904/10/17; Glendora Branch at 115 West Foothill Boulevard, branch established on 1937/07/12. Info updated 2009/11/18: Bank assets: $1,451,969.3 mil, Deposits: $1,077,176.8 mil, headquarters in Charlotte, NC, positive income , 5782 total offices , Holding Company: Bank Of America Corporation
JPMorgan Chase Bank, National Association: East Alosta Ave Branch at 1905 East Route 66, branch established on 1957/07/08; South Grand Avenue Branch at 655 South Grand Avenue, branch established on 1998/05/18. Info updated 2011/11/10: Bank assets: $1,811,678.0 mil, Deposits: $1,190,738.0 mil, headquarters in Columbus, OH, positive income , International Specialization, 5577 total offices , Holding Company: Jpmorgan Chase & Co.
Wells Fargo Bank, National Association: Glendora Branch at 602 West Route 66, branch established on 1965/04/23; Glendora Foothill Branch at 120 North Grand Avenue, branch established on 2009/12/07. Info updated 2011/04/05: Bank assets: $1,161,490.0 mil, Deposits: $905,653.0 mil, headquarters in Sioux Falls, SD, positive income , 6395 total offices , Holding Company: Wells Fargo & Company
Pacific Western Bank: Glendora Branch at 510 South Grande Avenue, branch established on 1973/06/01. Info updated 2011/03/14: Bank assets: $5,513.1 mil, Deposits: $4,614.5 mil, headquarters in Los Angeles, CA, positive income , Commercial Lending Specialization, 78 total offices , Holding Company: Capgen Capital Group Ii Lp
Union Bank, National Association: Glendora Branch at 601 West Route 66, branch established on 2007/12/10. Info updated 2011/09/01: Bank assets: $88,967.5 mil, Deposits: $65,286.4 mil, headquarters in San Francisco, CA, positive income , Commercial Lending Specialization, 403 total offices , Holding Company: Mitsubishi Ufj Financial Group, Inc.
Citibank, National Association: Glendora Branch at 401 East Arrow Highway, branch established on 1936/02/01. Info updated 2012/01/10: Bank assets: $1,288,658.0 mil, Deposits: $882,541.0 mil, headquarters in Sioux Falls, SD, positive income , International Specialization, 1048 total offices , Holding Company: Citigroup Inc.
U.S. Bank National Association: Glendora Branch at 801 S Grand Ave, branch established on 1892/01/01. Info updated 2012/01/30: Bank assets: $330,470.8 mil, Deposits: $236,091.5 mil, headquarters in Cincinnati, OH, positive income , 3121 total offices , Holding Company: U.S. Bancorp
For population 15 years and over in Glendora:
Never married: 33.5%Now married: 51.4%Separated: 1.0%Widowed: 4.9%Divorced: 9.3% For population 25 years and over in Glendora:
High school or higher: 92.8%Bachelor's degree or higher: 37.3%Graduate or professional degree: 14.1%Unemployed: 4.2%Mean travel time to work (commute): 27.0 minutes
Education Gini index (Inequality in education) Here:
11.0California average:
15.5
Religion statistics for Glendora, CA (based on Los Angeles County data)
Religion Adherents Congregations Catholic 3,542,994 275 Evangelical Protestant 814,611 3,249 Other 451,594 1,023 Mainline Protestant 229,056 860 Black Protestant 112,338 290 Orthodox 63,517 76 None 4,604,495 -
Source: Clifford Grammich, Kirk Hadaway, Richard Houseal, Dale E.Jones, Alexei Krindatch, Richie Stanley and Richard H.Taylor. 2012. 2010 U.S.Religion Census: Religious Congregations & Membership Study. Association of Statisticians of American Religious Bodies. Jones, Dale E., et al. 2002. Congregations and Membership in the United States 2000. Nashville, TN: Glenmary Research Center. Graphs represent county-level data
Food Environment Statistics: Number of grocery stores : 2,084Los Angeles County :
2.12 / 10,000 pop.California :
2.14 / 10,000 pop.
Number of supercenters and club stores : 32Here :
0.03 / 10,000 pop.State :
0.04 / 10,000 pop.
Number of convenience stores (no gas) : 567Here :
0.58 / 10,000 pop.California :
0.62 / 10,000 pop.
Number of convenience stores (with gas) : 1,206This county :
1.23 / 10,000 pop.State :
1.49 / 10,000 pop.
Number of full-service restaurants : 7,008Los Angeles County :
7.15 / 10,000 pop.California :
7.42 / 10,000 pop.
Adult obesity rate : Los Angeles County :
20.4%California :
21.3%
Low-income preschool obesity rate : Los Angeles County :
18.6%California :
17.9%
Health and Nutrition: Healthy diet rate : Glendora:
51.5%State:
49.4%
Average overall health of teeth and gums : This city:
50.1%California:
48.0%
Average BMI : Glendora:
28.3California:
28.1
People feeling badly about themselves : This city:
20.3%State:
20.2%
People not drinking alcohol at all : Glendora:
10.4%State:
11.2%
Average hours sleeping at night : Glendora:
6.8California:
6.8
Overweight people : This city:
34.4%California:
31.5%
General health condition : This city:
57.8%State:
56.4%
Average condition of hearing : Glendora:
80.1%State:
80.9%
More about Health and Nutrition of Glendora, CA Residents
Local government employment and payroll (March 2022)
Function
Full-time employees
Monthly full-time payroll
Average yearly full-time wage
Part-time employees
Monthly part-time payroll
Police Protection - Officers
58 $647,212 $133,906 3 $15,618 Police - Other
43 $299,024 $83,449 41 $87,296 Streets and Highways
36 $274,957 $91,652 6 $9,980 Water Supply
27 $199,958 $88,870 0 $0 Parks and Recreation
23 $169,447 $88,407 66 $107,747 Financial Administration
19 $145,779 $92,071 0 $0 Other Government Administration
14 $101,738 $87,204 2 $6,634 Local Libraries
13 $93,766 $86,553 35 $78,857 Housing and Community Development (Local)
12 $118,963 $118,963 1 $4,821 Welfare
2 $15,177 $91,062 7 $9,031 Health
2 $16,834 $101,004 0 $0
Totals for Government
249 $2,082,855 $100,379 161 $319,984
Glendora government finances - Expenditure in 2017 (per resident):
Construction - Housing and Community Development: $2,628,000 ($51.71)
Water Utilities: $1,534,000 ($30.18)Protective Inspection and Regulation - Other: $609,000 ($11.98)Police Protection: $115,000 ($2.26)Current Operations - Police Protection: $15,770,000 ($310.29)
Water Utilities: $10,093,000 ($198.59)Central Staff Services: $4,089,000 ($80.45)Parks and Recreation: $3,648,000 ($71.78)Transit Utilities: $3,555,000 ($69.95)Regular Highways: $3,371,000 ($66.33)Libraries: $2,040,000 ($40.14)Protective Inspection and Regulation - Other: $1,138,000 ($22.39)Housing and Community Development: $693,000 ($13.64)Financial Administration: $613,000 ($12.06)Health - Other: $152,000 ($2.99)General - Other: $92,000 ($1.81)General - Interest on Debt: $533,000 ($10.49)
Other Capital Outlay - Water Utilities: $3,076,000 ($60.52)
Regular Highways: $56,000 ($1.10)Parks and Recreation: $29,000 ($0.57)Central Staff Services: $6,000 ($0.12)Total Salaries and Wages: $366,000 ($7.20)
Water Utilities - Interest on Debt: $796,000 ($15.66)
Glendora government finances - Revenue in 2017 (per resident):
Charges - Other: $3,098,000 ($60.96)
Parks and Recreation: $741,000 ($14.58)Regular Highways: $364,000 ($7.16)Federal Intergovernmental - Housing and Community Development: $335,000 ($6.59)
Other: $305,000 ($6.00)Transit Utilities: $117,000 ($2.30)Local Intergovernmental - Transit Utilities: $1,448,000 ($28.49)
Other: $122,000 ($2.40)Miscellaneous - Rents: $1,680,000 ($33.06)
Fines and Forfeits: $1,499,000 ($29.49)General Revenue - Other: $283,000 ($5.57)Interest Earnings: $193,000 ($3.80)Donations From Private Sources: $52,000 ($1.02)Revenue - Water Utilities: $17,656,000 ($347.39)
Transit Utilities: $70,000 ($1.38)State Intergovernmental - Other: $1,417,000 ($27.88)
Highways: $991,000 ($19.50)Water Utilities: $36,000 ($0.71)General Local Government Support: $35,000 ($0.69)Tax - Property: $10,949,000 ($215.43)
General Sales and Gross Receipts: $10,671,000 ($209.96)Other: $3,306,000 ($65.05)Public Utilities Sales: $2,208,000 ($43.44)Other License: $1,481,000 ($29.14)Occupation and Business License - Other: $392,000 ($7.71)Documentary and Stock Transfer: $289,000 ($5.69)Other Selective Sales: $138,000 ($2.72)
Glendora government finances - Debt in 2017 (per resident):
Long Term Debt - Beginning Outstanding - Unspecified Public Purpose: $37,190,000 ($731.74)
Outstanding Unspecified Public Purpose: $34,332,000 ($675.51)Retired Unspecified Public Purpose: $2,857,000 ($56.21)
Glendora government finances - Cash and Securities in 2017 (per resident):
Bond Funds - Cash and Securities: $9,334,000 ($183.65)
Other Funds - Cash and Securities: $52,026,000 ($1023.65)
2.98% of this county's 2021 resident taxpayers lived in other counties in 2020 ($81,235 average adjusted gross income )
Here:
2.98%California average:
5.19%
0.01% of residents moved from foreign countries ($155 average AGI )Los Angeles County:
0.01%California average:
0.03%
Top counties from which taxpayers relocated into this county between 2020 and 2021:
4.68% of this county's 2020 resident taxpayers moved to other counties in 2021 ($97,324 average adjusted gross income )
Here:
4.68%California average:
6.14%
0.01% of residents moved to foreign countries ($196 average AGI )Los Angeles County:
0.01%California average:
0.02%
Top counties to which taxpayers relocated from this county between 2020 and 2021:
Businesses in Glendora, CA
Name Count Name Count
24 Hour Fitness 1 Home Depot 1 7-Eleven 2 Kohl's 1 Ace Hardware 1 Kroger 1 Albertsons 1 LA Fitness 1 AutoZone 1 Lane Bryant 1 Baja Fresh Mexican Grill 1 McDonald's 2 Bally Total Fitness 1 New Balance 1 Barnes & Noble 1 Nike 3 Baskin-Robbins 1 Old Navy 1 Bath & Body Works 1 PetSmart 1 Bed Bath & Beyond 1 Pizza Hut 1 Best Western 1 RadioShack 1 Big O Tires 1 SAS Shoes 1 Blockbuster 1 Safeway 2 CVS 2 Sam's Club 1 Carl\s Jr. 1 Staples 1 Chevrolet 1 Starbucks 4 Chipotle 1 Subway 4 Cold Stone Creamery 1 Taco Bell 2 Curves 2 The Room Place 1 DHL 1 Toyota 1 Dennys 1 U-Haul 4 Discount Tire 1 UPS 7 Domino's Pizza 1 Vans 1 El Pollo Loco 1 Verizon Wireless 2 FedEx 9 Vons 2 Ford 1 Walmart 1 GameStop 1 Wendy's 1 H&R Block 1
Strongest AM radio stations in Glendora:
KLAC (570 AM; 50 kW; LOS ANGELES, CA; Owner: AMFM RADIO LICENSES, L.L.C.)
KDIS (1110 AM; 50 kW; PASADENA, CA; Owner: ABC,INC.)
KTNQ (1020 AM; 50 kW; LOS ANGELES, CA; Owner: KTNQ-AM LICENSE CORP.)
KXTA (1150 AM; 50 kW; LOS ANGELES, CA; Owner: CITICASTERS LICENSES, L.P.)
KFI (640 AM; 50 kW; LOS ANGELES, CA; Owner: CAPSTAR TX LIMITED PARTNERSHIP)
KPLS (830 AM; 50 kW; ORANGE, CA; Owner: CRN LICENSES, LLC)
KFWB (980 AM; 50 kW; LOS ANGELES, CA; Owner: INFINITY BROADCASTING OPERATIONS, INC.)
KALI (900 AM; 6 kW; WEST COVINA, CA; Owner: MULTICULTURAL RADIO BROADCASTING, INC.)
KMPC (1540 AM; 50 kW; LOS ANGELES, CA; Owner: ROSE CITY RADIO CORPORATION)
KSPN (710 AM; 50 kW; LOS ANGELES, CA; Owner: KABC-AM RADIO, INC.)
KBLA (1580 AM; 50 kW; SANTA MONICA, CA)
KXMX (1190 AM; 25 kW; ANAHEIM, CA; Owner: NEW INSPIRATION BROADCASTING COMPANY)
KRLA (870 AM; 20 kW; GLENDALE, CA; Owner: NEW INSPIRATION BROADCASTING COMPANY)
Strongest FM radio stations in Glendora:
KRCV (98.3 FM; WEST COVINA, CA; Owner: HBC LICENSE CORPORATION)
K264AF (100.7 FM; GUASTI, CA; Owner: EDUCATIONAL MEDIA FOUNDATION)
KCBS-FM (93.1 FM; LOS ANGELES, CA; Owner: INFINITY BROADCASTING OPERATIONS, INC.)
KSCA (101.9 FM; GLENDALE, CA; Owner: HBC LICENSE CORPORATION)
KOST (103.5 FM; LOS ANGELES, CA; Owner: CAPSTAR TX LIMITED PARTNERSHIP)
KLOS (95.5 FM; LOS ANGELES, CA; Owner: KLOS-FM RADIO, INC.)
K212FA (90.3 FM; TEMPLE CITY, CA; Owner: EDUCATIONAL MEDIA FOUNDATION)
KIIS-FM (102.7 FM; LOS ANGELES, CA; Owner: CITICASTERS LICENSES, L.P.)
KLVE (107.5 FM; LOS ANGELES, CA; Owner: KLVE-FM LICENSE CORP.)
KPCC (89.3 FM; PASADENA, CA; Owner: PASADENA AREA COMMUNITY COLLEGE DISTRICT)
KHHT (92.3 FM; LOS ANGELES, CA; Owner: AMFM RADIO LICENSES, L.L.C.)
KBIG-FM (104.3 FM; LOS ANGELES, CA; Owner: AMFM RADIO LICENSES, L.L.C.)
KTWV (94.7 FM; LOS ANGELES, CA; Owner: INFINITY BROADCASTING OPERATIONS, INC.)
KMZT-FM (105.1 FM; LOS ANGELES, CA; Owner: MOUNT WILSON FM BROADCASTERS, INC.)
KPFK (90.7 FM; LOS ANGELES, CA; Owner: PACIFICA FOUNDATION, INC)
K216EM (91.1 FM; ARCADIA, CA; Owner: LIFE ON THE WAY COMMUNICATIONS, INC.)
KZLA-FM (93.9 FM; LOS ANGELES, CA; Owner: EMMIS RADIO LICENSE CORPORATION)
KPWR (105.9 FM; LOS ANGELES, CA; Owner: EMMIS RADIO LICENSE CORPORATION)
KLSX (97.1 FM; LOS ANGELES, CA; Owner: INFINITY BROADCASTING OPERATIONS, INC.)
KUSC (91.5 FM; LOS ANGELES, CA; Owner: UNIVERSITY OF SOUTHERN CALIFORNIA)
TV broadcast stations around Glendora:
KCBS-TV (Channel 2; LOS ANGELES, CA; Owner: CBS BROADCASTING INC.)
KTRO-LP (Channel 50; LANCASTER, CA; Owner: ROBERT D. ADELMAN)
KTLA-TV (Channel 5; LOS ANGELES, CA; Owner: KTLA INC.)
KABC-TV (Channel 7; LOS ANGELES, CA; Owner: ABC HOLDING COMPANY, INC.)
KNBC (Channel 4; LOS ANGELES, CA; Owner: NBC SUBSIDIARY (KNBC-TV), INC.)
KCAL-TV (Channel 9; LOS ANGELES, CA; Owner: VIACOM TELEVISION STATIONS GROUP OF LOS ANGELES LLC)
KHIZ (Channel 64; BARSTOW, CA; Owner: SUNBELT TELEVISION, INC.)
KMEX-TV (Channel 34; LOS ANGELES, CA; Owner: KMEX LICENSE PARTNERSHIP, G.P.)
KAZA-TV (Channel 54; AVALON, CA; Owner: PAPPAS SOUTHERN CALIFORNIA LICENSE LLC)
KDOC-TV (Channel 56; ANAHEIM, CA; Owner: GOLDEN ORANGE BROADCASTING CO., INC.)
KOCE-TV (Channel 50; HUNTINGTON BEACH, CA; Owner: BD. OF TRUSTEES, COAST COMMUNITY COLLEGE DIST.)
KSCI (Channel 18; LONG BEACH, CA; Owner: KSLS, INC.)
KCET (Channel 28; LOS ANGELES, CA; Owner: COMMUNITY TELEVISION OF SOUTHERN CALIFORNIA)
KXLA (Channel 44; RANCHO PALOS VERDES, CA; Owner: RANCHO PALOS VERDES BROADCASTERS, INC.)
KFTR (Channel 46; ONTARIO, CA; Owner: TELEFUTURA LOS ANGELES LLC)
KRCA (Channel 62; RIVERSIDE, CA; Owner: KRCA LICENSE CORP.)
KTTV (Channel 11; LOS ANGELES, CA; Owner: FOX TELEVISION STATIONS, INC.)
KPXN (Channel 30; SAN BERNARDINO, CA; Owner: PAXSON LOS ANGELES LICENSE, INC.)
KWHY-TV (Channel 22; LOS ANGELES, CA; Owner: TELEMUNDO OF LOS ANGELES LICENSE CORPORATION)
KVEA (Channel 52; CORONA, CA; Owner: ESTRELLA LICENSE CORPORATION)
KCOP-TV (Channel 13; LOS ANGELES, CA; Owner: FOX TELEVISION STATIONS, INC.)
KTBN-TV (Channel 40; SANTA ANA, CA; Owner: TRINITY BROADCASTING NETWORK, INC.)
KLCS (Channel 58; LOS ANGELES, CA; Owner: LOS ANGELES UNIFIED SCHOOL DISTRICT)
KSFV-LP (Channel 26; SAN FERNANDO VALLEY, CA; Owner: VENTURE TECHNOLOGIES GROUP, LLC)
KHTV-LP (Channel 48; INLAND EMPIRE, CA; Owner: VENTURE TECHNOLOGIES GROUP, LLC)
National Bridge Inventory (NBI) Statistics 59 Number of bridges417ft / 127m Total length $256,000 Total costs3,294,182 Total average daily traffic127,010 Total average daily truck traffic
New bridges - historical statistics
1 1920-1929 3 1930-1939 6 1950-1959 20 1960-1969 27 1970-1979 1 1990-1999 1 2010-2019
See full National Bridge Inventory statistics for Glendora, CA
Home Mortgage Disclosure Act Aggregated Statistics For Year 2009(Based on 10 full and 5 partial tracts) A) FHA, FSA/RHS & VA B) Conventional C) Refinancings D) Home Improvement Loans F) Non-occupant Loans on G) Loans On Manufactured Number Average Value Number Average Value Number Average Value Number Average Value Number Average Value Number Average Value
LOANS ORIGINATED 128 $356,695 243 $339,459 1,190 $310,983 69 $234,718 58 $243,995 6 $65,973 APPLICATIONS APPROVED, NOT ACCEPTED 9 $386,447 29 $298,965 109 $339,347 12 $89,244 14 $268,734 4 $52,605 APPLICATIONS DENIED 22 $369,145 41 $221,363 352 $350,191 25 $211,855 36 $273,995 11 $88,000 APPLICATIONS WITHDRAWN 18 $371,321 32 $360,511 216 $319,188 17 $217,706 14 $269,566 1 $127,000 FILES CLOSED FOR INCOMPLETENESS 5 $314,918 15 $304,995 55 $326,008 4 $330,622 3 $149,210 1 $45,000
Aggregated Statistics For Year 2008(Based on 10 full and 5 partial tracts) A) FHA, FSA/RHS & VA B) Conventional C) Refinancings D) Home Improvement Loans E) Loans on Dwellings For 5+ Families F) Non-occupant Loans on G) Loans On Manufactured Number Average Value Number Average Value Number Average Value Number Average Value Number Average Value Number Average Value Number Average Value
LOANS ORIGINATED 52 $400,130 258 $365,971 618 $319,935 89 $156,575 3 $3,916,667 59 $267,996 8 $81,752 APPLICATIONS APPROVED, NOT ACCEPTED 2 $341,310 65 $369,256 168 $353,517 20 $71,208 0 $0 12 $240,937 11 $63,903 APPLICATIONS DENIED 11 $452,761 71 $495,319 384 $362,651 56 $88,445 0 $0 15 $233,391 17 $67,145 APPLICATIONS WITHDRAWN 13 $365,135 52 $403,665 190 $357,015 22 $199,459 1 $1,591,710 9 $269,711 1 $233,000 FILES CLOSED FOR INCOMPLETENESS 2 $428,260 15 $373,044 59 $424,063 5 $118,694 0 $0 6 $364,623 0 $0
Aggregated Statistics For Year 2007(Based on 10 full and 5 partial tracts) A) FHA, FSA/RHS & VA B) Conventional C) Refinancings D) Home Improvement Loans E) Loans on Dwellings For 5+ Families F) Non-occupant Loans on G) Loans On Manufactured Number Average Value Number Average Value Number Average Value Number Average Value Number Average Value Number Average Value Number Average Value
LOANS ORIGINATED 3 $333,333 460 $353,063 1,016 $339,153 166 $225,819 12 $870,333 99 $350,952 12 $73,778 APPLICATIONS APPROVED, NOT ACCEPTED 0 $0 113 $313,660 251 $315,481 43 $156,363 0 $0 23 $396,213 12 $112,573 APPLICATIONS DENIED 0 $0 145 $374,761 600 $364,881 101 $160,898 3 $615,000 34 $265,294 19 $77,597 APPLICATIONS WITHDRAWN 2 $265,490 58 $376,666 322 $345,432 51 $225,992 1 $1,751,000 16 $316,797 0 $0 FILES CLOSED FOR INCOMPLETENESS 0 $0 25 $471,294 102 $359,342 4 $317,548 0 $0 3 $388,883 0 $0
Aggregated Statistics For Year 2006(Based on 10 full and 5 partial tracts) B) Conventional C) Refinancings D) Home Improvement Loans E) Loans on Dwellings For 5+ Families F) Non-occupant Loans on G) Loans On Manufactured Number Average Value Number Average Value Number Average Value Number Average Value Number Average Value Number Average Value
LOANS ORIGINATED 631 $342,600 1,429 $340,414 247 $187,016 14 $2,709,143 128 $331,718 6 $47,010 APPLICATIONS APPROVED, NOT ACCEPTED 135 $316,235 291 $334,057 42 $178,913 0 $0 23 $272,034 12 $50,748 APPLICATIONS DENIED 162 $352,703 561 $355,084 121 $183,376 0 $0 37 $328,693 12 $61,090 APPLICATIONS WITHDRAWN 95 $329,829 471 $344,250 51 $195,465 0 $0 22 $325,490 2 $30,000 FILES CLOSED FOR INCOMPLETENESS 31 $361,825 113 $350,358 9 $197,644 0 $0 10 $281,392 1 $470,000
Aggregated Statistics For Year 2005(Based on 10 full and 5 partial tracts) A) FHA, FSA/RHS & VA B) Conventional C) Refinancings D) Home Improvement Loans E) Loans on Dwellings For 5+ Families F) Non-occupant Loans on G) Loans On Manufactured Number Average Value Number Average Value Number Average Value Number Average Value Number Average Value Number Average Value Number Average Value
LOANS ORIGINATED 1 $238,760 842 $332,023 1,819 $317,586 324 $186,260 9 $1,526,433 166 $302,030 8 $138,485 APPLICATIONS APPROVED, NOT ACCEPTED 0 $0 129 $291,217 270 $308,698 39 $174,811 0 $0 35 $274,769 14 $54,474 APPLICATIONS DENIED 0 $0 166 $308,552 593 $332,979 146 $153,673 0 $0 32 $257,541 16 $59,318 APPLICATIONS WITHDRAWN 0 $0 108 $349,751 551 $307,838 108 $226,158 1 $700,000 30 $351,115 4 $56,000 FILES CLOSED FOR INCOMPLETENESS 0 $0 26 $313,826 147 $336,283 17 $110,295 0 $0 4 $281,655 1 $160,000
Aggregated Statistics For Year 2004(Based on 10 full and 5 partial tracts) A) FHA, FSA/RHS & VA B) Conventional C) Refinancings D) Home Improvement Loans E) Loans on Dwellings For 5+ Families F) Non-occupant Loans on G) Loans On Manufactured Number Average Value Number Average Value Number Average Value Number Average Value Number Average Value Number Average Value Number Average Value
LOANS ORIGINATED 1 $385,300 859 $294,884 2,183 $270,193 312 $164,515 11 $1,544,683 164 $231,648 7 $45,961 APPLICATIONS APPROVED, NOT ACCEPTED 1 $251,240 156 $323,055 370 $254,453 49 $134,920 1 $975,000 26 $240,710 3 $44,223 APPLICATIONS DENIED 0 $0 165 $299,673 576 $275,750 130 $133,526 1 $950,550 38 $279,742 9 $39,848 APPLICATIONS WITHDRAWN 3 $203,773 121 $313,497 567 $259,850 73 $158,173 0 $0 13 $172,080 2 $198,000 FILES CLOSED FOR INCOMPLETENESS 0 $0 24 $238,575 128 $272,136 25 $125,688 0 $0 6 $263,565 0 $0
Aggregated Statistics For Year 2003(Based on 10 full and 5 partial tracts) A) FHA, FSA/RHS & VA B) Conventional C) Refinancings D) Home Improvement Loans E) Loans on Dwellings For 5+ Families F) Non-occupant Loans on Number Average Value Number Average Value Number Average Value Number Average Value Number Average Value Number Average Value
LOANS ORIGINATED 25 $244,984 865 $255,078 4,476 $219,258 156 $59,423 13 $2,684,660 258 $197,167 APPLICATIONS APPROVED, NOT ACCEPTED 1 $162,230 119 $230,445 557 $224,473 30 $102,570 0 $0 40 $174,259 APPLICATIONS DENIED 2 $233,170 120 $229,409 775 $220,499 69 $67,395 0 $0 43 $204,704 APPLICATIONS WITHDRAWN 2 $269,260 125 $275,443 835 $225,788 26 $92,778 0 $0 32 $182,278 FILES CLOSED FOR INCOMPLETENESS 1 $157,000 34 $274,584 178 $244,798 7 $59,287 1 $500,000 8 $211,188
Aggregated Statistics For Year 2002(Based on 10 full and 4 partial tracts) A) FHA, FSA/RHS & VA B) Conventional C) Refinancings D) Home Improvement Loans E) Loans on Dwellings For 5+ Families F) Non-occupant Loans on Number Average Value Number Average Value Number Average Value Number Average Value Number Average Value Number Average Value
LOANS ORIGINATED 39 $217,898 817 $219,593 3,027 $205,203 97 $73,148 9 $627,332 142 $172,649 APPLICATIONS APPROVED, NOT ACCEPTED 5 $165,282 99 $229,436 412 $195,088 30 $40,170 0 $0 16 $202,297 APPLICATIONS DENIED 3 $140,190 127 $153,876 541 $202,220 63 $40,638 0 $0 18 $151,224 APPLICATIONS WITHDRAWN 5 $183,452 125 $236,291 547 $206,544 35 $48,547 0 $0 31 $178,808 FILES CLOSED FOR INCOMPLETENESS 1 $113,430 36 $239,610 186 $222,414 2 $17,320 1 $950,000 5 $181,380
Aggregated Statistics For Year 2001(Based on 10 full and 4 partial tracts) A) FHA, FSA/RHS & VA B) Conventional C) Refinancings D) Home Improvement Loans E) Loans on Dwellings For 5+ Families F) Non-occupant Loans on Number Average Value Number Average Value Number Average Value Number Average Value Number Average Value Number Average Value
LOANS ORIGINATED 94 $193,957 686 $194,488 2,169 $185,720 134 $41,075 8 $974,000 122 $162,139 APPLICATIONS APPROVED, NOT ACCEPTED 6 $183,287 78 $191,491 284 $178,074 32 $46,523 0 $0 8 $136,960 APPLICATIONS DENIED 9 $198,186 99 $147,486 540 $182,421 71 $39,100 2 $428,500 23 $175,185 APPLICATIONS WITHDRAWN 11 $212,911 96 $182,680 487 $174,337 38 $51,932 0 $0 20 $209,501 FILES CLOSED FOR INCOMPLETENESS 1 $148,000 22 $191,859 163 $193,963 4 $91,220 1 $3,100,000 9 $129,358
Aggregated Statistics For Year 2000(Based on 10 full and 4 partial tracts) A) FHA, FSA/RHS & VA B) Conventional C) Refinancings D) Home Improvement Loans E) Loans on Dwellings For 5+ Families F) Non-occupant Loans on Number Average Value Number Average Value Number Average Value Number Average Value Number Average Value Number Average Value
LOANS ORIGINATED 100 $179,810 652 $178,770 517 $143,627 162 $39,787 6 $494,425 57 $139,031 APPLICATIONS APPROVED, NOT ACCEPTED 5 $183,646 69 $165,938 100 $132,291 55 $38,735 0 $0 10 $116,336 APPLICATIONS DENIED 5 $163,070 139 $146,776 280 $136,637 64 $32,960 5 $418,422 17 $114,094 APPLICATIONS WITHDRAWN 13 $154,928 84 $181,451 170 $133,184 27 $49,189 0 $0 9 $116,634 FILES CLOSED FOR INCOMPLETENESS 5 $179,476 17 $161,739 80 $187,822 5 $23,908 2 $856,800 3 $165,333
Aggregated Statistics For Year 1999(Based on 10 full and 4 partial tracts) A) FHA, FSA/RHS & VA B) Conventional C) Refinancings D) Home Improvement Loans E) Loans on Dwellings For 5+ Families F) Non-occupant Loans on Number Average Value Number Average Value Number Average Value Number Average Value Number Average Value Number Average Value
LOANS ORIGINATED 125 $168,749 608 $175,907 1,088 $166,501 150 $43,603 8 $384,340 87 $142,219 APPLICATIONS APPROVED, NOT ACCEPTED 7 $148,617 67 $167,119 182 $174,852 53 $35,930 0 $0 17 $141,639 APPLICATIONS DENIED 10 $163,516 121 $166,811 387 $160,510 78 $27,096 0 $0 28 $154,519 APPLICATIONS WITHDRAWN 19 $151,919 106 $172,767 274 $171,438 17 $34,869 1 $117,870 17 $167,922 FILES CLOSED FOR INCOMPLETENESS 2 $118,340 26 $200,364 122 $196,297 2 $26,500 0 $0 5 $121,510
Detailed mortgage data for all 15 tracts in Glendora, CA
Private Mortgage Insurance Companies Aggregated Statistics For Year 2009(Based on 8 full and 5 partial tracts) A) Conventional B) Refinancings Number Average Value Number Average Value
LOANS ORIGINATED 17 $343,300 9 $367,474 APPLICATIONS APPROVED, NOT ACCEPTED 10 $353,864 7 $402,220 APPLICATIONS DENIED 2 $456,625 2 $396,305 APPLICATIONS WITHDRAWN 0 $0 0 $0 FILES CLOSED FOR INCOMPLETENESS 0 $0 1 $378,000
Aggregated Statistics For Year 2008(Based on 10 full and 5 partial tracts) A) Conventional B) Refinancings C) Non-occupant Loans on Number Average Value Number Average Value Number Average Value
LOANS ORIGINATED 54 $362,908 9 $399,784 0 $0 APPLICATIONS APPROVED, NOT ACCEPTED 23 $410,762 12 $437,376 1 $499,980 APPLICATIONS DENIED 6 $365,390 3 $512,663 1 $377,340 APPLICATIONS WITHDRAWN 4 $361,045 0 $0 0 $0 FILES CLOSED FOR INCOMPLETENESS 2 $378,335 0 $0 0 $0
Aggregated Statistics For Year 2007(Based on 8 full and 5 partial tracts) A) Conventional B) Refinancings C) Non-occupant Loans on Number Average Value Number Average Value Number Average Value
LOANS ORIGINATED 16 $420,556 19 $460,273 1 $344,000 APPLICATIONS APPROVED, NOT ACCEPTED 2 $450,500 7 $498,826 0 $0 APPLICATIONS DENIED 3 $657,667 2 $546,220 0 $0 APPLICATIONS WITHDRAWN 3 $549,000 2 $272,115 1 $581,000 FILES CLOSED FOR INCOMPLETENESS 0 $0 0 $0 0 $0
Aggregated Statistics For Year 2006(Based on 6 full and 3 partial tracts) A) Conventional B) Refinancings C) Non-occupant Loans on Number Average Value Number Average Value Number Average Value
LOANS ORIGINATED 10 $449,386 6 $403,852 1 $414,450 APPLICATIONS APPROVED, NOT ACCEPTED 3 $382,340 4 $330,075 1 $443,860 APPLICATIONS DENIED 0 $0 0 $0 0 $0 APPLICATIONS WITHDRAWN 0 $0 0 $0 0 $0 FILES CLOSED FOR INCOMPLETENESS 0 $0 0 $0 0 $0
Aggregated Statistics For Year 2005(Based on 9 full and 3 partial tracts) A) Conventional B) Refinancings C) Non-occupant Loans on Number Average Value Number Average Value Number Average Value
LOANS ORIGINATED 11 $429,095 14 $363,059 1 $360,000 APPLICATIONS APPROVED, NOT ACCEPTED 1 $285,000 5 $373,400 0 $0 APPLICATIONS DENIED 1 $458,200 0 $0 0 $0 APPLICATIONS WITHDRAWN 2 $131,235 1 $259,820 0 $0 FILES CLOSED FOR INCOMPLETENESS 0 $0 2 $459,500 0 $0
Aggregated Statistics For Year 2004(Based on 9 full and 5 partial tracts) A) Conventional B) Refinancings C) Non-occupant Loans on Number Average Value Number Average Value Number Average Value
LOANS ORIGINATED 27 $325,404 15 $300,483 4 $274,850 APPLICATIONS APPROVED, NOT ACCEPTED 5 $352,728 14 $251,843 1 $108,770 APPLICATIONS DENIED 0 $0 0 $0 0 $0 APPLICATIONS WITHDRAWN 2 $252,115 2 $269,080 0 $0 FILES CLOSED FOR INCOMPLETENESS 0 $0 1 $279,000 0 $0
Aggregated Statistics For Year 2003(Based on 10 full and 5 partial tracts) A) Conventional B) Refinancings C) Non-occupant Loans on Number Average Value Number Average Value Number Average Value
LOANS ORIGINATED 77 $287,364 77 $252,495 3 $225,567 APPLICATIONS APPROVED, NOT ACCEPTED 18 $272,744 42 $246,122 1 $222,000 APPLICATIONS DENIED 0 $0 2 $190,000 0 $0 APPLICATIONS WITHDRAWN 3 $276,130 6 $281,807 0 $0 FILES CLOSED FOR INCOMPLETENESS 0 $0 1 $298,000 0 $0
Aggregated Statistics For Year 2002(Based on 10 full and 4 partial tracts) A) Conventional B) Refinancings C) Non-occupant Loans on Number Average Value Number Average Value Number Average Value
LOANS ORIGINATED 98 $239,945 86 $234,296 5 $213,792 APPLICATIONS APPROVED, NOT ACCEPTED 29 $248,079 38 $239,223 0 $0 APPLICATIONS DENIED 0 $0 2 $195,005 1 $180,010 APPLICATIONS WITHDRAWN 5 $245,166 3 $158,750 0 $0 FILES CLOSED FOR INCOMPLETENESS 2 $241,500 1 $249,650 0 $0
Aggregated Statistics For Year 2001(Based on 10 full and 4 partial tracts) A) Conventional B) Refinancings C) Non-occupant Loans on Number Average Value Number Average Value Number Average Value
LOANS ORIGINATED 124 $219,993 126 $209,935 2 $124,000 APPLICATIONS APPROVED, NOT ACCEPTED 21 $229,784 25 $199,132 1 $319,000 APPLICATIONS DENIED 6 $252,628 6 $189,165 3 $275,667 APPLICATIONS WITHDRAWN 7 $200,481 3 $151,110 0 $0 FILES CLOSED FOR INCOMPLETENESS 0 $0 0 $0 0 $0
Aggregated Statistics For Year 2000(Based on 10 full and 4 partial tracts) A) Conventional B) Refinancings C) Non-occupant Loans on Number Average Value Number Average Value Number Average Value
LOANS ORIGINATED 143 $194,498 39 $206,895 3 $162,903 APPLICATIONS APPROVED, NOT ACCEPTED 15 $197,453 19 $188,612 1 $176,110 APPLICATIONS DENIED 6 $203,875 2 $145,940 0 $0 APPLICATIONS WITHDRAWN 1 $156,000 2 $238,860 0 $0 FILES CLOSED FOR INCOMPLETENESS 1 $97,590 1 $157,000 0 $0
Aggregated Statistics For Year 1999(Based on 10 full and 4 partial tracts) A) Conventional B) Refinancings C) Non-occupant Loans on Number Average Value Number Average Value Number Average Value
LOANS ORIGINATED 166 $188,494 123 $183,572 6 $150,522 APPLICATIONS APPROVED, NOT ACCEPTED 23 $181,748 46 $188,701 1 $177,060 APPLICATIONS DENIED 12 $187,924 5 $224,718 2 $150,000 APPLICATIONS WITHDRAWN 7 $186,386 4 $142,692 1 $150,000 FILES CLOSED FOR INCOMPLETENESS 3 $135,553 2 $114,410 0 $0
Most common first names in Glendora, CA among deceased individuals Name Count Lived (average)
Mary 272 79.5 years John 251 74.2 years William 238 74.6 years Robert 225 69.9 years James 173 70.8 years Charles 148 74.6 years Dorothy 141 78.0 years George 127 77.3 years Frank 114 75.7 years Helen 113 81.5 years
Most common last names in Glendora, CA among deceased individuals Last name Count Lived (average)
Smith 113 77.6 years Johnson 66 71.6 years Davis 57 77.8 years Brown 55 75.4 years Miller 49 78.7 years Anderson 43 79.8 years Jones 38 79.4 years Wilson 38 74.4 years Clark 34 81.5 years Nelson 31 75.3 years
Glendora compared to California state average:
Unemployed percentage significantly below state average. Black race population percentage below state average. Median age significantly above state average. Renting percentage below state average. Length of stay since moving in significantly above state average.
#15 on the list of "Top 101 cities with largest percentage of males in industries: utilities (population 50,000+)"
#45 on the list of "Top 101 cities with the lowest number of assaults per 100,000 residents (population 50,000+)"
#48 on the list of "Top 101 cities with the smallest sunshine amount differences during a year (population 50,000+)"
#49 on the list of "Top 101 cities with largest percentage of females in occupations: office and administrative support occupations (population 50,000+)"
#50 on the list of "Top 101 cities with the most residents born in Syria (population 500+)"
#51 on the list of "Top 101 cities with fewest building permits per 10,000 residents (population 50,000+)"
#61 on the list of "Top 101 cities with the lowest number of police officers per 1000 residents (population 50,000+)"
#68 on the list of "Top 100 cities with longest commuting times (pop. 50,000+)"
#70 on the list of "Top 101 cities with largest percentage of females in industries: construction (population 50,000+)"
#73 on the list of "Top 101 cities with the most residents born in Jordan (population 500+)"
#75 on the list of "Top 101 cities with the lowest average snowfall in a year (population 50,000+)"
#75 on the list of "Top 101 cities with the most cars per house, population 50,000+"
#76 on the list of "Top 101 cities with largest percentage of females in occupations: law enforcement workers including supervisors (population 50,000+)"
#88 on the list of "Top 100 cities with highest percentage of college students (pop. 50,000+)"
#92 on the list of "Top 101 larger cities with the highest increase in house/condo value from 2000 (population 50,000+)"
#93 on the list of "Top 101 cities with the lowest number of murders per 100,000 residents (population 50,000+)"
#1 on the list of "Top 101 counties with the most Evangelical Protestant congregations"
#1 on the list of "Top 101 counties with the most Mainline Protestant congregations"
#1 on the list of "Top 101 counties with the most Orthodox adherents"
#1 on the list of "Top 101 counties with the highest ground withdrawal of fresh water for public supply (pop. 50,000+)"
#1 on the list of "Top 101 counties with the most Catholic adherents (pop. 50,000+)"
Top Patent Applicants
Joseph Stevick (18)
Buehl E. Truex (18)
Jeffrey Ying (14)
James D. Cleary (11)
Richard Jove (11)
Ariel Garcia (10)
Guomin Yu (9)
Karl Anderson (9)
Bruce Irvine (9)
Hua Yu (9)
Total of 407 patent applications in 2008-2024.


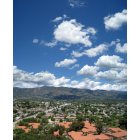


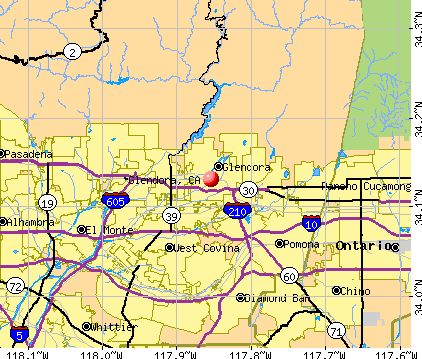


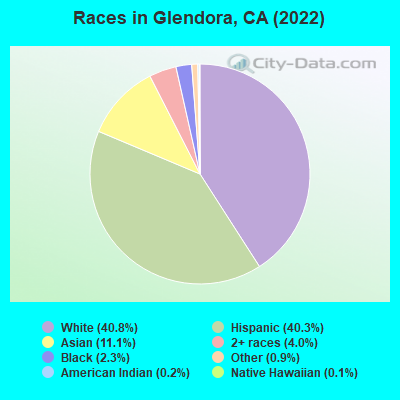
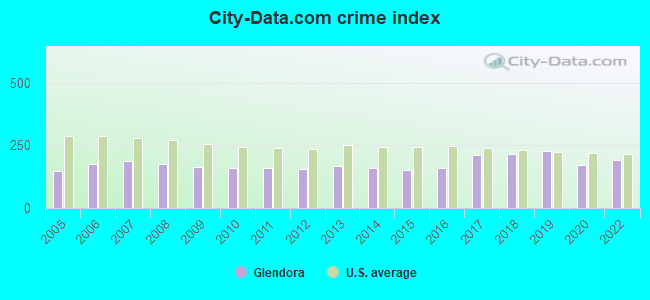
 Recent articles from our blog. Our writers, many of them Ph.D. graduates or candidates, create easy-to-read articles on a wide variety of topics.

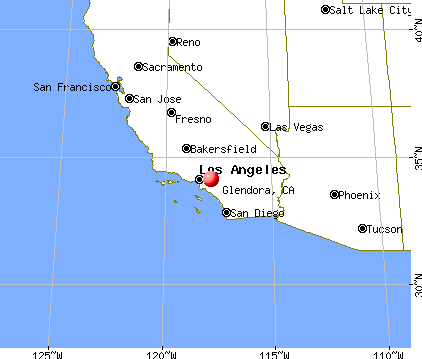
 (4.3 miles
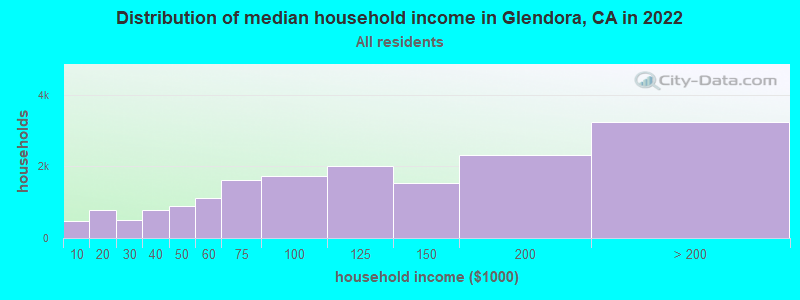
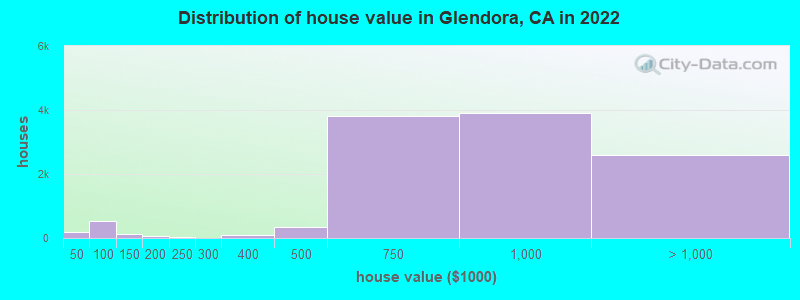
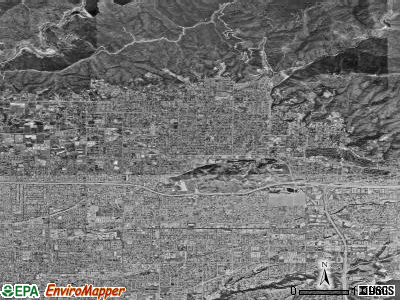
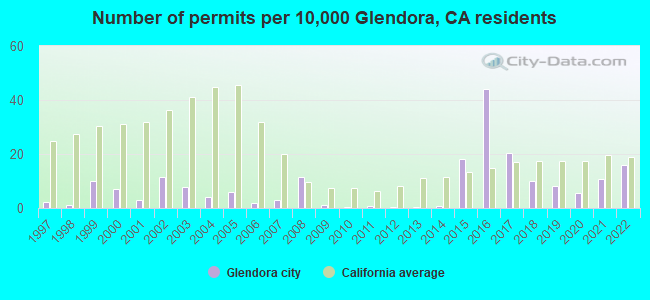
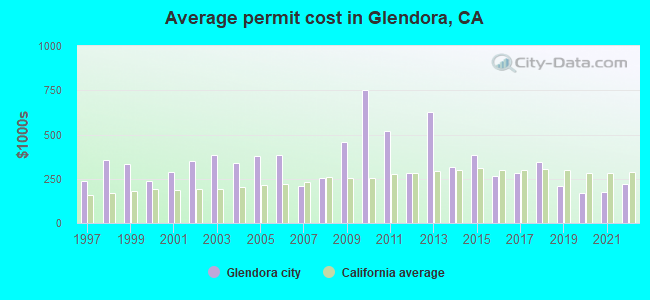
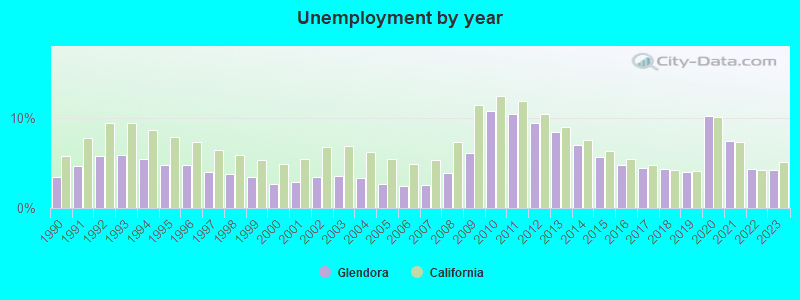
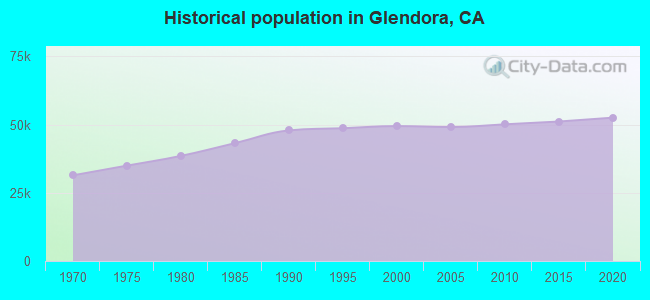
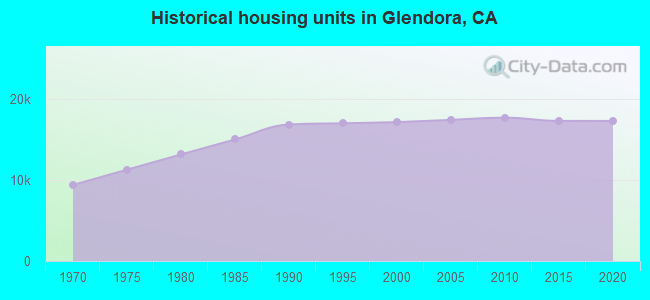
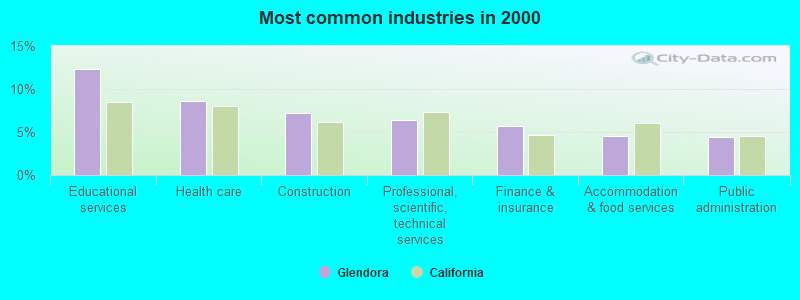
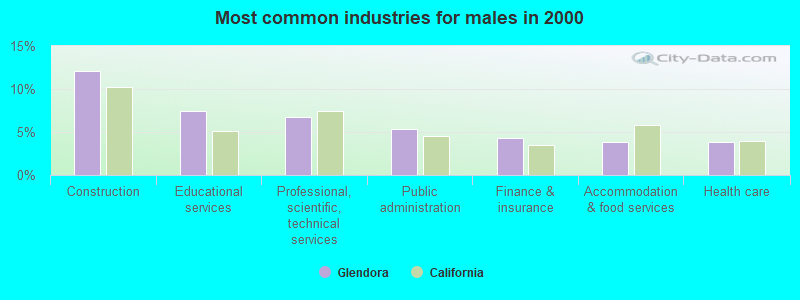
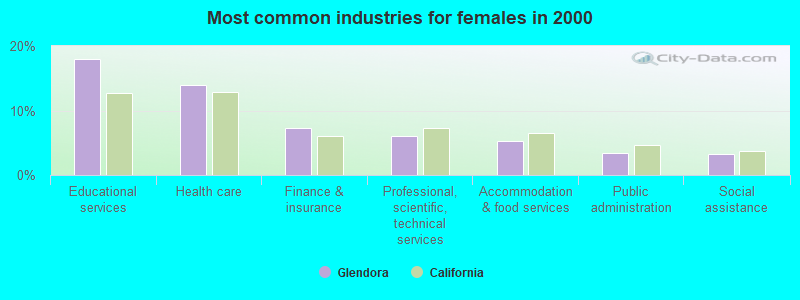
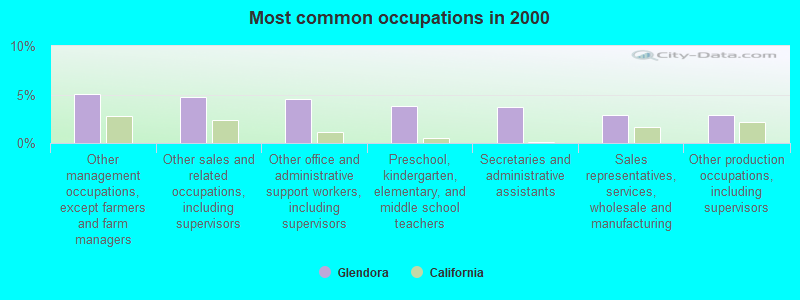
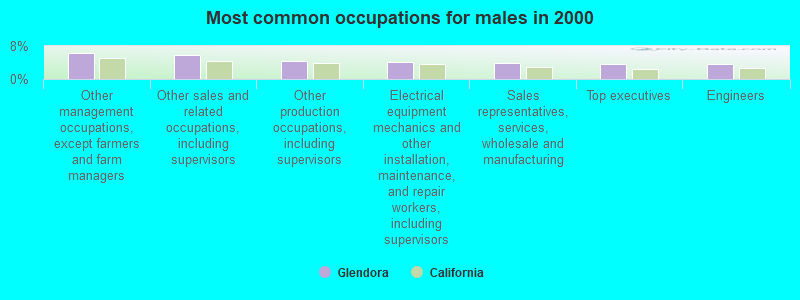
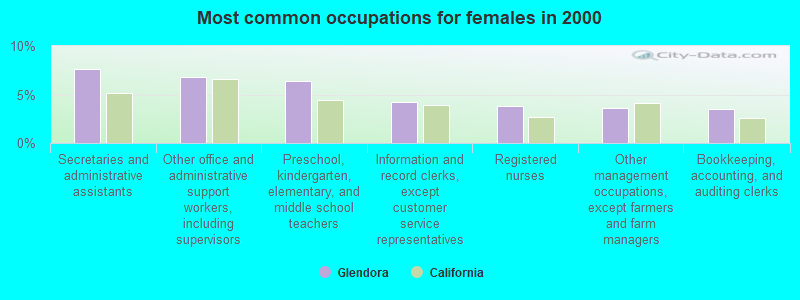
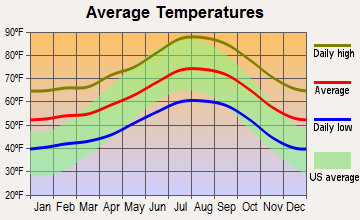
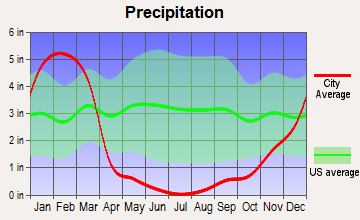
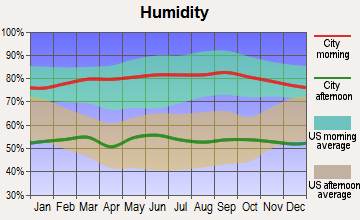
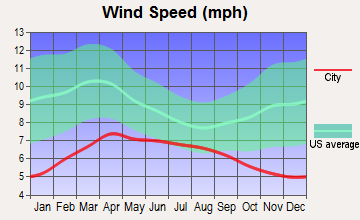

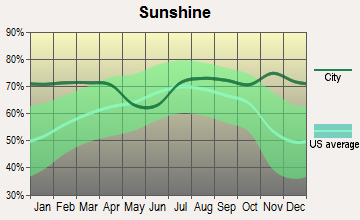
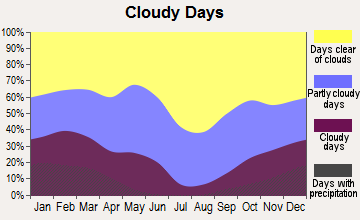
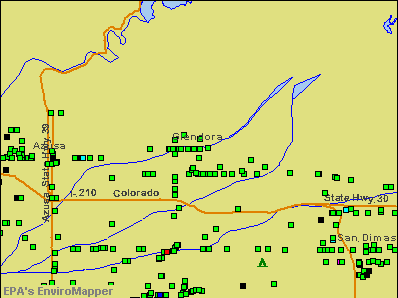

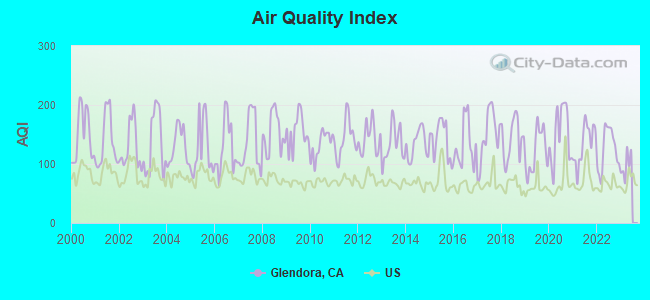
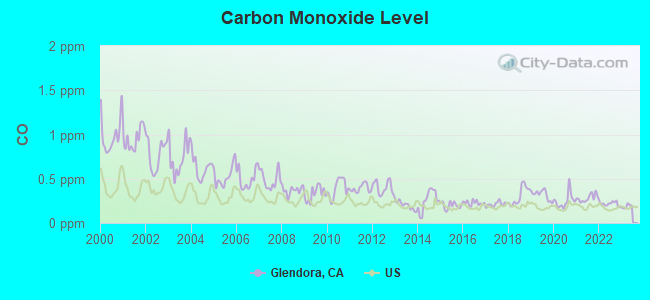
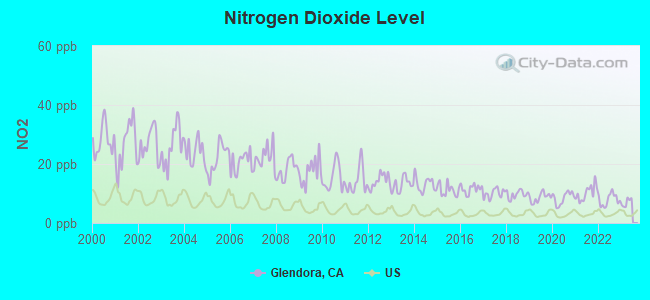
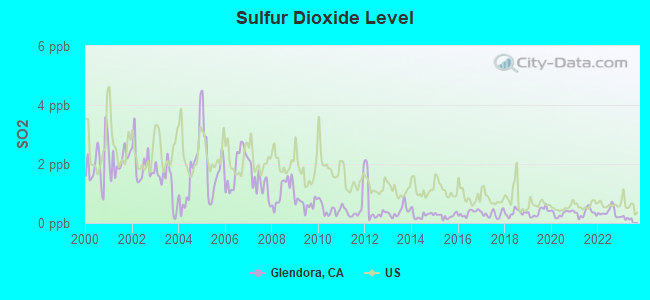
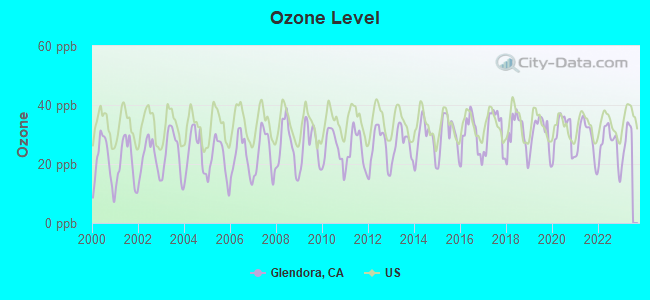
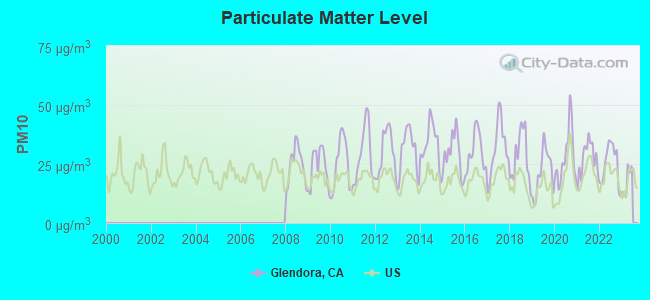
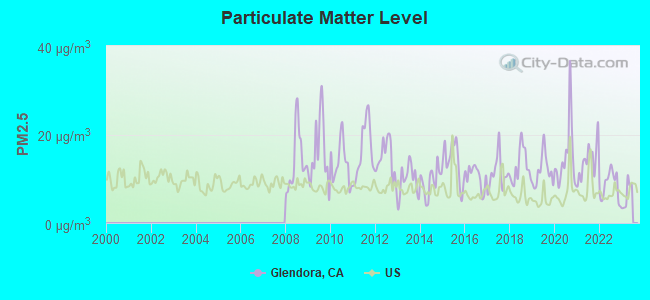
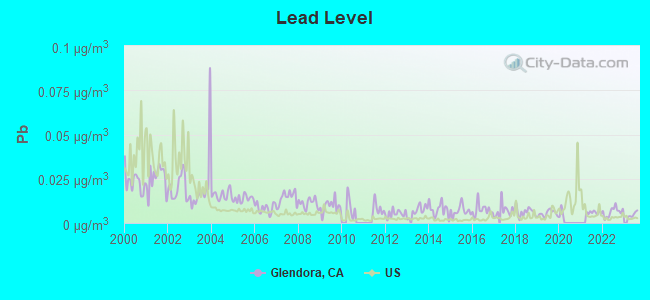
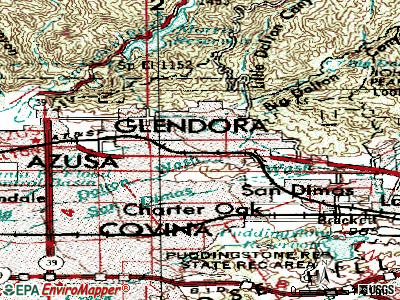
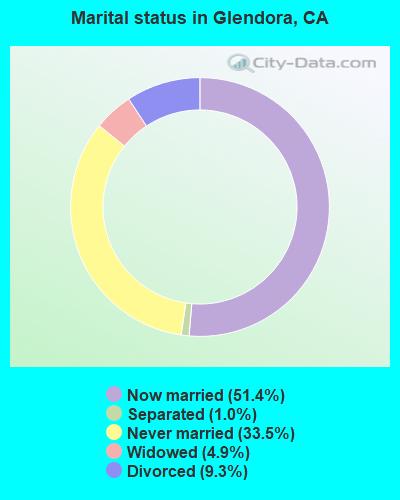
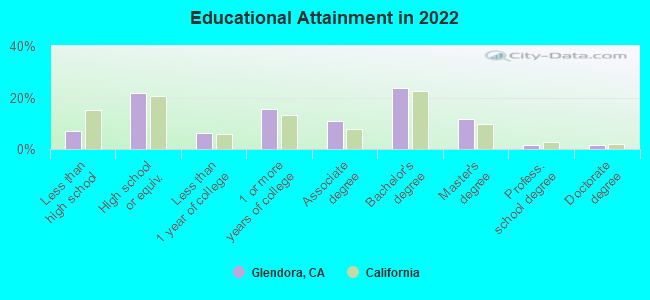
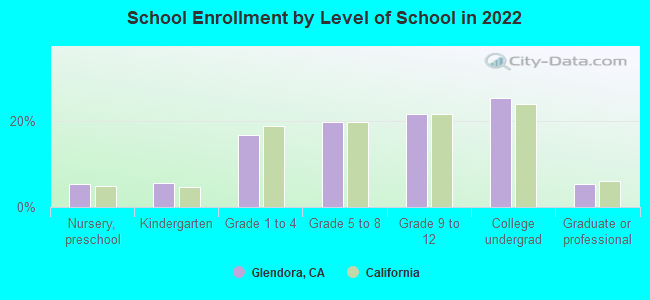

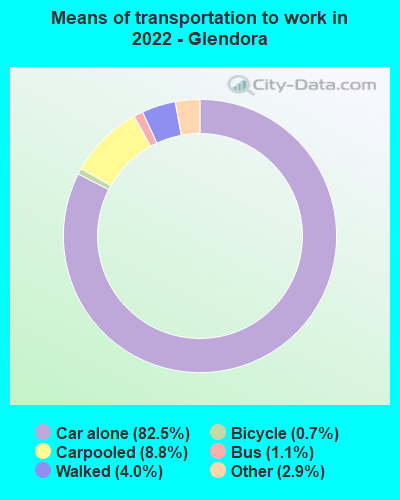


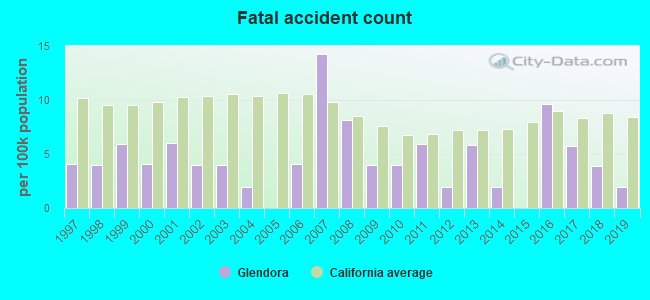
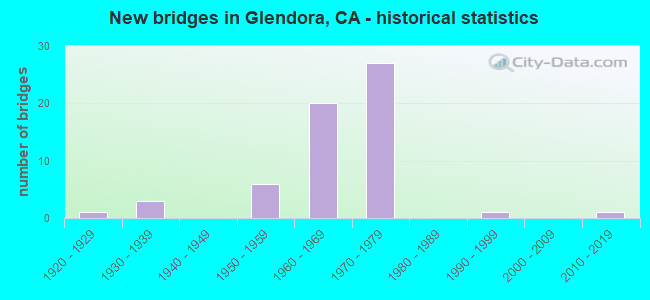
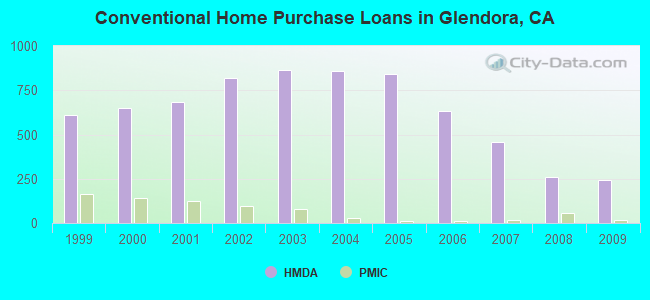
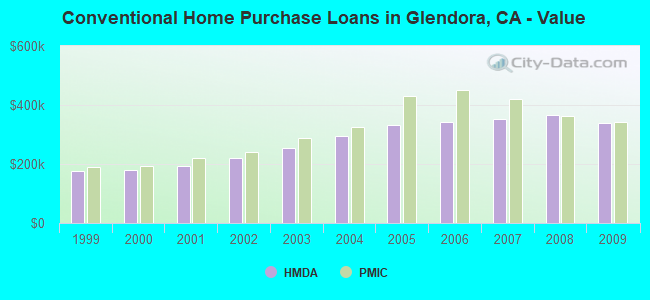
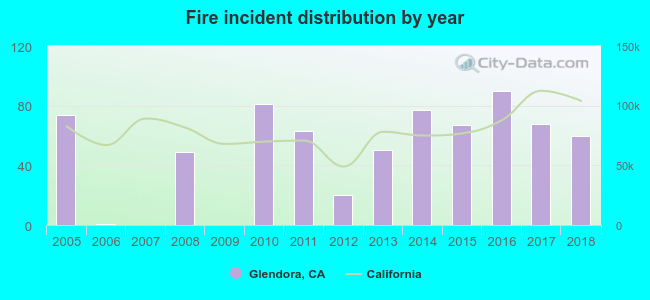 According to the data from the years 2005 - 2018 the average number of fires per year is 50. The highest number of reported fire incidents - 90 took place in 2016, and the least - 0 in 2007. The data has a dropping trend.
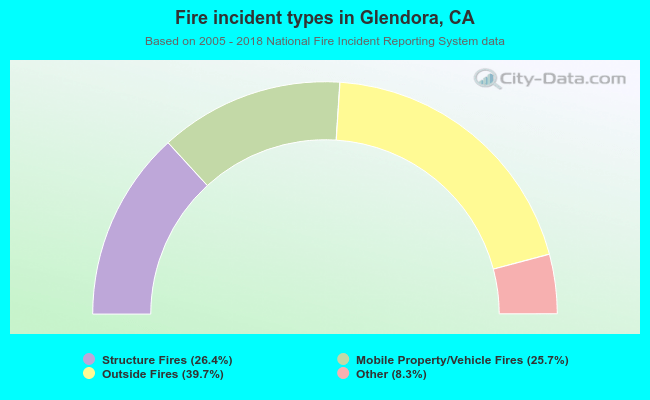 When looking into fire subcategories, the most reports belonged to: Outside Fires (39.7%), and Structure Fires (26.4%).