Estimated zip code population in 2022: 25,835
Zip code population in 2010: 25,824
Zip code population in 2000: 24,967
Houses and condos: 9,283
Renter-occupied apartments: 2,508
% of renters here:
28%State:
44%
March 2022 cost of living index in zip code 91741: 134.6
(high, U.S. average is 100)
Land area: 14.8
sq. mi.
Water area: 0.1
sq. mi.
Population density: 1,743 people per square mile (low).
OSM Map
General Map
Google Map
MSN Map
OSM Map
General Map
Google Map
MSN Map
OSM Map
General Map
Google Map
MSN Map
OSM Map
General Map
Google Map
MSN Map
Please wait while loading the map...
Real estate property taxes paid for housing units in 2022:
This zip code:
0.7% ($6,399)California:
0.7% ($4,831)
Median real estate property taxes paid for housing units with mortgages in 2022: $6,972 (0.7%)
Median real estate property taxes paid for housing units with no mortgage in 2022: $4,891 (0.5%)
Profiles of local businesses
Business Search - 14 Million verified businesses
Males: 12,628 Females: 13,207
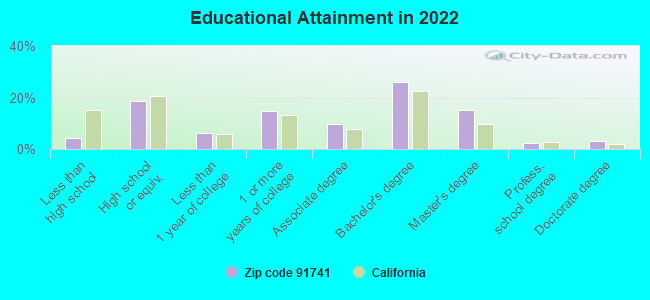
For population 25 years and over in 91741:
High school or higher: 96.1%Bachelor's degree or higher: 46.5%Graduate or professional degree: 20.5%Unemployed: 5.6%Mean travel time to work (commute): 32.5 minutes
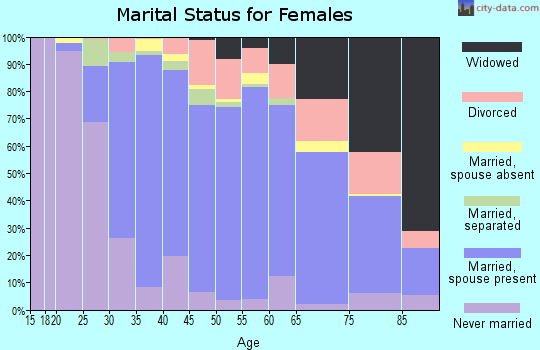
For population 15 years and over in 91741:
Never married: 30.3%Now married: 55.2%Separated: 0.7%Widowed: 5.8%Divorced: 8.1%
Zip code 91741 compared to state average:
Black race population percentage below state average. Median age above state average. Foreign-born population percentage below state average. Renting percentage below state average. Length of stay since moving in significantly above state average. Number of rooms per house above state average. 12,961 50.2% White 7,694 29.8% Hispanic or Latino 3,365 13.0% Asian 897 3.5% Two or more races 646 2.5% Black 176 0.7% Some other race 43 0.2% American Indian 49 0.2% Native Hawaiian and Other
Data:
Median household income ($)
Median household income (% change since 2000)
Household income diversity
Ratio of average income to average house value (%)
Ratio of average income to average rent
Median household income ($) - White
Median household income ($) - Black or African American
Median household income ($) - Asian
Median household income ($) - Hispanic or Latino
Median household income ($) - American Indian and Alaska Native
Median household income ($) - Multirace
Median household income ($) - Other Race
Median household income for houses/condos with a mortgage ($)
Median household income for apartments without a mortgage ($)
Races - White alone (%)
Races - White alone (% change since 2000)
Races - Black alone (%)
Races - Black alone (% change since 2000)
Races - American Indian alone (%)
Races - American Indian alone (% change since 2000)
Races - Asian alone (%)
Races - Asian alone (% change since 2000)
Races - Hispanic (%)
Races - Hispanic (% change since 2000)
Races - Native Hawaiian and Other Pacific Islander alone (%)
Races - Native Hawaiian and Other Pacific Islander alone (% change since 2000)
Races - Two or more races (%)
Races - Two or more races (% change since 2000)
Races - Other race alone (%)
Races - Other race alone (% change since 2000)
Racial diversity
Unemployment (%)
Unemployment (% change since 2000)
Unemployment (%) - White
Unemployment (%) - Black or African American
Unemployment (%) - Asian
Unemployment (%) - Hispanic or Latino
Unemployment (%) - American Indian and Alaska Native
Unemployment (%) - Multirace
Unemployment (%) - Other Race
Population density (people per square mile)
Population - Males (%)
Population - Females (%)
Population - Males (%) - White
Population - Males (%) - Black or African American
Population - Males (%) - Asian
Population - Males (%) - Hispanic or Latino
Population - Males (%) - American Indian and Alaska Native
Population - Males (%) - Multirace
Population - Males (%) - Other Race
Population - Females (%) - White
Population - Females (%) - Black or African American
Population - Females (%) - Asian
Population - Females (%) - Hispanic or Latino
Population - Females (%) - American Indian and Alaska Native
Population - Females (%) - Multirace
Population - Females (%) - Other Race
Coronavirus confirmed cases (Apr 27, 2024)
Deaths caused by coronavirus (Apr 27, 2024)
Coronavirus confirmed cases (per 100k population) (Apr 27, 2024)
Deaths caused by coronavirus (per 100k population) (Apr 27, 2024)
Daily increase in number of cases (Apr 27, 2024)
Weekly increase in number of cases (Apr 27, 2024)
Cases doubled (in days) (Apr 27, 2024)
Hospitalized patients (Apr 18, 2022)
Negative test results (Apr 18, 2022)
Total test results (Apr 18, 2022)
COVID Vaccine doses distributed (per 100k population) (Sep 19, 2023)
COVID Vaccine doses administered (per 100k population) (Sep 19, 2023)
COVID Vaccine doses distributed (Sep 19, 2023)
COVID Vaccine doses administered (Sep 19, 2023)
Likely homosexual households (%)
Likely homosexual households (% change since 2000)
Likely homosexual households - Lesbian couples (%)
Likely homosexual households - Lesbian couples (% change since 2000)
Likely homosexual households - Gay men (%)
Likely homosexual households - Gay men (% change since 2000)
Cost of living index
Median gross rent ($)
Median contract rent ($)
Median monthly housing costs ($)
Median house or condo value ($)
Median house or condo value ($ change since 2000)
Mean house or condo value by units in structure - 1, detached ($)
Mean house or condo value by units in structure - 1, attached ($)
Mean house or condo value by units in structure - 2 ($)
Mean house or condo value by units in structure by units in structure - 3 or 4 ($)
Mean house or condo value by units in structure - 5 or more ($)
Mean house or condo value by units in structure - Boat, RV, van, etc. ($)
Mean house or condo value by units in structure - Mobile home ($)
Median house or condo value ($) - White
Median house or condo value ($) - Black or African American
Median house or condo value ($) - Asian
Median house or condo value ($) - Hispanic or Latino
Median house or condo value ($) - American Indian and Alaska Native
Median house or condo value ($) - Multirace
Median house or condo value ($) - Other Race
Median resident age
Resident age diversity
Median resident age - Males
Median resident age - Females
Median resident age - White
Median resident age - Black or African American
Median resident age - Asian
Median resident age - Hispanic or Latino
Median resident age - American Indian and Alaska Native
Median resident age - Multirace
Median resident age - Other Race
Median resident age - Males - White
Median resident age - Males - Black or African American
Median resident age - Males - Asian
Median resident age - Males - Hispanic or Latino
Median resident age - Males - American Indian and Alaska Native
Median resident age - Males - Multirace
Median resident age - Males - Other Race
Median resident age - Females - White
Median resident age - Females - Black or African American
Median resident age - Females - Asian
Median resident age - Females - Hispanic or Latino
Median resident age - Females - American Indian and Alaska Native
Median resident age - Females - Multirace
Median resident age - Females - Other Race
Commute - mean travel time to work (minutes)
Travel time to work - Less than 5 minutes (%)
Travel time to work - Less than 5 minutes (% change since 2000)
Travel time to work - 5 to 9 minutes (%)
Travel time to work - 5 to 9 minutes (% change since 2000)
Travel time to work - 10 to 19 minutes (%)
Travel time to work - 10 to 19 minutes (% change since 2000)
Travel time to work - 20 to 29 minutes (%)
Travel time to work - 20 to 29 minutes (% change since 2000)
Travel time to work - 30 to 39 minutes (%)
Travel time to work - 30 to 39 minutes (% change since 2000)
Travel time to work - 40 to 59 minutes (%)
Travel time to work - 40 to 59 minutes (% change since 2000)
Travel time to work - 60 to 89 minutes (%)
Travel time to work - 60 to 89 minutes (% change since 2000)
Travel time to work - 90 or more minutes (%)
Travel time to work - 90 or more minutes (% change since 2000)
Marital status - Never married (%)
Marital status - Now married (%)
Marital status - Separated (%)
Marital status - Widowed (%)
Marital status - Divorced (%)
Median family income ($)
Median family income (% change since 2000)
Median non-family income ($)
Median non-family income (% change since 2000)
Median per capita income ($)
Median per capita income (% change since 2000)
Median family income ($) - White
Median family income ($) - Black or African American
Median family income ($) - Asian
Median family income ($) - Hispanic or Latino
Median family income ($) - American Indian and Alaska Native
Median family income ($) - Multirace
Median family income ($) - Other Race
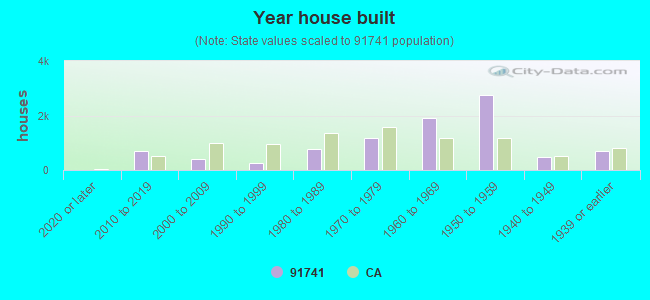
Median year house/condo built
Median year apartment built
Year house built - Built 2005 or later (%)
Year house built - Built 2000 to 2004 (%)
Year house built - Built 1990 to 1999 (%)
Year house built - Built 1980 to 1989 (%)
Year house built - Built 1970 to 1979 (%)
Year house built - Built 1960 to 1969 (%)
Year house built - Built 1950 to 1959 (%)
Year house built - Built 1940 to 1949 (%)
Year house built - Built 1939 or earlier (%)
Average household size
Household density (households per square mile)
Average household size - White
Average household size - Black or African American
Average household size - Asian
Average household size - Hispanic or Latino
Average household size - American Indian and Alaska Native
Average household size - Multirace
Average household size - Other Race
Occupied housing units (%)
Vacant housing units (%)
Owner occupied housing units (%)
Renter occupied housing units (%)
Vacancy status - For rent (%)
Vacancy status - For sale only (%)
Vacancy status - Rented or sold, not occupied (%)
Vacancy status - For seasonal, recreational, or occasional use (%)
Vacancy status - For migrant workers (%)
Vacancy status - Other vacant (%)
Residents with income below the poverty level (%)
Residents with income below 50% of the poverty level (%)
Children below poverty level (%)
Poor families by family type - Married-couple family (%)
Poor families by family type - Male, no wife present (%)
Poor families by family type - Female, no husband present (%)
Poverty status for native-born residents (%)
Poverty status for foreign-born residents (%)
Poverty among high school graduates not in families (%)
Poverty among people who did not graduate high school not in families (%)
Residents with income below the poverty level (%) - White
Residents with income below the poverty level (%) - Black or African American
Residents with income below the poverty level (%) - Asian
Residents with income below the poverty level (%) - Hispanic or Latino
Residents with income below the poverty level (%) - American Indian and Alaska Native
Residents with income below the poverty level (%) - Multirace
Residents with income below the poverty level (%) - Other Race
Air pollution - Air Quality Index (AQI)
Air pollution - CO
Air pollution - NO2
Air pollution - SO2
Air pollution - Ozone
Air pollution - PM10
Air pollution - PM25
Air pollution - Pb
Crime - Murders per 100,000 population
Crime - Rapes per 100,000 population
Crime - Robberies per 100,000 population
Crime - Assaults per 100,000 population
Crime - Burglaries per 100,000 population
Crime - Thefts per 100,000 population
Crime - Auto thefts per 100,000 population
Crime - Arson per 100,000 population
Crime - City-data.com crime index
Crime - Violent crime index
Crime - Property crime index
Crime - Murders per 100,000 population (5 year average)
Crime - Rapes per 100,000 population (5 year average)
Crime - Robberies per 100,000 population (5 year average)
Crime - Assaults per 100,000 population (5 year average)
Crime - Burglaries per 100,000 population (5 year average)
Crime - Thefts per 100,000 population (5 year average)
Crime - Auto thefts per 100,000 population (5 year average)
Crime - Arson per 100,000 population (5 year average)
Crime - City-data.com crime index (5 year average)
Crime - Violent crime index (5 year average)
Crime - Property crime index (5 year average)
1996 Presidential Elections Results (%) - Democratic Party (Clinton)
1996 Presidential Elections Results (%) - Republican Party (Dole)
1996 Presidential Elections Results (%) - Other
2000 Presidential Elections Results (%) - Democratic Party (Gore)
2000 Presidential Elections Results (%) - Republican Party (Bush)
2000 Presidential Elections Results (%) - Other
2004 Presidential Elections Results (%) - Democratic Party (Kerry)
2004 Presidential Elections Results (%) - Republican Party (Bush)
2004 Presidential Elections Results (%) - Other
2008 Presidential Elections Results (%) - Democratic Party (Obama)
2008 Presidential Elections Results (%) - Republican Party (McCain)
2008 Presidential Elections Results (%) - Other
2012 Presidential Elections Results (%) - Democratic Party (Obama)
2012 Presidential Elections Results (%) - Republican Party (Romney)
2012 Presidential Elections Results (%) - Other
2016 Presidential Elections Results (%) - Democratic Party (Clinton)
2016 Presidential Elections Results (%) - Republican Party (Trump)
2016 Presidential Elections Results (%) - Other
2020 Presidential Elections Results (%) - Democratic Party (Biden)
2020 Presidential Elections Results (%) - Republican Party (Trump)
2020 Presidential Elections Results (%) - Other
Ancestries Reported - Arab (%)
Ancestries Reported - Czech (%)
Ancestries Reported - Danish (%)
Ancestries Reported - Dutch (%)
Ancestries Reported - English (%)
Ancestries Reported - French (%)
Ancestries Reported - French Canadian (%)
Ancestries Reported - German (%)
Ancestries Reported - Greek (%)
Ancestries Reported - Hungarian (%)
Ancestries Reported - Irish (%)
Ancestries Reported - Italian (%)
Ancestries Reported - Lithuanian (%)
Ancestries Reported - Norwegian (%)
Ancestries Reported - Polish (%)
Ancestries Reported - Portuguese (%)
Ancestries Reported - Russian (%)
Ancestries Reported - Scotch-Irish (%)
Ancestries Reported - Scottish (%)
Ancestries Reported - Slovak (%)
Ancestries Reported - Subsaharan African (%)
Ancestries Reported - Swedish (%)
Ancestries Reported - Swiss (%)
Ancestries Reported - Ukrainian (%)
Ancestries Reported - United States (%)
Ancestries Reported - Welsh (%)
Ancestries Reported - West Indian (%)
Ancestries Reported - Other (%)
Educational Attainment - No schooling completed (%)
Educational Attainment - Less than high school (%)
Educational Attainment - High school or equivalent (%)
Educational Attainment - Less than 1 year of college (%)
Educational Attainment - 1 or more years of college (%)
Educational Attainment - Associate degree (%)
Educational Attainment - Bachelor's degree (%)
Educational Attainment - Master's degree (%)
Educational Attainment - Professional school degree (%)
Educational Attainment - Doctorate degree (%)
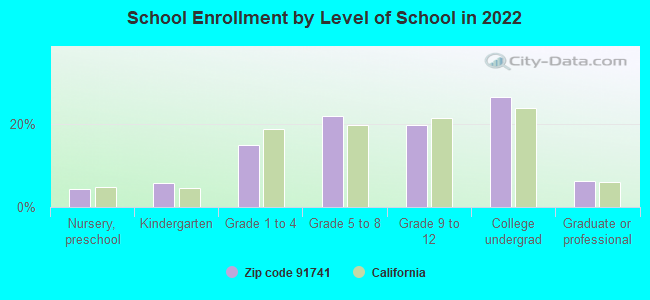
School Enrollment - Nursery, preschool (%)
School Enrollment - Kindergarten (%)
School Enrollment - Grade 1 to 4 (%)
School Enrollment - Grade 5 to 8 (%)
School Enrollment - Grade 9 to 12 (%)
School Enrollment - College undergrad (%)
School Enrollment - Graduate or professional (%)
School Enrollment - Not enrolled in school (%)
School enrollment - Public schools (%)
School enrollment - Private schools (%)
School enrollment - Not enrolled (%)
Median number of rooms in houses and condos
Median number of rooms in apartments
Housing units lacking complete plumbing facilities (%)
Housing units lacking complete kitchen facilities (%)
Density of houses
Urban houses (%)
Rural houses (%)
Households with people 60 years and over (%)
Households with people 65 years and over (%)
Households with people 75 years and over (%)
Households with one or more nonrelatives (%)
Households with no nonrelatives (%)
Population in households (%)
Family households (%)
Nonfamily households (%)
Population in families (%)
Family households with own children (%)
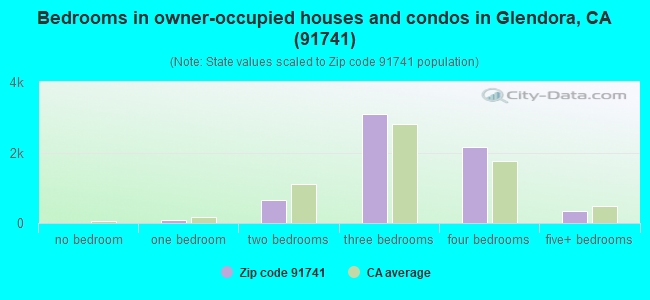
Median number of bedrooms in owner occupied houses
Mean number of bedrooms in owner occupied houses
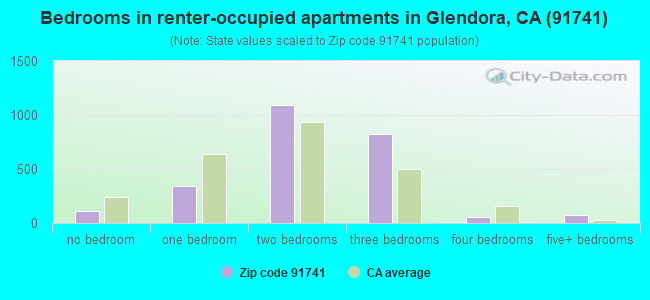
Median number of bedrooms in renter occupied houses
Mean number of bedrooms in renter occupied houses
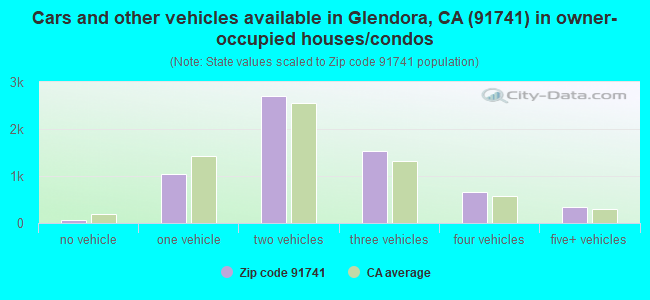
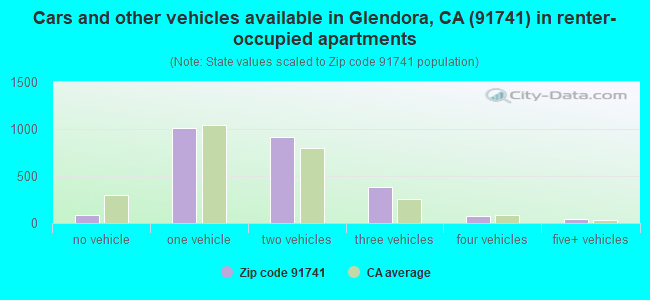
Median number of vehichles in owner occupied houses
Mean number of vehichles in owner occupied houses
Median number of vehichles in renter occupied houses
Mean number of vehichles in renter occupied houses
Mortgage status - with mortgage (%)
Mortgage status - with second mortgage (%)
Mortgage status - with home equity loan (%)
Mortgage status - with both second mortgage and home equity loan (%)
Mortgage status - without a mortgage (%)
Average family size
Average family size - White
Average family size - Black or African American
Average family size - Asian
Average family size - Hispanic or Latino
Average family size - American Indian and Alaska Native
Average family size - Multirace
Average family size - Other Race
Geographical mobility - Same house 1 year ago (%)
Geographical mobility - Moved within same county (%)
Geographical mobility - Moved from different county within same state (%)
Geographical mobility - Moved from different state (%)
Geographical mobility - Moved from abroad (%)
Place of birth - Born in state of residence (%)
Place of birth - Born in other state (%)
Place of birth - Native, outside of US (%)
Place of birth - Foreign born (%)
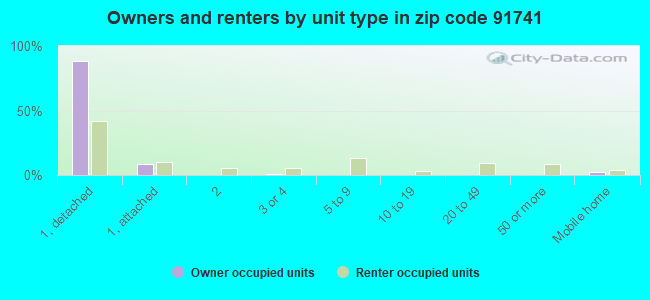
Housing units in structures - 1, detached (%)
Housing units in structures - 1, attached (%)
Housing units in structures - 2 (%)
Housing units in structures - 3 or 4 (%)
Housing units in structures - 5 to 9 (%)
Housing units in structures - 10 to 19 (%)
Housing units in structures - 20 to 49 (%)
Housing units in structures - 50 or more (%)
Housing units in structures - Mobile home (%)
Housing units in structures - Boat, RV, van, etc. (%)
House/condo owner moved in on average (years ago)
Renter moved in on average (years ago)
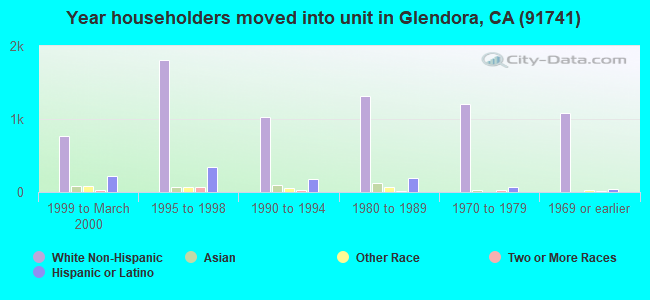
Year householder moved into unit - Moved in 1999 to March 2000 (%)
Year householder moved into unit - Moved in 1995 to 1998 (%)
Year householder moved into unit - Moved in 1990 to 1994 (%)
Year householder moved into unit - Moved in 1980 to 1989 (%)
Year householder moved into unit - Moved in 1970 to 1979 (%)
Year householder moved into unit - Moved in 1969 or earlier (%)
Means of transportation to work - Drove car alone (%)
Means of transportation to work - Carpooled (%)
Means of transportation to work - Public transportation (%)
Means of transportation to work - Bus or trolley bus (%)
Means of transportation to work - Streetcar or trolley car (%)
Means of transportation to work - Subway or elevated (%)
Means of transportation to work - Railroad (%)
Means of transportation to work - Ferryboat (%)
Means of transportation to work - Taxicab (%)
Means of transportation to work - Motorcycle (%)
Means of transportation to work - Bicycle (%)
Means of transportation to work - Walked (%)
Means of transportation to work - Other means (%)
Working at home (%)
Industry diversity
Most Common Industries - Agriculture, forestry, fishing and hunting, and mining (%)
Most Common Industries - Agriculture, forestry, fishing and hunting (%)
Most Common Industries - Mining, quarrying, and oil and gas extraction (%)
Most Common Industries - Construction (%)
Most Common Industries - Manufacturing (%)
Most Common Industries - Wholesale trade (%)
Most Common Industries - Retail trade (%)
Most Common Industries - Transportation and warehousing, and utilities (%)
Most Common Industries - Transportation and warehousing (%)
Most Common Industries - Utilities (%)
Most Common Industries - Information (%)
Most Common Industries - Finance and insurance, and real estate and rental and leasing (%)
Most Common Industries - Finance and insurance (%)
Most Common Industries - Real estate and rental and leasing (%)
Most Common Industries - Professional, scientific, and management, and administrative and waste management services (%)
Most Common Industries - Professional, scientific, and technical services (%)
Most Common Industries - Management of companies and enterprises (%)
Most Common Industries - Administrative and support and waste management services (%)
Most Common Industries - Educational services, and health care and social assistance (%)
Most Common Industries - Educational services (%)
Most Common Industries - Health care and social assistance (%)
Most Common Industries - Arts, entertainment, and recreation, and accommodation and food services (%)
Most Common Industries - Arts, entertainment, and recreation (%)
Most Common Industries - Accommodation and food services (%)
Most Common Industries - Other services, except public administration (%)
Most Common Industries - Public administration (%)
Occupation diversity
Most Common Occupations - Management, business, science, and arts occupations (%)
Most Common Occupations - Management, business, and financial occupations (%)
Most Common Occupations - Management occupations (%)
Most Common Occupations - Business and financial operations occupations (%)
Most Common Occupations - Computer, engineering, and science occupations (%)
Most Common Occupations - Computer and mathematical occupations (%)
Most Common Occupations - Architecture and engineering occupations (%)
Most Common Occupations - Life, physical, and social science occupations (%)
Most Common Occupations - Education, legal, community service, arts, and media occupations (%)
Most Common Occupations - Community and social service occupations (%)
Most Common Occupations - Legal occupations (%)
Most Common Occupations - Education, training, and library occupations (%)
Most Common Occupations - Arts, design, entertainment, sports, and media occupations (%)
Most Common Occupations - Healthcare practitioners and technical occupations (%)
Most Common Occupations - Health diagnosing and treating practitioners and other technical occupations (%)
Most Common Occupations - Health technologists and technicians (%)
Most Common Occupations - Service occupations (%)
Most Common Occupations - Healthcare support occupations (%)
Most Common Occupations - Protective service occupations (%)
Most Common Occupations - Fire fighting and prevention, and other protective service workers including supervisors (%)
Most Common Occupations - Law enforcement workers including supervisors (%)
Most Common Occupations - Food preparation and serving related occupations (%)
Most Common Occupations - Building and grounds cleaning and maintenance occupations (%)
Most Common Occupations - Personal care and service occupations (%)
Most Common Occupations - Sales and office occupations (%)
Most Common Occupations - Sales and related occupations (%)
Most Common Occupations - Office and administrative support occupations (%)
Most Common Occupations - Natural resources, construction, and maintenance occupations (%)
Most Common Occupations - Farming, fishing, and forestry occupations (%)
Most Common Occupations - Construction and extraction occupations (%)
Most Common Occupations - Installation, maintenance, and repair occupations (%)
Most Common Occupations - Production, transportation, and material moving occupations (%)
Most Common Occupations - Production occupations (%)
Most Common Occupations - Transportation occupations (%)
Most Common Occupations - Material moving occupations (%)
People in Group quarters - Institutionalized population (%)
People in Group quarters - Correctional institutions (%)
People in Group quarters - Federal prisons and detention centers (%)
People in Group quarters - Halfway houses (%)
People in Group quarters - Local jails and other confinement facilities (including police lockups) (%)
People in Group quarters - Military disciplinary barracks (%)
People in Group quarters - State prisons (%)
People in Group quarters - Other types of correctional institutions (%)
People in Group quarters - Nursing homes (%)
People in Group quarters - Hospitals/wards, hospices, and schools for the handicapped (%)
People in Group quarters - Hospitals/wards and hospices for chronically ill (%)
People in Group quarters - Hospices or homes for chronically ill (%)
People in Group quarters - Military hospitals or wards for chronically ill (%)
People in Group quarters - Other hospitals or wards for chronically ill (%)
People in Group quarters - Hospitals or wards for drug/alcohol abuse (%)
People in Group quarters - Mental (Psychiatric) hospitals or wards (%)
People in Group quarters - Schools, hospitals, or wards for the mentally retarded (%)
People in Group quarters - Schools, hospitals, or wards for the physically handicapped (%)
People in Group quarters - Institutions for the deaf (%)
People in Group quarters - Institutions for the blind (%)
People in Group quarters - Orthopedic wards and institutions for the physically handicapped (%)
People in Group quarters - Wards in general hospitals for patients who have no usual home elsewhere (%)
People in Group quarters - Wards in military hospitals for patients who have no usual home elsewhere (%)
People in Group quarters - Juvenile institutions (%)
People in Group quarters - Long-term care (%)
People in Group quarters - Homes for abused, dependent, and neglected children (%)
People in Group quarters - Residential treatment centers for emotionally disturbed children (%)
People in Group quarters - Training schools for juvenile delinquents (%)
People in Group quarters - Short-term care, detention or diagnostic centers for delinquent children (%)
People in Group quarters - Type of juvenile institution unknown (%)
People in Group quarters - Noninstitutionalized population (%)
People in Group quarters - College dormitories (includes college quarters off campus) (%)
People in Group quarters - Military quarters (%)
People in Group quarters - On base (%)
People in Group quarters - Barracks, unaccompanied personnel housing (UPH), (Enlisted/Officer), ;and similar group living quarters for military personnel (%)
People in Group quarters - Transient quarters for temporary residents (%)
People in Group quarters - Military ships (%)
People in Group quarters - Group homes (%)
People in Group quarters - Homes or halfway houses for drug/alcohol abuse (%)
People in Group quarters - Homes for the mentally ill (%)
People in Group quarters - Homes for the mentally retarded (%)
People in Group quarters - Homes for the physically handicapped (%)
People in Group quarters - Other group homes (%)
People in Group quarters - Religious group quarters (%)
People in Group quarters - Dormitories (%)
People in Group quarters - Agriculture workers' dormitories on farms (%)
People in Group quarters - Job Corps and vocational training facilities (%)
People in Group quarters - Other workers' dormitories (%)
People in Group quarters - Crews of maritime vessels (%)
People in Group quarters - Other nonhousehold living situations (%)
People in Group quarters - Other noninstitutional group quarters (%)
Residents speaking English at home (%)
Residents speaking English at home - Born in the United States (%)
Residents speaking English at home - Native, born elsewhere (%)
Residents speaking English at home - Foreign born (%)
Residents speaking Spanish at home (%)
Residents speaking Spanish at home - Born in the United States (%)
Residents speaking Spanish at home - Native, born elsewhere (%)
Residents speaking Spanish at home - Foreign born (%)
Residents speaking other language at home (%)
Residents speaking other language at home - Born in the United States (%)
Residents speaking other language at home - Native, born elsewhere (%)
Residents speaking other language at home - Foreign born (%)
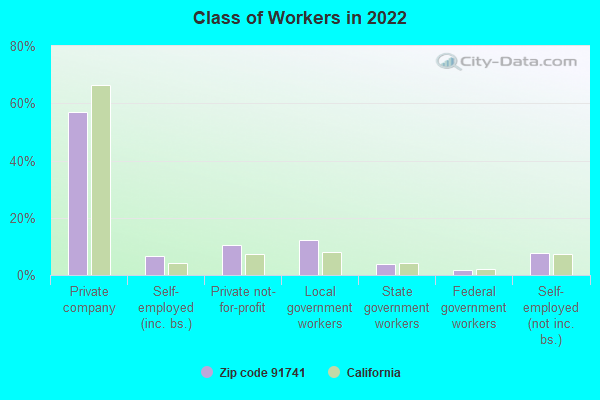
Class of Workers - Employee of private company (%)
Class of Workers - Self-employed in own incorporated business (%)
Class of Workers - Private not-for-profit wage and salary workers (%)
Class of Workers - Local government workers (%)
Class of Workers - State government workers (%)
Class of Workers - Federal government workers (%)
Class of Workers - Self-employed workers in own not incorporated business and Unpaid family workers (%)
House heating fuel used in houses and condos - Utility gas (%)
House heating fuel used in houses and condos - Bottled, tank, or LP gas (%)
House heating fuel used in houses and condos - Electricity (%)
House heating fuel used in houses and condos - Fuel oil, kerosene, etc. (%)
House heating fuel used in houses and condos - Coal or coke (%)
House heating fuel used in houses and condos - Wood (%)
House heating fuel used in houses and condos - Solar energy (%)
House heating fuel used in houses and condos - Other fuel (%)
House heating fuel used in houses and condos - No fuel used (%)
House heating fuel used in apartments - Utility gas (%)
House heating fuel used in apartments - Bottled, tank, or LP gas (%)
House heating fuel used in apartments - Electricity (%)
House heating fuel used in apartments - Fuel oil, kerosene, etc. (%)
House heating fuel used in apartments - Coal or coke (%)
House heating fuel used in apartments - Wood (%)
House heating fuel used in apartments - Solar energy (%)
House heating fuel used in apartments - Other fuel (%)
House heating fuel used in apartments - No fuel used (%)
Armed forces status - In Armed Forces (%)
Armed forces status - Civilian (%)
Armed forces status - Civilian - Veteran (%)
Armed forces status - Civilian - Nonveteran (%)
Fatal accidents locations in years 2005-2021
Fatal accidents locations in 2005
Fatal accidents locations in 2006
Fatal accidents locations in 2007
Fatal accidents locations in 2008
Fatal accidents locations in 2009
Fatal accidents locations in 2010
Fatal accidents locations in 2011
Fatal accidents locations in 2012
Fatal accidents locations in 2013
Fatal accidents locations in 2014
Fatal accidents locations in 2015
Fatal accidents locations in 2016
Fatal accidents locations in 2017
Fatal accidents locations in 2018
Fatal accidents locations in 2019
Fatal accidents locations in 2020
Fatal accidents locations in 2021
Alcohol use - People drinking some alcohol every month (%)
Alcohol use - People not drinking at all (%)
Alcohol use - Average days/month drinking alcohol
Alcohol use - Average drinks/week
Alcohol use - Average days/year people drink much
Audiometry - Average condition of hearing (%)
Audiometry - People that can hear a whisper from across a quiet room (%)
Audiometry - People that can hear normal voice from across a quiet room (%)
Audiometry - Ears ringing, roaring, buzzing (%)
Audiometry - Had a job exposure to loud noise (%)
Audiometry - Had off-work exposure to loud noise (%)
Blood Pressure & Cholesterol - Has high blood pressure (%)
Blood Pressure & Cholesterol - Checking blood pressure at home (%)
Blood Pressure & Cholesterol - Frequently checking blood cholesterol (%)
Blood Pressure & Cholesterol - Has high cholesterol level (%)
Consumer Behavior - Money monthly spent on food at supermarket/grocery store
Consumer Behavior - Money monthly spent on food at other stores
Consumer Behavior - Money monthly spent on eating out
Consumer Behavior - Money monthly spent on carryout/delivered foods
Consumer Behavior - Income spent on food at supermarket/grocery store (%)
Consumer Behavior - Income spent on food at other stores (%)
Consumer Behavior - Income spent on eating out (%)
Consumer Behavior - Income spent on carryout/delivered foods (%)
Current Health Status - General health condition (%)
Current Health Status - Blood donors (%)
Current Health Status - Has blood ever tested for HIV virus (%)
Current Health Status - Left-handed people (%)
Dermatology - People using sunscreen (%)
Diabetes - Diabetics (%)
Diabetes - Had a blood test for high blood sugar (%)
Diabetes - People taking insulin (%)
Diet Behavior & Nutrition - Diet health (%)
Diet Behavior & Nutrition - Milk product consumption (# of products/month)
Diet Behavior & Nutrition - Meals not home prepared (#/week)
Diet Behavior & Nutrition - Meals from fast food or pizza place (#/week)
Diet Behavior & Nutrition - Ready-to-eat foods (#/month)
Diet Behavior & Nutrition - Frozen meals/pizza (#/month)
Drug Use - People that ever used marijuana or hashish (%)
Drug Use - Ever used hard drugs (%)
Drug Use - Ever used any form of cocaine (%)
Drug Use - Ever used heroin (%)
Drug Use - Ever used methamphetamine (%)
Health Insurance - People covered by health insurance (%)
Kidney Conditions-Urology - Avg. # of times urinating at night
Medical Conditions - People with asthma (%)
Medical Conditions - People with anemia (%)
Medical Conditions - People with psoriasis (%)
Medical Conditions - People with overweight (%)
Medical Conditions - Elderly people having difficulties in thinking or remembering (%)
Medical Conditions - People who ever received blood transfusion (%)
Medical Conditions - People having trouble seeing even with glass/contacts (%)
Medical Conditions - People with arthritis (%)
Medical Conditions - People with gout (%)
Medical Conditions - People with congestive heart failure (%)
Medical Conditions - People with coronary heart disease (%)
Medical Conditions - People with angina pectoris (%)
Medical Conditions - People who ever had heart attack (%)
Medical Conditions - People who ever had stroke (%)
Medical Conditions - People with emphysema (%)
Medical Conditions - People with thyroid problem (%)
Medical Conditions - People with chronic bronchitis (%)
Medical Conditions - People with any liver condition (%)
Medical Conditions - People who ever had cancer or malignancy (%)
Mental Health - People who have little interest in doing things (%)
Mental Health - People feeling down, depressed, or hopeless (%)
Mental Health - People who have trouble sleeping or sleeping too much (%)
Mental Health - People feeling tired or having little energy (%)
Mental Health - People with poor appetite or overeating (%)
Mental Health - People feeling bad about themself (%)
Mental Health - People who have trouble concentrating on things (%)
Mental Health - People moving or speaking slowly or too fast (%)
Mental Health - People having thoughts they would be better off dead (%)
Oral Health - Average years since last visit a dentist
Oral Health - People embarrassed because of mouth (%)
Oral Health - People with gum disease (%)
Oral Health - General health of teeth and gums (%)
Oral Health - Average days a week using dental floss/device
Oral Health - Average days a week using mouthwash for dental problem
Oral Health - Average number of teeth
Pesticide Use - Households using pesticides to control insects (%)
Pesticide Use - Households using pesticides to kill weeds (%)
Physical Activity - People doing vigorous-intensity work activities (%)
Physical Activity - People doing moderate-intensity work activities (%)
Physical Activity - People walking or bicycling (%)
Physical Activity - People doing vigorous-intensity recreational activities (%)
Physical Activity - People doing moderate-intensity recreational activities (%)
Physical Activity - Average hours a day doing sedentary activities
Physical Activity - Average hours a day watching TV or videos
Physical Activity - Average hours a day using computer
Physical Functioning - People having limitations keeping them from working (%)
Physical Functioning - People limited in amount of work they can do (%)
Physical Functioning - People that need special equipment to walk (%)
Physical Functioning - People experiencing confusion/memory problems (%)
Physical Functioning - People requiring special healthcare equipment (%)
Prescription Medications - Average number of prescription medicines taking
Preventive Aspirin Use - Adults 40+ taking low-dose aspirin (%)
Reproductive Health - Vaginal deliveries (%)
Reproductive Health - Cesarean deliveries (%)
Reproductive Health - Deliveries resulted in a live birth (%)
Reproductive Health - Pregnancies resulted in a delivery (%)
Reproductive Health - Women breastfeeding newborns (%)
Reproductive Health - Women that had a hysterectomy (%)
Reproductive Health - Women that had both ovaries removed (%)
Reproductive Health - Women that have ever taken birth control pills (%)
Reproductive Health - Women taking birth control pills (%)
Reproductive Health - Women that have ever used Depo-Provera or injectables (%)
Reproductive Health - Women that have ever used female hormones (%)
Sexual Behavior - People 18+ that ever had sex (vaginal, anal, or oral) (%)
Sexual Behavior - Males 18+ that ever had vaginal sex with a woman (%)
Sexual Behavior - Males 18+ that ever performed oral sex on a woman (%)
Sexual Behavior - Males 18+ that ever had anal sex with a woman (%)
Sexual Behavior - Males 18+ that ever had any sex with a man (%)
Sexual Behavior - Females 18+ that ever had vaginal sex with a man (%)
Sexual Behavior - Females 18+ that ever performed oral sex on a man (%)
Sexual Behavior - Females 18+ that ever had anal sex with a man (%)
Sexual Behavior - Females 18+ that ever had any kind of sex with a woman (%)
Sexual Behavior - Average age people first had sex
Sexual Behavior - Average number of female sex partners in lifetime (males 18+)
Sexual Behavior - Average number of female vaginal sex partners in lifetime (males 18+)
Sexual Behavior - Average age people first performed oral sex on a woman (18+)
Sexual Behavior - Average number of woman performed oral sex on in lifetime (18+)
Sexual Behavior - Average number of male sex partners in lifetime (males 18+)
Sexual Behavior - Average number of male anal sex partners in lifetime (males 18+)
Sexual Behavior - Average age people first performed oral sex on a man (18+)
Sexual Behavior - Average number of male oral sex partners in lifetime (18+)
Sexual Behavior - People using protection when performing oral sex (%)
Sexual Behavior - Average number of times people have vaginal or anal sex a year
Sexual Behavior - People having sex without condom (%)
Sexual Behavior - Average number of male sex partners in lifetime (females 18+)
Sexual Behavior - Average number of male vaginal sex partners in lifetime (females 18+)
Sexual Behavior - Average number of female sex partners in lifetime (females 18+)
Sexual Behavior - Circumcised males 18+ (%)
Sleep Disorders - Average hours sleeping at night
Sleep Disorders - People that has trouble sleeping (%)
Smoking-Cigarette Use - People smoking cigarettes (%)
Taste & Smell - People 40+ having problems with smell (%)
Taste & Smell - People 40+ having problems with taste (%)
Taste & Smell - People 40+ that ever had wisdom teeth removed (%)
Taste & Smell - People 40+ that ever had tonsils teeth removed (%)
Taste & Smell - People 40+ that ever had a loss of consciousness because of a head injury (%)
Taste & Smell - People 40+ that ever had a broken nose or other serious injury to face or skull (%)
Taste & Smell - People 40+ that ever had two or more sinus infections (%)
Weight - Average height (inches)
Weight - Average weight (pounds)
Weight - Average BMI
Weight - People that are obese (%)
Weight - People that ever were obese (%)
Weight - People trying to lose weight (%)
100%
urban population.
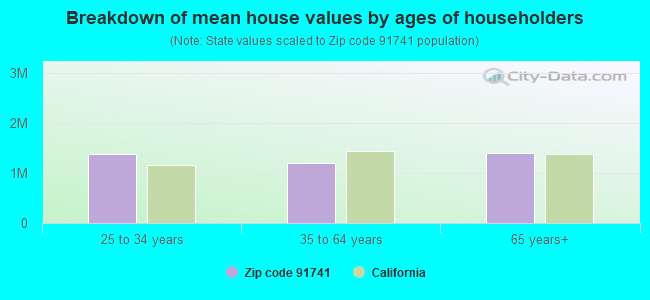
Estimated median house/condo value in 2022: $950,226
91741:
$950,226California:
$715,900
According to our research of California and other state lists, there were 18 registered sex offenders living in 91741 zip code as of April 27, 2024 . The ratio of all residents to sex offenders in zip code 91741 is 1,453 to 1.The ratio of registered sex offenders to all residents in this zip code is lower than the state average.
Median resident age: This zip code:
43.6 yearsCalifornia median age:
37.9 years
Average household size: This zip code:
2.9 peopleCalifornia:
2.8 people
Averages for the 2020 tax year for zip code 91741, filed in 2021:
Average Adjusted Gross Income (AGI) in 2020: $117,054 (Individual Income Tax Returns) Here:
$117,054State:
$95,910
Salary/wage: $91,092 (reported on 77.5% of returns )Here:
$91,092State:
$77,331
(% of AGI for various income ranges: 1168.4% for AGIs below $25k , 3841.0% for AGIs $25k-50k , 7006.0% for AGIs $50k-75k , 10286.8% for AGIs $75k-100k , 20996.6% for AGIs $100k-200k , 79407.7% for AGIs over 200k ) Taxable interest for individuals: $2,083 (reported on 49.5% of returns )This zip code:
$2,083California:
$2,294
(% of AGI for various income ranges: 35.2% for AGIs below $25k , 43.5% for AGIs $25k-50k , 88.9% for AGIs $50k-75k , 106.4% for AGIs $75k-100k , 223.9% for AGIs $100k-200k , 1478.3% for AGIs over 200k ) Ordinary dividends: $6,610 (reported on 27.8% of returns )(% of AGI for various income ranges: 42.3% for AGIs below $25k , 98.2% for AGIs $25k-50k , 139.9% for AGIs $50k-75k , 181.4% for AGIs $75k-100k , 375.7% for AGIs $100k-200k , 2783.8% for AGIs over 200k ) Net capital gain/loss in AGI: +$25,297 (reported on 27.1% of returns )Here:
+$25,297State:
+$49,306
(% of AGI for various income ranges: 21.0% for AGIs below $25k , 71.1% for AGIs $25k-50k , 143.6% for AGIs $50k-75k , 177.1% for AGIs $75k-100k , 593.4% for AGIs $100k-200k , 15856.0% for AGIs over 200k ) Profit/loss from business: +$16,080 (reported on 19.4% of returns )Here:
+$16,080State:
+$15,671
(% of AGI for various income ranges: 179.2% for AGIs below $25k , 289.3% for AGIs $25k-50k , 264.3% for AGIs $50k-75k , 428.5% for AGIs $75k-100k , 698.4% for AGIs $100k-200k , 3459.8% for AGIs over 200k ) Taxable individual retirement arrangement distribution: $26,533 (reported on 10.3% of returns )91741:
$26,533California:
$23,505
(% of AGI for various income ranges: 66.1% for AGIs below $25k , 147.2% for AGIs $25k-50k , 293.1% for AGIs $50k-75k , 502.8% for AGIs $75k-100k , 832.3% for AGIs $100k-200k , 2727.1% for AGIs over 200k ) Self-employed (Keogh) retirement plans: $26,158 (reported on 0.9% of returns )91741:
$26,158California:
$30,163
(% of AGI for various income ranges: 15.4% for AGIs $25k-50k , 41.4% for AGIs $100k-200k , 481.7% for AGIs over 200k ) Total itemized deductions: $37,541 (reported on 26.8% of returns )Here:
$37,541State:
$39,517
(% of AGI for various income ranges: 215.9% for AGIs below $25k , 366.0% for AGIs $25k-50k , 876.7% for AGIs $50k-75k , 1649.5% for AGIs $75k-100k , 3306.6% for AGIs $100k-200k , 10725.2% for AGIs over 200k ) Charity contributions: $9,530 (reported on 23.5% of returns )(% of AGI for various income ranges: 7.9% for AGIs below $25k , 31.6% for AGIs $25k-50k , 101.5% for AGIs $50k-75k , 224.0% for AGIs $75k-100k , 563.8% for AGIs $100k-200k , 3635.4% for AGIs over 200k ) Taxes paid: $9,177 (reported on 26.8% of returns )(% of AGI for various income ranges: 37.1% for AGIs below $25k , 79.1% for AGIs $25k-50k , 233.6% for AGIs $50k-75k , 470.3% for AGIs $75k-100k , 935.5% for AGIs $100k-200k , 2180.4% for AGIs over 200k ) Earned income credit: $1,550 (reported on 8.2% of returns )(% of AGI for various income ranges: 48.6% for AGIs below $25k , 48.8% for AGIs $25k-50k ) Percentage of individuals using paid preparers for their 2020 taxes: 92.4%(% for various income ranges: 91.3% for AGIs below $25k , 93.2% for AGIs $25k-50k , 92.1% for AGIs $50k-75k , 92.5% for AGIs $75k-100k , 92.0% for AGIs $100k-200k , 94.4% for AGIs over 200k )
Averages for the 2012 tax year for zip code 91741, filed in 2013:
Average Adjusted Gross Income (AGI) in 2012: $87,972 (Individual Income Tax Returns) Here:
$87,972State:
$72,726
Salary/wage: $72,084 (reported on 79.3% of returns )Here:
$72,084State:
$59,079
(% of AGI for various income ranges: 69.9% for AGIs below $25k , 73.6% for AGIs $25k-50k , 70.0% for AGIs $50k-75k , 70.5% for AGIs $75k-100k , 75.0% for AGIs $100k-200k , 51.2% for AGIs over 200k ) Taxable interest for individuals: $2,409 (reported on 49.4% of returns )This zip code:
$2,409California:
$2,146
(% of AGI for various income ranges: 1.8% for AGIs below $25k , 0.9% for AGIs $25k-50k , 1.0% for AGIs $50k-75k , 0.9% for AGIs $75k-100k , 0.8% for AGIs $100k-200k , 2.1% for AGIs over 200k ) Ordinary dividends: $9,477 (reported on 26.5% of returns )(% of AGI for various income ranges: 2.1% for AGIs below $25k , 1.2% for AGIs $25k-50k , 1.7% for AGIs $50k-75k , 1.5% for AGIs $75k-100k , 1.2% for AGIs $100k-200k , 5.3% for AGIs over 200k ) Net capital gain/loss in AGI: +$14,206 (reported on 21.9% of returns )Here:
+$14,206State:
+$30,460
(% of AGI for various income ranges: 0.4% for AGIs $50k-75k , 0.2% for AGIs $75k-100k , 0.9% for AGIs $100k-200k , 8.7% for AGIs over 200k ) Profit/loss from business: +$19,396 (reported on 18.8% of returns )Here:
+$19,396State:
+$17,064
(% of AGI for various income ranges: 10.6% for AGIs below $25k , 7.2% for AGIs $25k-50k , 4.4% for AGIs $50k-75k , 4.2% for AGIs $75k-100k , 3.3% for AGIs $100k-200k , 3.5% for AGIs over 200k ) Taxable individual retirement arrangement distribution: $20,060 (reported on 11.7% of returns )91741:
$20,060California:
$19,557
(% of AGI for various income ranges: 4.1% for AGIs below $25k , 3.0% for AGIs $25k-50k , 3.3% for AGIs $50k-75k , 3.6% for AGIs $75k-100k , 2.9% for AGIs $100k-200k , 1.8% for AGIs over 200k ) Self-employment retirement plans: $23,530 (reported on 0.8% of returns )91741:
$23,530California:
$24,530
(% of AGI for various income ranges: 0.3% for AGIs $50k-75k , 0.2% for AGIs $100k-200k , 0.4% for AGIs over 200k ) Total itemized deductions: $35,624 (24% of AGI, reported on 49.5% of returns )Here:
$35,624State:
$34,004
Here:
24.3% of AGIState:
22.7% of AGI
(% of AGI for various income ranges: 15.0% for AGIs below $25k , 16.5% for AGIs $25k-50k , 19.7% for AGIs $50k-75k , 21.3% for AGIs $75k-100k , 22.8% for AGIs $100k-200k , 18.6% for AGIs over 200k ) Charity contributions: $5,078 (reported on 44.3% of returns )(% of AGI for various income ranges: 0.9% for AGIs below $25k , 1.5% for AGIs $25k-50k , 2.4% for AGIs $50k-75k , 2.3% for AGIs $75k-100k , 2.7% for AGIs $100k-200k , 3.0% for AGIs over 200k ) Taxes paid: $14,668 (reported on 49.4% of returns )91741:
$14,668State:
$14,448
(% of AGI for various income ranges: 3.2% for AGIs below $25k , 3.7% for AGIs $25k-50k , 5.5% for AGIs $50k-75k , 6.8% for AGIs $75k-100k , 8.5% for AGIs $100k-200k , 10.5% for AGIs over 200k ) Earned income credit: $1,842 (reported on 9.8% of returns )(% of AGI for various income ranges: 3.8% for AGIs below $25k , 0.7% for AGIs $25k-50k ) Percentage of individuals using paid preparers for their 2012 taxes: 66.7%(% for various income ranges: 57.0% for AGIs below $25k , 63.2% for AGIs $25k-50k , 70.9% for AGIs $50k-75k , 71.9% for AGIs $75k-100k , 74.4% for AGIs $100k-200k , 80.5% for AGIs over 200k )
Averages for the 2004 tax year for zip code 91741, filed in 2005:
Average Adjusted Gross Income (AGI) in 2004: $78,584 (Individual Income Tax Returns) Here:
$78,584State:
$58,600
Salary/wage: $65,185 (reported on 80.3% of returns )Here:
$65,185State:
$49,455
(% of AGI for various income ranges: 67.4% for AGIs $10k-25k , 74.3% for AGIs $25k-50k , 73.3% for AGIs $50k-75k , 77.1% for AGIs $75k-100k , 60.8% for AGIs over 100k ) Taxable interest for individuals: $2,645 (reported on 58.8% of returns )This zip code:
$2,645California:
$2,365
(% of AGI for various income ranges: 3.5% for AGIs $10k-25k , 2.0% for AGIs $25k-50k , 1.8% for AGIs $50k-75k , 1.3% for AGIs $75k-100k , 1.9% for AGIs over 100k ) Taxable dividends: $5,572 (reported on 32.3% of returns )(% of AGI for various income ranges: 2.6% for AGIs $10k-25k , 1.4% for AGIs $25k-50k , 1.4% for AGIs $50k-75k , 1.1% for AGIs $75k-100k , 2.7% for AGIs over 100k ) Net capital gain/loss: +$14,468 (reported on 26.4% of returns )Here:
+$14,468State:
+$23,418
(% of AGI for various income ranges: -1.0% for AGIs $10k-25k , 0.2% for AGIs $25k-50k , 0.6% for AGIs $50k-75k , 1.5% for AGIs $75k-100k , 7.1% for AGIs over 100k ) Profit/loss from business: +$19,811 (reported on 18.7% of returns )Here:
+$19,811State:
+$16,826
(% of AGI for various income ranges: 7.9% for AGIs $10k-25k , 5.7% for AGIs $25k-50k , 5.6% for AGIs $50k-75k , 4.6% for AGIs $75k-100k , 4.1% for AGIs over 100k ) Profit/loss from farming: +$73,857 (reported on 0.2% of returns )
Here : State :
IRA payment deduction: $3,387 (reported on 3.5% of returns )91741:
$3,387California:
$3,192
(% of AGI for various income ranges: 0.2% for AGIs $10k-25k , 0.3% for AGIs $25k-50k , 0.2% for AGIs $50k-75k , 0.2% for AGIs $75k-100k , 0.1% for AGIs over 100k ) Self-employed pension: $17,328 (reported on 1.6% of returns )Here:
$17,328California:
$17,688
(% of AGI for various income ranges: 0.1% for AGIs $25k-50k , 0.2% for AGIs $50k-75k , 0.3% for AGIs $75k-100k , 0.4% for AGIs over 100k ) Total itemized deductions: $31,040 (24% of AGI, reported on 51.9% of returns )Here:
$31,040State:
$28,113
Here:
23.8% of AGIState:
25.3% of AGI
(% of AGI for various income ranges: 17.5% for AGIs $10k-25k , 19.2% for AGIs $25k-50k , 24.5% for AGIs $50k-75k , 25.3% for AGIs $75k-100k , 18.9% for AGIs over 100k ) Charity contributions deductions: $4,542 (3% of AGI, reported on 48.3% of returns )Here:
3.4% of AGIState:
3.3% of AGI
(% of AGI for various income ranges: 1.7% for AGIs $10k-25k , 2.1% for AGIs $25k-50k , 2.8% for AGIs $50k-75k , 3.2% for AGIs $75k-100k , 2.8% for AGIs over 100k ) Total tax: $13,937 (reported on 82.0% of returns )91741:
$13,937State:
$10,761
(% of AGI for various income ranges: 5.0% for AGIs $10k-25k , 7.3% for AGIs $25k-50k , 8.6% for AGIs $50k-75k , 9.2% for AGIs $75k-100k , 18.1% for AGIs over 100k ) Earned income credit: $1,408 (reported on 7.3% of returns )Percentage of individuals using paid preparers for their 2004 taxes: 69.5%(% for various income ranges: 57.0% for AGIs below $10k , 64.4% for AGIs $10k-25k , 67.3% for AGIs $25k-50k , 74.7% for AGIs $50k-75k , 73.8% for AGIs $75k-100k , 80.3% for AGIs over 100k )
Estimated median household income in 2022: This zip code:
$116,800California:
$91,551
Nearest zip codes: 91740 ,
91773 ,
91750 ,
91724 ,
91723 ,
91722 .
Glendora Zip Code Map
Percentage of family households: This zip code:
49.2%California:
46.8%
Percentage of households with unmarried partners: This zip code:
4.2%California:
48.1%
Likely homosexual households (counted as self-reported same-sex unmarried-partner households)
Lesbian couples: 0.2% of all households Gay men: 0.0% of all households
Household received Food Stamps/SNAP in the past 12 months: 471Household did not receive Food Stamps/SNAP in the past 12 months: 8,244
Women who had a birth in the past 12 months: 194 (155 now married , 38 unmarried) Women who did not have a birth in the past 12 months: 5,496 (2,529 now married , 2,952 unmarried)
Housing units in zip code 91741 with a mortgage: 4,196 (618
second mortgage , 116
home equity loan , 403
both second mortgage and home equity loan )
Houses without a mortgage: 49
Median monthly owner costs for units with a mortgage: $3,307
Median monthly owner costs for units without a mortgage: $889
Residents with income below the poverty level in 2022:
This zip code:
5.4%Whole state:
12.2%
Residents with income below 50% of the poverty level in 2022:
This zip code:
3.3%Whole state:
6.2%
Median number of rooms in houses and condos: Median number of rooms in apartments: Notable locations in this zip code not listed on our city pages
Click to draw/clear zip code borders Notable locations in zip code 91741: (A) , Dalton Forest Service Facility (B) , Bluebird Estates (C) , Dalton Station (D) , Camp Aventura (E) , Little Dalton Picnic Area (F) , Glendora Country Club (G) , Glendora Public Library (H) , Glendora City Hall (I) , West Gymnasium (J) , Hayden Library (K) , Hayden Hall (L) , Haugh Performing Arts Center (M) , Handy Campus Center (N) , Los Angeles County Fire Department Station 151 (O) , Los Angeles County Fire Department Station 97 (P) , Los Angeles County Fire Department Station 86 (Q) . Display/hide their locations on the map
Shopping Center: (1) . Display/hide its location on the map
Churches in zip code 91741 include: (A) , Cornerstone Bible Church (B) , First Christian Church (C) , Glendora Alliance Church (D) , Grace Episcopal Church (E) , Hope Lutheran Church (F) , Loraine Avenue Baptist Church (G) , Saint Dorothy's Church (H) , United Methodist Church of Glendora (I) . Display/hide their locations on the map
Reservoir: (A) . Display/hide its location on the map
Parks in zip code 91741 include: (1) , George Manooshian Park (2) , Ole Hammer Park (3) , Willow Springs Park (4) . Display/hide their locations on the map
Year house built (houses)
0 2020 or later695 2010 to 2019391 2000 to 2009257 1990 to 1999776 1980 to 19891,186 1970 to 19791,901 1960 to 19692,770 1950 to 1959491 1940 to 1949694 1939 or earlier
Zip code 91741 household income distribution in 2022 179 Less than $10,000309 $10,000 to $14,999198 $15,000 to $19,999135 $20,000 to $24,99989 $25,000 to $29,999203 $30,000 to $34,999160 $35,000 to $39,999151 $40,000 to $44,999226 $45,000 to $49,999471 $50,000 to $59,999799 $60,000 to $74,999724 $75,000 to $99,999987 $100,000 to $124,999753 $125,000 to $149,9991,206 $150,000 to $199,9992,251 $200,000 or moreEstimate of home value of owner-occupied houses/condos in 2022 in zip code 91741 33 Less than $10,0007 $20,000 to $24,99923 $50,000 to $59,99921 $60,000 to $69,99996 $70,000 to $79,99916 $80,000 to $89,99910 $90,000 to $99,99948 $100,000 to $124,99948 $150,000 to $174,9997 $175,000 to $199,99912 $250,000 to $299,99928 $300,000 to $399,99962 $400,000 to $499,9991,609 $500,000 to $749,9992,548 $750,000 to $999,9991,506 $1,000,000 to $1,499,999445 $1,500,000 to $1,999,999321 $2,000,000 or moreRent paid by renters in 2022 in zip code 91741 17 Less than $1008 $150 to $19985 $250 to $2999 $550 to $59958 $800 to $89977 $1,000 to $1,249333 $1,250 to $1,499683 $1,500 to $1,999558 $2,000 to $2,499372 $2,500 to $2,99948 $3,000 to $3,49936 $3,500 or more223 No cash rent
Median gross rent in 2022: $2,089.
Median price asked for vacant for-sale houses and condos in 2022: $1,254,768.
Estimated median house (or condo) value in 2022 for: White Non-Hispanic householders: $962,134Black or African American householders: $919,404American Indian or Alaska Native householders: $582,464Asian householders: $928,860Some other race householders: $883,678Two or more races householders: $843,750Hispanic or Latino householders: $919,754Estimated median house or condo value in 2022: $950,226
91741:
$950,226California:
$715,900
Lower value quartile - upper value quartile: $755,117 - $1,219,591
Mean price in 2022: Detached houses: $1,187,417Here:
$1,187,417State:
$988,808
Townhouses or other attached units: $492,650Here:
$492,650State:
$838,546
In 2-unit structures: $1,541,938Here:
$1,541,938State:
$1,138,100
In 3-to-4-unit structures: $533,591Here:
$533,591State:
$824,253
In 5-or-more-unit structures: $1,602,208Here:
$1,602,208State:
$730,996
Mobile homes: $88,171Here:
$88,171State:
$184,506
Housing units in structures:
One, detached: 7,046One, attached: 840Two: 1303 or 4: 1605 to 9: 34310 to 19: 7620 to 49: 23550 or more: 216Mobile homes: 223Unemployment : 5.6%
Means of transportation to work in zip code 91741 64.5% 7,794 Drove a car alone10.8% 1,299 Carpooled0.3% 37 Bus or trolley bus0.8% 98 Streetcar or trolley car0.7% 86 Subway or elevated0.3% 41 Railroad0.3% 34 Motorcycle0.9% 109 Bicycle0.9% 108 Walked0.8% 99 Other means20.0% 2,417 Worked at homeTravel time to work (commute) in zip code 91741 168 Less than 5 minutes887 5 to 9 minutes902 10 to 14 minutes864 15 to 19 minutes1,182 20 to 24 minutes538 25 to 29 minutes1,525 30 to 34 minutes340 35 to 39 minutes594 40 to 44 minutes975 45 to 59 minutes1,202 60 to 89 minutes558 90 or more minutes
Neighborhoods in zip code 91741: Percentage of zip code residents living and working in this county: 87.1%
Household type by relationship:
Households: 25,835
Male householders: 4,338 (757 living alone ), Female householders: 4,521 (909 living alone )5,341 spouses (5,276 opposite-sex spouses ), 409 unmarried partners , (381 opposite-sex unmarried partners ), 8,273 children (7,971 natural , 203 adopted , 103 stepchildren ), 755 grandchildren , 159 brothers or sisters , 524 parents , 0 foster children , 545 other relatives , 752 non-relatives In group quarters: 173 (-1 institutionalized population )
Size of family households: 2,442 2-persons , 1,352 3-persons , 1,715 4-persons , 784 5-persons , 278 6-persons , 78 7-or-more-persons
Size of nonfamily households: 1,666 1-person , 389 2-persons , 87 3-persons , 16 4-persons , 5 7-or-more-persons
4,336 married couples with children. single-parent households (266 men , 311 women ).
74.7% of residents of 91741 zip code speak English at home. of residents speak Spanish at home (76% very well, 13% well, 11% not well, 1% not at all ).of residents speak other Indo-European language at home (79% very well, 17% well, 4% not well ).of residents speak Asian or Pacific Island language at home (62% very well, 27% well, 8% not well, 3% not at all ).of residents speak other language at home (65% very well, 19% well, 16% not well ).
Foreign born population: 4,305 (16.7%)
(71.9%
of them are naturalized citizens )
This zip code:
16.7%Whole state:
26.7%
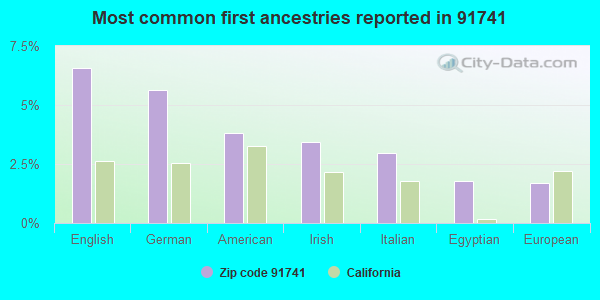
14% Honduras 10% Bhutan 9% Hong Kong 7% Malaysia 5% Costa Rica 4% Algeria 4% China, excluding Hong Kong and Taiwan 7% English 6% German 4% American 3% Irish 3% Italian 2% Egyptian 2% European
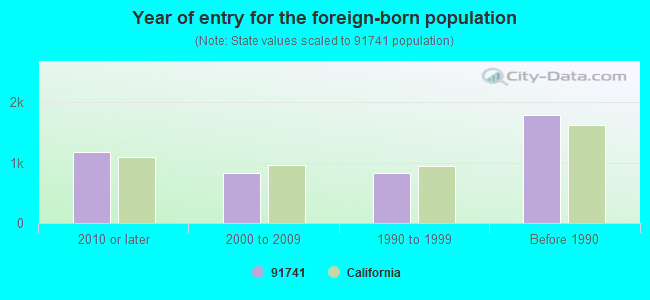
Year of entry for the foreign-born population
1,181 2010 or later 819 2000 to 2009 835 1990 to 1999 1,786 Before 1990
There are
164 Medical Specialists in Zip Code 91741 .
Facilities with environmental interests located in this zip code:
GLENDORA HIGH (1600 E. FOOTHILL BLVD. in GLENDORA, CA)
(National Center for Education Statistics) - STATE ID-1933597 Organizations: GLENDORA UNIFIED (SCHOOL DISTRICT)
GODDARD MIDDLE (859 E. SIERRA MADRE AVE. in GLENDORA, CA)
(National Center for Education Statistics) - STATE ID-6057731 Organizations: GLENDORA UNIFIED (SCHOOL DISTRICT)
LA FETRA ELEMENTARY (547 W. BENNETT AVE. in GLENDORA, CA)
(National Center for Education Statistics) - STATE ID-6013882 Organizations: GLENDORA UNIFIED (SCHOOL DISTRICT)
LYNTONE ENGINEERING (215 N GRAND AVE in GLENDORA, CA)
Small Quantity Generators, between 100 kg and 1000 kg of hazardous waste/month (Resource Conservation and Recovery Act (tracking hazardous waste)) - notification
GLENDORA CITY DUMP (NW CORNER OF SIERRA MADRE & SO in GLENDORA, CA)
CRITERIA AND HAZARDOUS AIR POLLUTANT INVENTORY (Inventory of air pollution sources) Business SIC classification: REFUSE SYSTEMSBusiness NAICS classification: SOLID WASTE LANDFILL.
Housing units lacking complete plumbing facilities: 1.7%
Housing units lacking complete kitchen facilities: 2.9%
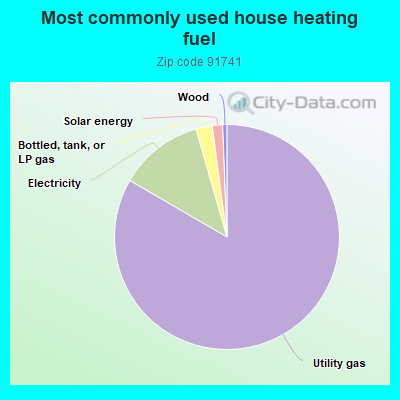
82.9% Utility gas 12.1% Electricity 2.3% Bottled, tank, or LP gas 1.5% Solar energy 0.6% Wood
Place of birth for U.S.-born residents:
This state: 17,448Northeast: 839Midwest: 1,233South: 738West: 950
62% of the 91741 zip code residents lived in the same house 5 years ago.
Out of people who lived in different houses, 78% lived in this county.
Out of people who lived in different counties, 50% lived in California.
90% of the 91741 zip code residents lived in the same house 1 year ago.
Out of people who lived in different houses, 58% moved from this county.
Out of people who lived in different houses, 24% moved from different county within same state.
Out of people who lived in different houses, 13% moved from different state.
Out of people who lived in different houses, 5% moved from abroad.
Private vs. public school enrollment:
Students in private schools in grades 1 to 8 (elementary and middle school): 473
Here:
18.8%California:
10.5%
Students in private schools in grades 9 to 12 (high school): 158
Here:
11.8%California:
8.5%
Students in private undergraduate colleges: 456
Here:
25.1%California:
15.9%
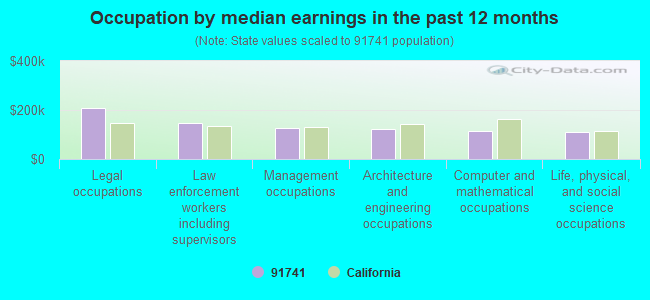
Occupation by median earnings in the past 12 months ($)
206,947 Legal occupations 148,831 Law enforcement workers including supervisors 128,268 Management occupations 122,569 Architecture and engineering occupations 116,236 Computer and mathematical occupations 110,301 Life, physical, and social science occupations
Companies with federal contracts located in this zip code (GLENDORA, CA):
ULTIMATE JUICE COMPANY (533 W FOOTHILL BLVD; small business) in 9 contracts in 2004
Contracts for Fruits and Vegetables by Defense Logistics AgencySigned by year: 2000: $0; 2001: $0; 2002: $0; 2003: $0; 2004: $710,981; 2005: $0; 2006: $0.
Biggest contracts: with Defense Logistics Agency for Fruits and Vegetables. Signed on 2004-02-07. Completion date: 2004-02-07.
, same as above. Signed on 2004-02-21. Completion date: 2004-02-21.
, same as above. Signed on 2004-02-21. Completion date: 2004-02-21.
, same as above. Signed on 2004-02-07. Completion date: 2004-02-07.
NTD ARCHITECTS (2025 E FINCL WAY STE 106; small business) employees , $26260597 revenue . Small Disadvantaged Business: $210,000 in 7 contracts from 2002 to 2003
Contracts for A&E Production Engineering Services (including Design and Control, and Building Programming) by Public Health ServiceSigned by year: 2000: $0; 2001: $0; 2002: $157,000; 2003: $53,000; 2004: $0; 2005: $0; 2006: $0.
Biggest contracts: with Public Health Service for A&E Production Engineering Services (including Design and Control, and Building Programming). Signed on 2002-08-15. Completion date: 2003-03-15.
, same as above. Signed on 2002-04-15. Completion date: 2002-04-15.
, same as above. Signed on 2003-06-15. Completion date: 2004-09-15.
, same as above. Signed on 2002-09-15. Completion date: 2003-08-15.
BEST REHABCARE SERVICES (345 W FOOTHILL BLVD, SUITE; small business)
$75,740 with Air Force for Other Medical Services. Signed on 2001-09-29. Completion date: 2002-09-24.
HOME GYM CENTRAL, INC (418 S VERMONT AVE; small business) in 2 contracts in 2005
$43,463 with Army for Athletic and Sporting Equipment. Signed on 2005-09-28. Completion date: 2005-10-31.
with Bureau of Prisoners/Federal Prison System for Motorcycles, Motor Scooters, and Bicycles. Signed on 2005-09-01. Completion date: 2005-09-01.
TALARIA ENTERPRISES (538 N WABASH AVE; small business)
$5,600 with Air Force for Structural Shapes, Nonferrous Base Metal. Taking place in MD. Signed on 2005-02-02. Completion date: 2005-04-08.
Top industries in this zip code by the number of employees in 2005:
Other Services (except Public Administration): Religious Organizations (250-499 employees: 1 establishment, 50-99 employees: 1 establishment, 20-49 employees: 6 establishments, 10-19 employees: 1 establishment, 5-9 employees: 5 establishments, 1-4 employees: 6 establishments)Health Care and Social Assistance: Offices of Physicians (except Mental Health Specialists) (20-49: 2, 10-19: 3, 5-9: 8, 1-4: 23)Administrative and Support and Waste Management and Remediation Services: Professional Employer Organizations (100-249: 1, 5-9: 1)Health Care and Social Assistance: Nursing Care Facilities (100-249: 1)Accommodation and Food Services: Full-Service Restaurants (20-49: 2, 10-19: 3, 5-9: 3, 1-4: 1)Health Care and Social Assistance: Offices of Dentists (20-49: 1, 10-19: 3, 5-9: 5, 1-4: 9)Construction: Plumbing, Heating, and Air-Conditioning Contractors (20-49: 1, 10-19: 4, 5-9: 2, 1-4: 12)Accommodation and Food Services: Limited-Service Restaurants (50-99: 1, 20-49: 1, 5-9: 1, 1-4: 2)Management of Companies and Enterprises: Corporate, Subsidiary, and Regional Managing Offices (50-99: 1, 20-49: 1, 5-9: 1)
People in group quarters in 2010:
29 people in nursing facilities/skilled-nursing facilities
14 people in group homes intended for adults
13 people in workers' group living quarters and job corps centers
7 people in residential treatment centers for adults
4 people in college/university student housing
People in group quarters in 2000:
108 people in nursing homes
56 people in other noninstitutional group quarters
45 people in homes for the mentally retarded
25 people in college dormitories (includes college quarters off campus)
21 people in religious group quarters
12 people in other nonhousehold living situations
4 people in homes for the physically handicapped
Fatal accident statistics in 2014:
Fatal accident count: 1Vehicles involved in fatal accidents: 1Fatal accidents caused by drunken drivers: 0Fatalities: 1Persons involved in fatal accidents: 1Pedestrians involved in fatal accidents: 1
Fatal accident statistics in 2011:
Fatal accident count: 2Vehicles involved in fatal accidents: 3Fatal accidents caused by drunken drivers: 0Fatalities: 3Persons involved in fatal accidents: 4Pedestrians involved in fatal accidents: 0
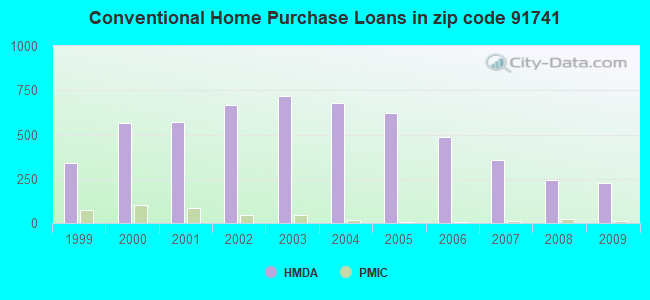
Home Mortgage Disclosure Act Aggregated Statistics For Year 2009(Based on 6 full and 10 partial tracts) A) FHA, FSA/RHS & VA B) Conventional C) Refinancings D) Home Improvement Loans F) Non-occupant Loans on G) Loans On Manufactured Number Average Value Number Average Value Number Average Value Number Average Value Number Average Value Number Average Value
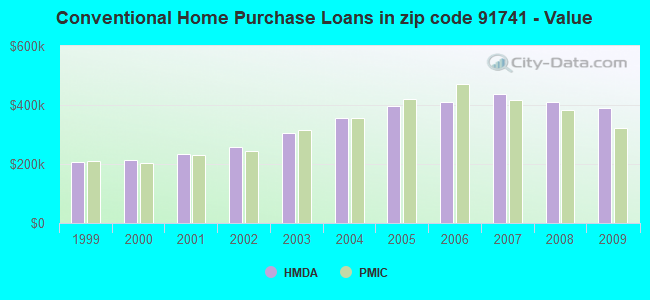
LOANS ORIGINATED 81 $369,780 228 $389,724 1,220 $341,119 72 $262,236 39 $254,038 3 $55,483 APPLICATIONS APPROVED, NOT ACCEPTED 7 $403,986 25 $319,901 110 $386,112 8 $139,066 10 $308,523 3 $54,033 APPLICATIONS DENIED 13 $454,408 33 $283,867 291 $412,289 27 $262,819 27 $288,266 3 $86,267 APPLICATIONS WITHDRAWN 15 $433,802 37 $425,374 186 $356,108 11 $294,862 8 $292,050 0 $0 FILES CLOSED FOR INCOMPLETENESS 4 $334,732 14 $317,530 42 $362,906 3 $379,187 3 $158,523 1 $25,880
Aggregated Statistics For Year 2008(Based on 6 full and 10 partial tracts) A) FHA, FSA/RHS & VA B) Conventional C) Refinancings D) Home Improvement Loans E) Loans on Dwellings For 5+ Families F) Non-occupant Loans on G) Loans On Manufactured Number Average Value Number Average Value Number Average Value Number Average Value Number Average Value Number Average Value Number Average Value
LOANS ORIGINATED 33 $431,407 245 $410,051 529 $357,948 67 $158,556 2 $3,379,300 42 $296,111 6 $109,570 APPLICATIONS APPROVED, NOT ACCEPTED 2 $302,700 53 $456,343 143 $386,530 11 $104,452 0 $0 5 $248,648 3 $76,387 APPLICATIONS DENIED 7 $532,697 70 $611,809 310 $431,593 34 $116,750 0 $0 8 $264,070 9 $48,931 APPLICATIONS WITHDRAWN 12 $329,562 43 $492,691 154 $424,350 16 $235,953 2 $1,402,160 5 $244,388 0 $0 FILES CLOSED FOR INCOMPLETENESS 2 $329,920 13 $395,799 49 $492,603 3 $143,693 0 $0 3 $301,990 0 $0
Aggregated Statistics For Year 2007(Based on 6 full and 10 partial tracts) A) FHA, FSA/RHS & VA B) Conventional C) Refinancings D) Home Improvement Loans E) Loans on Dwellings For 5+ Families F) Non-occupant Loans on G) Loans On Manufactured Number Average Value Number Average Value Number Average Value Number Average Value Number Average Value Number Average Value Number Average Value
LOANS ORIGINATED 3 $312,340 355 $436,318 811 $391,107 119 $254,067 10 $664,921 69 $383,577 3 $55,550 APPLICATIONS APPROVED, NOT ACCEPTED 0 $0 76 $370,412 204 $318,349 28 $120,704 0 $0 16 $473,369 11 $147,870 APPLICATIONS DENIED 0 $0 106 $451,471 439 $413,295 79 $181,910 2 $534,910 26 $312,504 6 $50,490 APPLICATIONS WITHDRAWN 2 $195,540 45 $462,741 231 $404,821 38 $279,724 1 $1,007,180 16 $345,609 0 $0 FILES CLOSED FOR INCOMPLETENESS 0 $0 23 $546,093 56 $388,994 6 $284,673 0 $0 3 $406,857 0 $0
Aggregated Statistics For Year 2006(Based on 6 full and 10 partial tracts) B) Conventional C) Refinancings D) Home Improvement Loans E) Loans on Dwellings For 5+ Families F) Non-occupant Loans on G) Loans On Manufactured Number Average Value Number Average Value Number Average Value Number Average Value Number Average Value Number Average Value
LOANS ORIGINATED 485 $409,000 1,083 $382,685 203 $189,450 6 $1,201,283 89 $350,451 6 $46,247 APPLICATIONS APPROVED, NOT ACCEPTED 85 $364,168 220 $367,946 23 $219,937 0 $0 11 $217,745 8 $41,396 APPLICATIONS DENIED 110 $419,870 455 $392,713 84 $175,722 0 $0 22 $356,352 2 $71,975 APPLICATIONS WITHDRAWN 65 $381,993 326 $378,585 37 $196,569 0 $0 13 $369,127 0 $0 FILES CLOSED FOR INCOMPLETENESS 25 $375,638 73 $363,219 8 $197,284 0 $0 5 $274,644 1 $532,790
Aggregated Statistics For Year 2005(Based on 6 full and 10 partial tracts) A) FHA, FSA/RHS & VA B) Conventional C) Refinancings D) Home Improvement Loans E) Loans on Dwellings For 5+ Families F) Non-occupant Loans on G) Loans On Manufactured Number Average Value Number Average Value Number Average Value Number Average Value Number Average Value Number Average Value Number Average Value
LOANS ORIGINATED 2 $161,740 623 $395,024 1,361 $356,066 254 $219,188 7 $1,229,697 133 $339,920 3 $201,797 APPLICATIONS APPROVED, NOT ACCEPTED 0 $0 100 $333,680 192 $357,821 23 $227,646 0 $0 32 $260,395 6 $53,595 APPLICATIONS DENIED 0 $0 121 $397,984 407 $407,294 115 $183,040 0 $0 30 $303,241 14 $69,934 APPLICATIONS WITHDRAWN 0 $0 74 $466,647 394 $332,543 81 $230,540 1 $793,520 24 $362,015 0 $0 FILES CLOSED FOR INCOMPLETENESS 0 $0 32 $351,300 106 $376,335 12 $83,244 0 $0 1 $600,000 2 $129,390
Aggregated Statistics For Year 2004(Based on 6 full and 10 partial tracts) A) FHA, FSA/RHS & VA B) Conventional C) Refinancings D) Home Improvement Loans E) Loans on Dwellings For 5+ Families F) Non-occupant Loans on G) Loans On Manufactured Number Average Value Number Average Value Number Average Value Number Average Value Number Average Value Number Average Value Number Average Value
LOANS ORIGINATED 2 $228,055 677 $357,192 1,697 $308,805 271 $182,068 6 $567,998 140 $251,482 3 $48,000 APPLICATIONS APPROVED, NOT ACCEPTED 0 $0 112 $388,517 267 $284,021 37 $153,333 0 $0 19 $249,601 3 $59,593 APPLICATIONS DENIED 0 $0 105 $395,892 410 $316,379 84 $159,709 0 $0 17 $294,076 6 $40,655 APPLICATIONS WITHDRAWN 2 $211,150 91 $391,148 399 $302,089 66 $147,193 0 $0 7 $156,929 2 $201,075 FILES CLOSED FOR INCOMPLETENESS 0 $0 9 $215,098 81 $322,931 19 $158,189 0 $0 5 $261,088 0 $0
Aggregated Statistics For Year 2003(Based on 6 full and 10 partial tracts) A) FHA, FSA/RHS & VA B) Conventional C) Refinancings D) Home Improvement Loans E) Loans on Dwellings For 5+ Families F) Non-occupant Loans on Number Average Value Number Average Value Number Average Value Number Average Value Number Average Value Number Average Value
LOANS ORIGINATED 17 $240,894 716 $305,111 3,846 $249,400 119 $63,425 10 $2,080,252 187 $211,953 APPLICATIONS APPROVED, NOT ACCEPTED 0 $0 87 $288,141 465 $262,097 26 $128,999 0 $0 29 $196,539 APPLICATIONS DENIED 1 $160,480 87 $274,774 580 $262,184 46 $70,246 0 $0 27 $211,591 APPLICATIONS WITHDRAWN 0 $0 115 $316,558 665 $257,173 18 $91,608 0 $0 20 $213,070 FILES CLOSED FOR INCOMPLETENESS 0 $0 18 $283,826 145 $279,883 2 $191,300 1 $287,600 10 $197,481
Aggregated Statistics For Year 2002(Based on 6 full and 10 partial tracts) A) FHA, FSA/RHS & VA B) Conventional C) Refinancings D) Home Improvement Loans E) Loans on Dwellings For 5+ Families F) Non-occupant Loans on Number Average Value Number Average Value Number Average Value Number Average Value Number Average Value Number Average Value
LOANS ORIGINATED 16 $221,506 669 $257,277 2,630 $239,529 73 $93,936 9 $613,942 106 $189,525 APPLICATIONS APPROVED, NOT ACCEPTED 2 $20,620 86 $271,873 335 $229,163 28 $48,757 0 $0 8 $155,029 APPLICATIONS DENIED 0 $0 82 $220,839 423 $253,419 41 $33,925 0 $0 16 $176,742 APPLICATIONS WITHDRAWN 1 $221,450 114 $275,074 399 $247,765 21 $74,125 0 $0 14 $184,526 FILES CLOSED FOR INCOMPLETENESS 0 $0 33 $280,319 140 $278,379 3 $20,347 0 $0 3 $258,083
Aggregated Statistics For Year 2001(Based on 6 full and 10 partial tracts) A) FHA, FSA/RHS & VA B) Conventional C) Refinancings D) Home Improvement Loans E) Loans on Dwellings For 5+ Families F) Non-occupant Loans on Number Average Value Number Average Value Number Average Value Number Average Value Number Average Value Number Average Value
LOANS ORIGINATED 44 $208,031 568 $233,628 1,810 $214,570 133 $46,195 5 $937,956 96 $184,625 APPLICATIONS APPROVED, NOT ACCEPTED 3 $213,780 76 $227,525 222 $220,487 27 $59,996 0 $0 4 $133,645 APPLICATIONS DENIED 5 $194,528 79 $169,754 406 $232,675 50 $48,174 1 $209,950 11 $293,640 APPLICATIONS WITHDRAWN 5 $184,600 83 $188,422 378 $203,780 27 $72,423 0 $0 21 $240,239 FILES CLOSED FOR INCOMPLETENESS 0 $0 18 $244,639 130 $230,890 6 $83,782 0 $0 3 $160,507
Aggregated Statistics For Year 2000(Based on 6 full and 10 partial tracts) A) FHA, FSA/RHS & VA B) Conventional C) Refinancings D) Home Improvement Loans E) Loans on Dwellings For 5+ Families F) Non-occupant Loans on Number Average Value Number Average Value Number Average Value Number Average Value Number Average Value Number Average Value
LOANS ORIGINATED 31 $188,512 566 $215,214 402 $166,597 162 $46,684 5 $362,354 40 $145,757 APPLICATIONS APPROVED, NOT ACCEPTED 6 $179,858 70 $202,709 75 $168,356 41 $42,901 0 $0 3 $217,103 APPLICATIONS DENIED 4 $169,412 86 $200,549 204 $167,297 56 $35,520 3 $473,377 9 $158,070 APPLICATIONS WITHDRAWN 3 $127,370 68 $253,182 130 $154,392 15 $47,689 0 $0 12 $135,720 FILES CLOSED FOR INCOMPLETENESS 0 $0 12 $235,597 54 $209,875 3 $11,887 2 $792,815 2 $142,100
Aggregated Statistics For Year 1999(Based on 3 full and 6 partial tracts) A) FHA, FSA/RHS & VA B) Conventional C) Refinancings D) Home Improvement Loans E) Loans on Dwellings For 5+ Families F) Non-occupant Loans on Number Average Value Number Average Value Number Average Value Number Average Value Number Average Value Number Average Value
LOANS ORIGINATED 34 $168,145 337 $208,077 564 $195,308 78 $53,389 3 $412,503 41 $161,685 APPLICATIONS APPROVED, NOT ACCEPTED 1 $212,640 38 $210,790 85 $216,731 31 $35,018 0 $0 6 $206,885 APPLICATIONS DENIED 3 $165,773 51 $259,495 163 $212,748 30 $29,294 0 $0 15 $152,727 APPLICATIONS WITHDRAWN 6 $150,400 63 $198,131 134 $210,010 10 $25,841 0 $0 10 $180,333 FILES CLOSED FOR INCOMPLETENESS 0 $0 16 $244,522 55 $239,517 2 $24,360 0 $0 2 $162,165
Private Mortgage Insurance Companies Aggregated Statistics For Year 2009(Based on 4 full and 8 partial tracts) A) Conventional B) Refinancings Number Average Value Number Average Value
LOANS ORIGINATED 10 $320,419 6 $385,607 APPLICATIONS APPROVED, NOT ACCEPTED 12 $373,823 6 $479,803 APPLICATIONS DENIED 2 $514,675 1 $430,820 APPLICATIONS WITHDRAWN 0 $0 0 $0 FILES CLOSED FOR INCOMPLETENESS 0 $0 1 $378,000
Aggregated Statistics For Year 2008(Based on 6 full and 10 partial tracts) A) Conventional B) Refinancings C) Non-occupant Loans on Number Average Value Number Average Value Number Average Value
LOANS ORIGINATED 24 $384,453 6 $392,617 0 $0 APPLICATIONS APPROVED, NOT ACCEPTED 15 $468,181 7 $457,809 2 $440,445 APPLICATIONS DENIED 2 $394,760 4 $522,318 0 $0 APPLICATIONS WITHDRAWN 2 $413,915 0 $0 0 $0 FILES CLOSED FOR INCOMPLETENESS 2 $385,215 0 $0 0 $0
Aggregated Statistics For Year 2007(Based on 3 full and 10 partial tracts) A) Conventional B) Refinancings Number Average Value Number Average Value
LOANS ORIGINATED 9 $415,918 9 $498,498 APPLICATIONS APPROVED, NOT ACCEPTED 0 $0 6 $526,485 APPLICATIONS DENIED 3 $750,473 3 $511,800 APPLICATIONS WITHDRAWN 1 $549,800 2 $424,840 FILES CLOSED FOR INCOMPLETENESS 0 $0 0 $0
Aggregated Statistics For Year 2006(Based on 1 full and 4 partial tracts) A) Conventional B) Refinancings C) Non-occupant Loans on Number Average Value Number Average Value Number Average Value
LOANS ORIGINATED 3 $469,983 1 $230,080 0 $0 APPLICATIONS APPROVED, NOT ACCEPTED 2 $345,590 2 $139,390 2 $345,590 APPLICATIONS DENIED 0 $0 0 $0 0 $0 APPLICATIONS WITHDRAWN 0 $0 0 $0 0 $0 FILES CLOSED FOR INCOMPLETENESS 0 $0 0 $0 0 $0
Aggregated Statistics For Year 2005(Based on 2 full and 8 partial tracts) A) Conventional B) Refinancings C) Non-occupant Loans on Number Average Value Number Average Value Number Average Value
LOANS ORIGINATED 7 $420,930 4 $330,572 2 $291,130 APPLICATIONS APPROVED, NOT ACCEPTED 2 $230,480 0 $0 0 $0 APPLICATIONS DENIED 0 $0 0 $0 0 $0 APPLICATIONS WITHDRAWN 0 $0 0 $0 0 $0 FILES CLOSED FOR INCOMPLETENESS 0 $0 1 $469,000 0 $0
Aggregated Statistics For Year 2004(Based on 4 full and 10 partial tracts) A) Conventional B) Refinancings C) Non-occupant Loans on Number Average Value Number Average Value Number Average Value
LOANS ORIGINATED 15 $354,498 5 $287,668 3 $286,603 APPLICATIONS APPROVED, NOT ACCEPTED 4 $331,642 6 $225,572 0 $0 APPLICATIONS DENIED 0 $0 0 $0 0 $0 APPLICATIONS WITHDRAWN 1 $83,730 0 $0 0 $0 FILES CLOSED FOR INCOMPLETENESS 0 $0 0 $0 0 $0
Aggregated Statistics For Year 2003(Based on 6 full and 10 partial tracts) A) Conventional B) Refinancings C) Non-occupant Loans on Number Average Value Number Average Value Number Average Value
LOANS ORIGINATED 44 $313,659 33 $252,143 3 $174,000 APPLICATIONS APPROVED, NOT ACCEPTED 6 $359,392 14 $233,983 0 $0 APPLICATIONS DENIED 0 $0 0 $0 0 $0 APPLICATIONS WITHDRAWN 1 $205,350 3 $297,613 0 $0 FILES CLOSED FOR INCOMPLETENESS 0 $0 0 $0 0 $0
Aggregated Statistics For Year 2002(Based on 6 full and 10 partial tracts) A) Conventional B) Refinancings C) Non-occupant Loans on Number Average Value Number Average Value Number Average Value
LOANS ORIGINATED 47 $245,304 46 $241,053 3 $223,077 APPLICATIONS APPROVED, NOT ACCEPTED 20 $277,686 27 $266,719 0 $0 APPLICATIONS DENIED 0 $0 0 $0 0 $0 APPLICATIONS WITHDRAWN 2 $367,175 1 $92,610 0 $0 FILES CLOSED FOR INCOMPLETENESS 2 $242,610 2 $268,870 0 $0
Aggregated Statistics For Year 2001(Based on 6 full and 10 partial tracts) A) Conventional B) Refinancings C) Non-occupant Loans on Number Average Value Number Average Value Number Average Value
LOANS ORIGINATED 82 $230,709 70 $217,545 2 $189,685 APPLICATIONS APPROVED, NOT ACCEPTED 8 $263,771 16 $199,218 1 $319,000 APPLICATIONS DENIED 3 $253,843 4 $203,725 1 $330,160 APPLICATIONS WITHDRAWN 3 $221,183 0 $0 0 $0 FILES CLOSED FOR INCOMPLETENESS 0 $0 0 $0 0 $0
Aggregated Statistics For Year 2000(Based on 6 full and 10 partial tracts) A) Conventional B) Refinancings C) Non-occupant Loans on Number Average Value Number Average Value Number Average Value
LOANS ORIGINATED 101 $203,793 25 $245,382 2 $97,045 APPLICATIONS APPROVED, NOT ACCEPTED 7 $234,344 13 $202,732 2 $189,675 APPLICATIONS DENIED 5 $202,836 1 $89,160 0 $0 APPLICATIONS WITHDRAWN 0 $0 0 $0 0 $0 FILES CLOSED FOR INCOMPLETENESS 0 $0 0 $0 0 $0
Aggregated Statistics For Year 1999(Based on 3 full and 6 partial tracts) A) Conventional B) Refinancings C) Non-occupant Loans on Number Average Value Number Average Value Number Average Value
LOANS ORIGINATED 73 $210,059 48 $193,429 2 $110,140 APPLICATIONS APPROVED, NOT ACCEPTED 11 $204,994 15 $211,761 1 $186,920 APPLICATIONS DENIED 5 $180,012 5 $198,862 1 $171,450 APPLICATIONS WITHDRAWN 6 $177,832 2 $158,830 1 $85,720 FILES CLOSED FOR INCOMPLETENESS 0 $0 1 $119,470 0 $0
Most common first names in zip code 91741 among deceased individuals Name Count Lived (average)
Mary 61 81.6 years John 55 79.3 years Robert 54 74.7 years William 46 78.9 years Dorothy 38 83.6 years James 36 74.9 years Ruth 32 83.3 years Helen 31 86.1 years Donald 26 75.7 years Charles 25 79.0 years
Most common last names in zip code 91741 among deceased individuals Last name Count Lived (average)
Smith 17 74.8 years Johnson 14 72.2 years Davis 13 81.5 years Wilson 11 75.2 years Brown 10 81.0 years Anderson 9 80.6 years Miller 8 80.5 years Clark 8 81.6 years Berry 7 77.9 years Walker 7 77.1 years
Businesses in zip code 91741
Name Count Name Count
24 Hour Fitness 1 McDonald's 1 Ace Hardware 1 Starbucks 2 AutoZone 1 The Room Place 1 Blockbuster 1 U-Haul 1 CVS 1 UPS 2 Domino's Pizza 1 Wendy's 1 FedEx 4

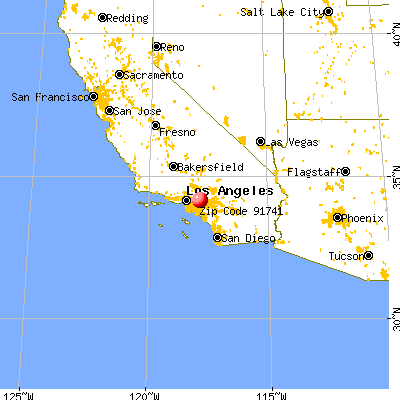


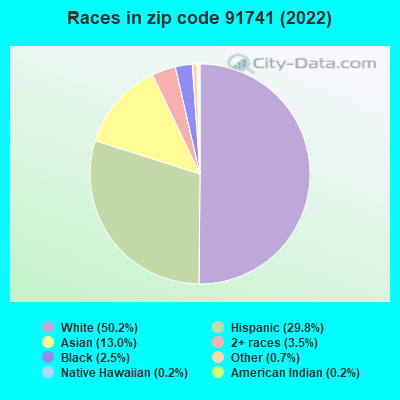


+$73,857
-$7,562
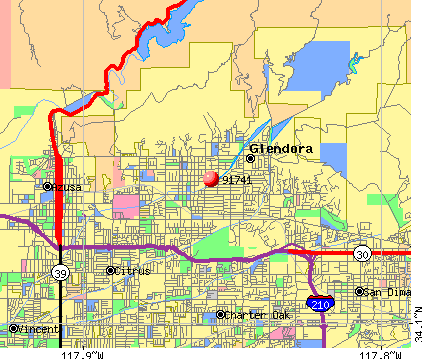 Nearest zip codes: 91740, 91773, 91750, 91724, 91723, 91722.