Estimated zip code population in 2022: 17,814 Zip code population in 2010: 18,275 Zip code population in 2000: 17,552
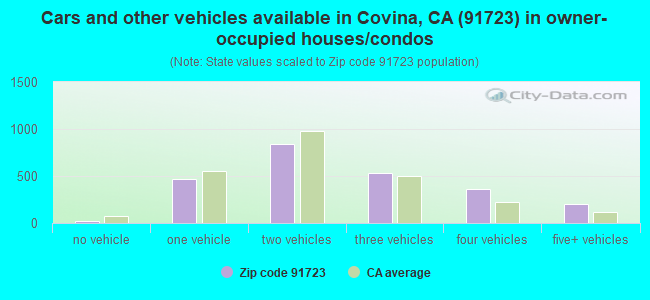
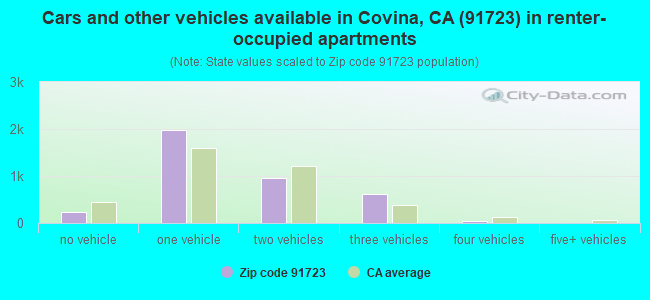
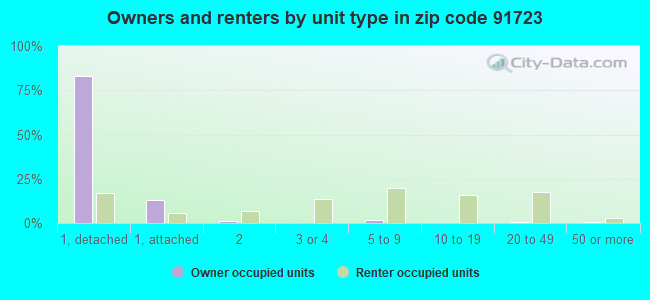
Houses and condos: 6,496 Renter-occupied apartments: 3,817
% of renters here:
61%
State:
44%
March 2022 cost of living index in zip code 91723: 133.8 (high, U.S. average is 100)
Land area: 2.3 sq. mi. Water area: 0.0 sq. mi.
Population density: 7,670 people per square mile
(high).
OSM Map
General Map
Google Map
MSN Map
OSM Map
General Map
Google Map
MSN Map
OSM Map
General Map
Google Map
MSN Map
OSM Map
General Map
Google Map
MSN Map
Please wait while loading the map...
Real estate property taxes paid for housing units in 2022:
This zip code:
0.7% ($4,853)
California:
0.7% ($4,831)
Median real estate property taxes paid for housing units with mortgages in 2022: $5,189 (0.7%) Median real estate property taxes paid for housing units with no mortgage in 2022: $4,231 (0.7%)
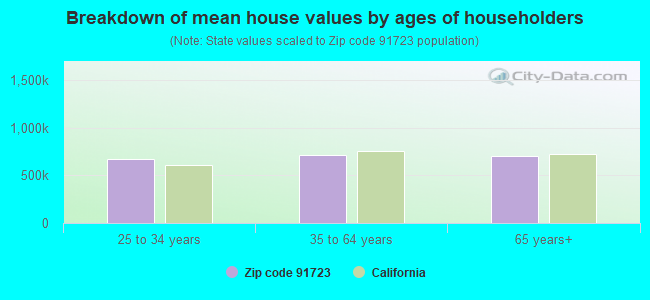
Estimated median house/condo value in 2022: $689,297
91723:
$689,297
California:
$715,900
According to our research of California and other state lists, there were 24 registered sex offenders living in 91723 zip code as of April 27, 2024. The ratio of all residents to sex offenders in zip code 91723 is 814 to 1. The ratio of registered sex offenders to all residents in this zip code is near the state average.
Median resident age:
This zip code:
38.7 years
California median age:
37.9 years
Average household size:
This zip code:
2.8 people
California:
2.8 people
Averages for the 2020 tax year for zip code 91723, filed in 2021:
Average Adjusted Gross Income (AGI) in 2020: $58,328 (Individual Income Tax Returns)
Here:
$58,328
State:
$95,910
Salary/wage: $53,273 (reported on 84.3% of returns)
Here:
$53,273
State:
$77,331
(% of AGI for various income ranges: 1124.5% for AGIs below $25k, 4047.4% for AGIs $25k-50k, 7484.2% for AGIs $50k-75k, 11186.3% for AGIs $75k-100k, 20676.3% for AGIs $100k-200k, 62906.2% for AGIs over 200k)
Taxable interest for individuals: $1,160 (reported on 27.9% of returns)
This zip code:
$1,160
California:
$2,294
(% of AGI for various income ranges: 6.8% for AGIs below $25k, 10.8% for AGIs $25k-50k, 22.0% for AGIs $50k-75k, 35.3% for AGIs $75k-100k, 102.8% for AGIs $100k-200k, 2100.0% for AGIs over 200k)
Ordinary dividends: $3,094 (reported on 10.1% of returns)
Here:
$3,094
State:
$10,949
(% of AGI for various income ranges: 8.7% for AGIs below $25k, 9.9% for AGIs $25k-50k, 41.1% for AGIs $50k-75k, 65.0% for AGIs $75k-100k, 114.4% for AGIs $100k-200k, 1331.2% for AGIs over 200k)
Net capital gain/loss in AGI: +$8,855 (reported on 11.3% of returns)
Here:
+$8,855
State:
+$49,306
(% of AGI for various income ranges: 1.0% for AGIs below $25k, 2.9% for AGIs $25k-50k, 68.5% for AGIs $50k-75k, 102.7% for AGIs $75k-100k, 197.8% for AGIs $100k-200k, 8820.0% for AGIs over 200k)
Profit/loss from business: +$8,625 (reported on 17.0% of returns)
Here:
+$8,625
State:
+$15,671
(% of AGI for various income ranges: 159.1% for AGIs below $25k, 131.8% for AGIs $25k-50k, 166.2% for AGIs $50k-75k, 241.0% for AGIs $75k-100k, 430.9% for AGIs $100k-200k, 2601.2% for AGIs over 200k)
Taxable individual retirement arrangement distribution: $18,292 (reported on 4.1% of returns)
91723:
$18,292
California:
$23,505
(% of AGI for various income ranges: 29.7% for AGIs below $25k, 38.6% for AGIs $25k-50k, 114.1% for AGIs $50k-75k, 200.7% for AGIs $75k-100k, 341.3% for AGIs $100k-200k, 1435.0% for AGIs over 200k)
Total itemized deductions: $29,826 (reported on 13.8% of returns)
Here:
$29,826
State:
$39,517
(% of AGI for various income ranges: 56.1% for AGIs below $25k, 163.6% for AGIs $25k-50k, 539.3% for AGIs $50k-75k, 1092.2% for AGIs $75k-100k, 2400.4% for AGIs $100k-200k, 9337.5% for AGIs over 200k)
Charity contributions: $5,284 (reported on 11.6% of returns)
Here:
$5,284
State:
$12,598
(% of AGI for various income ranges: 2.4% for AGIs below $25k, 19.9% for AGIs $25k-50k, 60.4% for AGIs $50k-75k, 135.7% for AGIs $75k-100k, 375.0% for AGIs $100k-200k, 1966.3% for AGIs over 200k)
Taxes paid: $8,697 (reported on 13.8% of returns)
91723:
$8,697
State:
$8,807
(% of AGI for various income ranges: 12.0% for AGIs below $25k, 45.8% for AGIs $25k-50k, 150.5% for AGIs $50k-75k, 352.7% for AGIs $75k-100k, 787.2% for AGIs $100k-200k, 1986.2% for AGIs over 200k)
Earned income credit: $1,922 (reported on 16.2% of returns)
Here:
$1,922
State:
$2,074
(% of AGI for various income ranges: 81.9% for AGIs below $25k, 62.7% for AGIs $25k-50k)
Percentage of individuals using paid preparers for their 2020 taxes: 92.3%
Here:
92%
State:
92%
(% for various income ranges: 92.0% for AGIs below $25k, 92.8% for AGIs $25k-50k, 91.8% for AGIs $50k-75k, 90.4% for AGIs $75k-100k, 93.0% for AGIs $100k-200k, 96.3% for AGIs over 200k)
Averages for the 2012 tax year for zip code 91723, filed in 2013:
Average Adjusted Gross Income (AGI) in 2012: $46,408 (Individual Income Tax Returns)
Here:
$46,408
State:
$72,726
Salary/wage: $44,039 (reported on 85.1% of returns)
Here:
$44,039
State:
$59,079
(% of AGI for various income ranges: 74.0% for AGIs below $25k, 85.8% for AGIs $25k-50k, 85.5% for AGIs $50k-75k, 82.5% for AGIs $75k-100k, 81.2% for AGIs $100k-200k, 55.5% for AGIs over 200k)
Taxable interest for individuals: $710 (reported on 27.6% of returns)
This zip code:
$710
California:
$2,146
(% of AGI for various income ranges: 0.5% for AGIs below $25k, 0.4% for AGIs $25k-50k, 0.3% for AGIs $50k-75k, 0.3% for AGIs $75k-100k, 0.5% for AGIs $100k-200k, 0.7% for AGIs over 200k)
Ordinary dividends: $3,290 (reported on 9.1% of returns)
Here:
$3,290
State:
$9,308
(% of AGI for various income ranges: 0.6% for AGIs below $25k, 0.4% for AGIs $25k-50k, 0.6% for AGIs $50k-75k, 0.8% for AGIs $75k-100k, 0.9% for AGIs $100k-200k, 0.5% for AGIs over 200k)
Net capital gain/loss in AGI: +$2,901 (reported on 8.2% of returns)
Here:
+$2,901
State:
+$30,460
(% of AGI for various income ranges: 0.5% for AGIs $75k-100k, 0.7% for AGIs $100k-200k, 4.1% for AGIs over 200k)
Profit/loss from business: +$12,074 (reported on 16.4% of returns)
Here:
+$12,074
State:
+$17,064
(% of AGI for various income ranges: 13.8% for AGIs below $25k, 3.5% for AGIs $25k-50k, 1.4% for AGIs $50k-75k, 2.1% for AGIs $75k-100k, 5.5% for AGIs $100k-200k)
Taxable individual retirement arrangement distribution: $13,126 (reported on 5.5% of returns)
91723:
$13,126
California:
$19,557
(% of AGI for various income ranges: 1.2% for AGIs below $25k, 1.3% for AGIs $25k-50k, 1.4% for AGIs $50k-75k, 1.9% for AGIs $75k-100k, 2.2% for AGIs $100k-200k)
Total itemized deductions: $23,765 (28% of AGI, reported on 31.8% of returns)
Here:
$23,765
State:
$34,004
Here:
28.5% of AGI
State:
22.7% of AGI
(% of AGI for various income ranges: 8.0% for AGIs below $25k, 11.7% for AGIs $25k-50k, 16.5% for AGIs $50k-75k, 19.4% for AGIs $75k-100k, 20.7% for AGIs $100k-200k, 18.9% for AGIs over 200k)
Charity contributions: $2,776 (reported on 27.5% of returns)
Here:
$2,776
State:
$4,659
(% of AGI for various income ranges: 0.4% for AGIs below $25k, 1.1% for AGIs $25k-50k, 1.6% for AGIs $50k-75k, 1.9% for AGIs $75k-100k, 2.1% for AGIs $100k-200k, 2.9% for AGIs over 200k)
Taxes paid: $7,237 (reported on 31.7% of returns)
91723:
$7,237
State:
$14,448
(% of AGI for various income ranges: 1.7% for AGIs below $25k, 2.4% for AGIs $25k-50k, 4.5% for AGIs $50k-75k, 6.1% for AGIs $75k-100k, 7.3% for AGIs $100k-200k, 7.8% for AGIs over 200k)
Earned income credit: $2,154 (reported on 22.6% of returns)
Here:
$2,154
State:
$2,286
(% of AGI for various income ranges: 7.4% for AGIs below $25k, 1.2% for AGIs $25k-50k)
Percentage of individuals using paid preparers for their 2012 taxes: 68.3%
Here:
68%
State:
64%
(% for various income ranges: 63.1% for AGIs below $25k, 69.5% for AGIs $25k-50k, 71.2% for AGIs $50k-75k, 76.7% for AGIs $75k-100k, 73.8% for AGIs $100k-200k, 75.0% for AGIs over 200k)
Averages for the 2004 tax year for zip code 91723, filed in 2005:
Average Adjusted Gross Income (AGI) in 2004: $42,142 (Individual Income Tax Returns)
Here:
$42,142
State:
$58,600
Salary/wage: $39,020 (reported on 86.1% of returns)
Here:
$39,020
State:
$49,455
(% of AGI for various income ranges: 113.9% for AGIs below $10k, 79.0% for AGIs $10k-25k, 87.0% for AGIs $25k-50k, 84.8% for AGIs $50k-75k, 85.5% for AGIs $75k-100k, 63.0% for AGIs over 100k)
Taxable interest for individuals: $1,215 (reported on 37.4% of returns)
This zip code:
$1,215
California:
$2,365
(% of AGI for various income ranges: 3.2% for AGIs below $10k, 1.5% for AGIs $10k-25k, 0.9% for AGIs $25k-50k, 0.9% for AGIs $50k-75k, 0.6% for AGIs $75k-100k, 1.4% for AGIs over 100k)
Taxable dividends: $2,661 (reported on 14.1% of returns)
Here:
$2,661
State:
$4,746
(% of AGI for various income ranges: 1.7% for AGIs below $10k, 0.6% for AGIs $10k-25k, 0.4% for AGIs $25k-50k, 1.0% for AGIs $50k-75k, 0.7% for AGIs $75k-100k, 1.5% for AGIs over 100k)
Net capital gain/loss: +$14,314 (reported on 11.7% of returns)
Here:
+$14,314
State:
+$23,418
(% of AGI for various income ranges: -2.3% for AGIs below $10k, -0.2% for AGIs $10k-25k, 0.2% for AGIs $25k-50k, 0.6% for AGIs $50k-75k, 0.7% for AGIs $75k-100k, 14.4% for AGIs over 100k)
Profit/loss from business: +$11,432 (reported on 15.3% of returns)
Here:
+$11,432
State:
+$16,826
(% of AGI for various income ranges: 15.4% for AGIs below $10k, 8.7% for AGIs $10k-25k, 3.9% for AGIs $25k-50k, 2.0% for AGIs $50k-75k, 2.5% for AGIs $75k-100k, 4.8% for AGIs over 100k)
IRA payment deduction: $3,095 (reported on 2.1% of returns)
91723:
$3,095
California:
$3,192
(% of AGI for various income ranges: 0.1% for AGIs $10k-25k, 0.2% for AGIs $25k-50k, 0.2% for AGIs $50k-75k, 0.1% for AGIs $75k-100k, 0.1% for AGIs over 100k)
Self-employed pension: $6,241 (reported on 0.4% of returns)
Here:
$6,241
California:
$17,688
Total itemized deductions: $21,699 (30% of AGI, reported on 34.9% of returns)
Here:
$21,699
State:
$28,113
Here:
29.6% of AGI
State:
25.3% of AGI
(% of AGI for various income ranges: 15.4% for AGIs below $10k, 8.5% for AGIs $10k-25k, 14.1% for AGIs $25k-50k, 20.7% for AGIs $50k-75k, 22.9% for AGIs $75k-100k, 20.2% for AGIs over 100k)
Charity contributions deductions: $2,927 (4% of AGI, reported on 31.8% of returns)
Here:
$2,927
State:
$3,923
Here:
3.9% of AGI
State:
3.3% of AGI
(% of AGI for various income ranges: 1.2% for AGIs below $10k, 0.7% for AGIs $10k-25k, 1.6% for AGIs $25k-50k, 2.4% for AGIs $50k-75k, 2.9% for AGIs $75k-100k, 2.8% for AGIs over 100k)
Total tax: $5,194 (reported on 75.2% of returns)
91723:
$5,194
State:
$10,761
(% of AGI for various income ranges: 4.5% for AGIs below $10k, 4.3% for AGIs $10k-25k, 6.5% for AGIs $25k-50k, 8.5% for AGIs $50k-75k, 9.2% for AGIs $75k-100k, 14.8% for AGIs over 100k)
Earned income credit: $1,666 (reported on 18.0% of returns)
Here:
$1,666
State:
$1,763
Percentage of individuals using paid preparers for their 2004 taxes: 70.1%
Here:
70%
State:
66%
(% for various income ranges: 62.8% for AGIs below $10k, 70.6% for AGIs $10k-25k, 70.5% for AGIs $25k-50k, 72.2% for AGIs $50k-75k, 72.2% for AGIs $75k-100k, 78.1% for AGIs over 100k)
Likely homosexual households (counted as self-reported same-sex unmarried-partner households)
Lesbian couples: 0.0% of all households
Gay men: 0.2% of all households
Household received Food Stamps/SNAP in the past 12 months: 982 Household did not receive Food Stamps/SNAP in the past 12 months: 5,329
Women who had a birth in the past 12 months: 348 (273 now married, 75 unmarried) Women who did not have a birth in the past 12 months: 4,425 (1,517 now married, 2,918 unmarried)
Housing units in zip code 91723 with a mortgage: 1,716 (146 second mortgage, 11 home equity loan, 92 both second mortgage and home equity loan) Houses without a mortgage: 24
Median monthly owner costs for units with a mortgage: $2,579 Median monthly owner costs for units without a mortgage: $741
Residents with income below the poverty level in 2022:
This zip code:
10.0%
Whole state:
12.2%
Residents with income below 50% of the poverty level in 2022:
This zip code:
6.8%
Whole state:
6.2%
Median number of rooms in houses and condos:
Here:
5.8
State:
6.0
Median number of rooms in apartments:
Here:
3.9
State:
3.9
Notable locations in this zip code not listed on our city pages
Notable locations in zip code 91723: Covina Public Library (A), Covina City Hall (B), Los Angeles County Fire Department Station 154 (C). Display/hide their locations on the map
Churches in zip code 91723 include: Covina Assembly of God Church (A), First Baptist Church (B), First Church of Christ Scientist (C), First Presbyterian Church of Covina (D), Holy Trinity Episcopal Church (E), Sacred Heart Catholic Church (F), United Methodist Church of Covina (G). Display/hide their locations on the map
In group quarters: 294 (-1 institutionalized population)
Size of family households: 1,378 2-persons, 1,082 3-persons, 850 4-persons, 621 5-persons, 153 6-persons, 140 7-or-more-persons
Size of nonfamily households: 1,742 1-person, 222 2-persons, 73 3-persons
1,768 married couples with children.
1,031 single-parent households (275 men, 756 women).
55.0% of residents of 91723 zip code speak English at home.
35.1% of residents speak Spanish at home (71% very well, 15% well, 11% not well, 3% not at all).
0.7% of residents speak other Indo-European language at home (84% very well, 5% well, 11% not well).
7.6% of residents speak Asian or Pacific Island language at home (65% very well, 23% well, 9% not well, 3% not at all).
1.3% of residents speak other language at home (38% very well, 58% well, 4% not well).
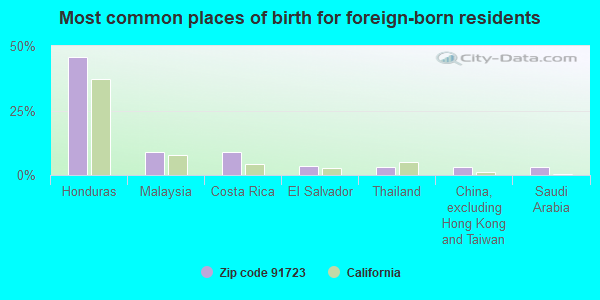
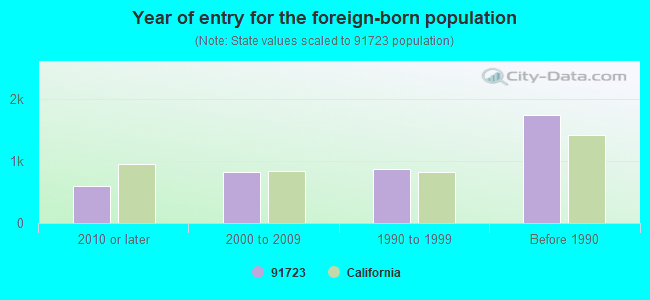
Foreign born population: 3,898 (21.9%) (62.6% of them are naturalized citizens)
Major facilities with environmental interests located in this zip code:
J&J DOOR CLOSER SERVICE INC (716 E EDNA PLACE in COVINA, CA)
STATE MASTER (California - Hazardous Waste Tracking) - HAZARDOU WASTE PROGRAM Small Quantity Generators, between 100 kg and 1000 kg of hazardous waste/month (Resource Conservation and Recovery Act (tracking hazardous waste)) - notification Organizations: FRANK GERACI (CONTACT/OWNER)
GLEN OAK ELEMENTARY (1000 N. SUNFLOWER AVE. in COVINA, CA)
(National Center for Education Statistics) - STATE ID-6012090 Organizations: CHARTER OAK UNIFIED (SCHOOL DISTRICT)
MAGAN MEDICAL CLINIC INC (420 W ROWLAND ST in COVINA, CA)
STATE MASTER (California - Hazardous Waste Tracking) - HAZARDOU WASTE PROGRAM Small Quantity Generators, between 100 kg and 1000 kg of hazardous waste/month (Resource Conservation and Recovery Act (tracking hazardous waste)) Business NAICS classification: OFFICES OF PHYSICIANS, MENTAL HEALTH SPECIALISTS.
MERWIN ELEMENTARY (16125 CYPRESS in COVINA, CA)
(National Center for Education Statistics) - STATE ID-6012553 Organizations: COVINA-VALLEY UNIFIED (SCHOOL DISTRICT)
MESA ELEMENTARY (409 S. BARRANCA AVE. in COVINA, CA)
(National Center for Education Statistics) - STATE ID-6012561 Organizations: COVINA-VALLEY UNIFIED (SCHOOL DISTRICT)
CHARTER OAK HIGH (1430 E. COVINA BLVD. in COVINA, CA)
(National Center for Education Statistics) - STATE ID-1931666 Organizations: CHARTER OAK UNIFIED (SCHOOL DISTRICT)
BADILLO ELEMENTARY (1771 E. OLD BADILLO AVE. in COVINA, CA)
(National Center for Education Statistics) - STATE ID-6012041 Organizations: CHARTER OAK UNIFIED (SCHOOL DISTRICT)
CEDARGROVE ELEMENTARY (1209 N. GLENDORA AVE. in COVINA, CA)
(National Center for Education Statistics) - STATE ID-6012066 Organizations: CHARTER OAK UNIFIED (SCHOOL DISTRICT)
INTERCOMMUNITY MEDICAL CENTER (303 NORTH THIRD AVENUE in COVINA, CA)
CRITERIA AND HAZARDOUS AIR POLLUTANT INVENTORY (Inventory of air pollution sources) Large Quantity Generators, more that 1000 kg of hazardous waste/month (Resource Conservation and Recovery Act (tracking hazardous waste)) Business SIC classification: OFFICES AND CLINICS OF DOCTORS OF MEDICINE Organizations: INTERCOMMUNITY MEDICAL CENTER INC (CONTACT/OWNER)
JONES & ROY CO (620 COMMERCIAL AVE in COVINA, CA)
(Resource Conservation and Recovery Act (tracking hazardous waste)) Business NAICS classification: IRON AND STEEL FORGING.; SPECIAL DIE AND TOOL, DIE SET, JIG, AND FIXTURE MANUFACTURING.
MODERN RADIATOR (425 SAN BERNARDINO RD in COVINA, CA)
(Resource Conservation and Recovery Act (tracking hazardous waste)) Organizations: MIKE BRADY (CONTACT/OWNER)
AMAN ENVIRONMENTAL CONSTRUCTION, INC (614 EAST EDNA PLACE in COVINA, CA)
CRITERIA AND HAZARDOUS AIR POLLUTANT INVENTORY (Inventory of air pollution sources) AIR MAJOR ("Best Available" air pollution technologies tracking) Business SIC classification: HEAVY CONSTRUCTION Alternative names: AMAN BROTHERS, INC, AMAN BROS INC ENGINEERS
ELDON DRAPERY CLEANERS (551 E EDNA PL in COVINA, CA)
Small Quantity Generators, between 100 kg and 1000 kg of hazardous waste/month (Resource Conservation and Recovery Act (tracking hazardous waste)) - notification Organizations: LONG GEIN CHEN (CONTACT/OWNER)
Housing units lacking complete plumbing facilities: 0.9% Housing units lacking complete kitchen facilities: 2.5%
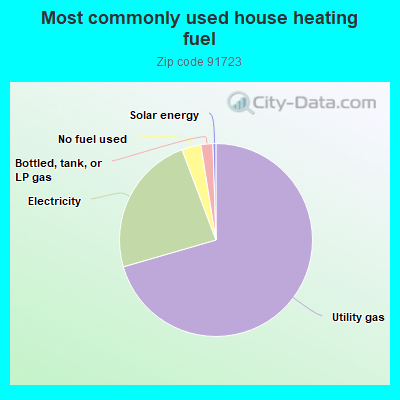
70.3%Utility gas
23.7%Electricity
3.2%No fuel used
2.0%Bottled, tank, or LP gas
0.5%Solar energy
Population in 1990: 15,590. Population change in the 1990s: +1,962 (+12.6%).
Place of birth for U.S.-born residents:
This state: 12,183
Northeast: 264
Midwest: 540
South: 516
West: 251
45% of the 91723 zip code residents lived in the same house 5 years ago. Out of people who lived in different houses, 86% lived in this county. Out of people who lived in different counties, 50% lived in California.
91% of the 91723 zip code residents lived in the same house 1 year ago. Out of people who lived in different houses, 73% moved from this county. Out of people who lived in different houses, 16% moved from different county within same state. Out of people who lived in different houses, 7% moved from different state. Out of people who lived in different houses, 2% moved from abroad.
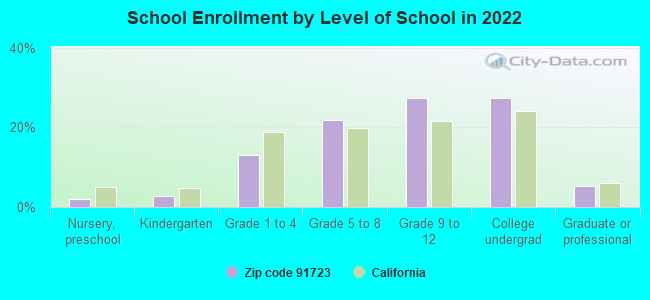
Private vs. public school enrollment:
Students in private schools in grades 1 to 8 (elementary and middle school): 140
Here:
10.2%
California:
10.5%
Students in private schools in grades 9 to 12 (high school): 63
Here:
5.8%
California:
8.5%
Students in private undergraduate colleges: 137
Here:
12.7%
California:
15.9%
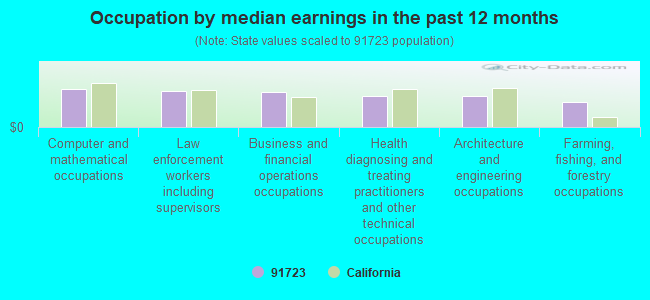
Occupation by median earnings in the past 12 months ($)
103,037Computer and mathematical occupations
98,956Law enforcement workers including supervisors
94,191Business and financial operations occupations
85,257Health diagnosing and treating practitioners and other technical occupations
84,200Architecture and engineering occupations
68,438Farming, fishing, and forestry occupations
Companies with federal contracts located in this zip code:
HYDRO FITTING MANUFACTURING CO (733 E EDNA PL in COVINA, CA; small business) : $1,321,782 in 118 contractsfrom 1999 to 2006
Contracts for Hose, Pipe, Tube, Lubrication, and Railing Fittings, Aircraft Hydraulic, Vacuum, and De-icing System Components, Pressure, Temperature, and Humidity Measuring and Controlling Instruments, Valves, Nonpowered, and moreby Defense Logistics Agency, Navy, Army Signed by year:2000: $55,861; 2001: $98,208; 2002: $176,382; 2003: $0; 2004: $347,084; 2005: $488,784; 2006: $112,695.
Biggest contracts:
$88,400 with Defense Logistics Agency for Hose, Pipe, Tube, Lubrication, and Railing Fittings. Signed on 2004-03-08. Completion date: 2004-08-02.
$88,400, same as above.Signed on 2004-02-18. Completion date: 2004-07-02.
$76,813 with Defense Logistics Agency for Aircraft Hydraulic, Vacuum, and De-icing System Components. Signed on 2002-04-29. Completion date: 2007-04-29.
$42,768 with Defense Logistics Agency for Hose, Pipe, Tube, Lubrication, and Railing Fittings. Signed on 1999-12-29. Completion date: 2000-08-25.
METRO MONITORING SERVICES, INC (206 E ROWLAND ST in COVINA, CA; small business) : $180,095 in 3 contractsfrom 1999 to 2001
$121,000 with National Oceanic and Atmospheric Administration/Under Secretary for Oceans and Atmosphere for Weather Reporting/Observation Services. Taking place in AZ. Signed on 2000-01-15. Completion date: 2000-01-15.
$50,000, same as above.Signed on 1999-12-15. Completion date: 2000-01-15.
$9,095 with U.S. Army Corps of Engineers - civil program financing only for Facilities Operations Support Services. Taking place in FL. Signed on 2001-06-14. Completion date: 2001-09-30.
CALIFORNIA DEPOSITION REPORTER (599 S BARRANCA STE 100 in COVINA, CA) : $6,707 in 2 contractsfrom 2005 to 2006
$6,038 with Army for Legal Services. Signed on 2006-01-26. Completion date: 2006-02-10.
$669 with Internal Revenue Service for Court Reporting Services. Signed on 2005-08-01. Completion date: 2005-09-30.
Top industries in this zip code by the number of employees in 2005:
Administrative and Support and Waste Management and Remediation Services: Temporary Help Services (500-999 employees: 2 establishments, 20-49 employees: 2 establishments)
Health Care and Social Assistance: Offices of Physicians (except Mental Health Specialists) (250-499: 1, 20-49: 2, 10-19: 3, 5-9: 12, 1-4: 28)
Health Care and Social Assistance: Home Health Care Services (50-99: 3, 20-49: 4, 10-19: 1, 1-4: 1)
Management of Companies and Enterprises: Corporate, Subsidiary, and Regional Managing Offices (250-499: 1)
Health Care and Social Assistance: Nursing Care Facilities (100-249: 1, 50-99: 1, 20-49: 1)
Other Services (except Public Administration): Religious Organizations (50-99: 1, 20-49: 3, 10-19: 3, 1-4: 8)


 Nearest zip codes: 91722, 91791, 91724, 91740, 91790, 91792.