Estimated zip code population in 2022: 34,183 Zip code population in 2010: 34,409 Zip code population in 2000: 33,803
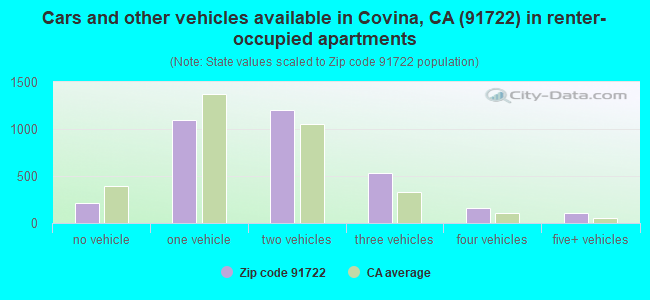
Houses and condos: 10,595 Renter-occupied apartments: 3,311
% of renters here:
32%
State:
44%
March 2022 cost of living index in zip code 91722: 131.9 (high, U.S. average is 100)
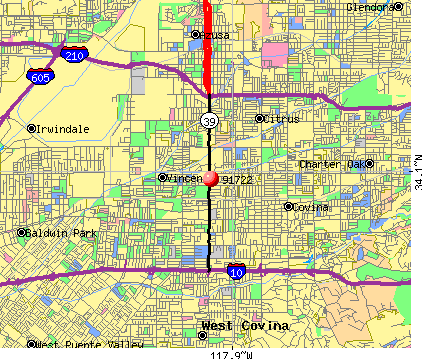
Land area: 4.1 sq. mi. Water area: 0.0 sq. mi.
Population density: 8,275 people per square mile
(high).
OSM Map
General Map
Google Map
MSN Map
OSM Map
General Map
Google Map
MSN Map
OSM Map
General Map
Google Map
MSN Map
OSM Map
General Map
Google Map
MSN Map
Please wait while loading the map...
Real estate property taxes paid for housing units in 2022:
This zip code:
0.7% ($4,206)
California:
0.7% ($4,831)
Median real estate property taxes paid for housing units with mortgages in 2022: $4,756 (0.7%) Median real estate property taxes paid for housing units with no mortgage in 2022: $2,704 (0.5%)
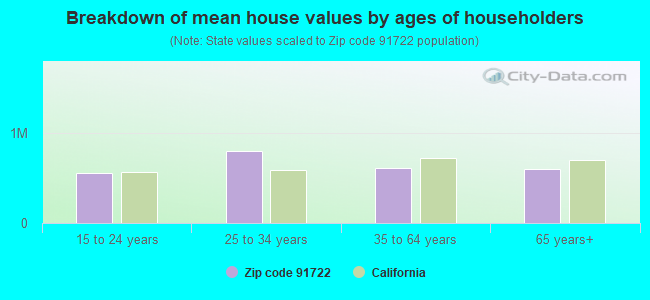
Estimated median house/condo value in 2022: $638,696
91722:
$638,696
California:
$715,900
According to our research of California and other state lists, there were 31 registered sex offenders living in 91722 zip code as of April 27, 2024. The ratio of all residents to sex offenders in zip code 91722 is 1,159 to 1. The ratio of registered sex offenders to all residents in this zip code is lower than the state average.
Median resident age:
This zip code:
38.3 years
California median age:
37.9 years
Average household size:
This zip code:
3.3 people
California:
2.8 people
Averages for the 2020 tax year for zip code 91722, filed in 2021:
Average Adjusted Gross Income (AGI) in 2020: $53,736 (Individual Income Tax Returns)
Here:
$53,736
State:
$95,910
Salary/wage: $51,573 (reported on 84.3% of returns)
Here:
$51,573
State:
$77,331
(% of AGI for various income ranges: 1201.4% for AGIs below $25k, 3890.7% for AGIs $25k-50k, 7492.6% for AGIs $50k-75k, 11010.2% for AGIs $75k-100k, 20115.1% for AGIs $100k-200k, 61330.0% for AGIs over 200k)
Taxable interest for individuals: $456 (reported on 30.1% of returns)
This zip code:
$456
California:
$2,294
(% of AGI for various income ranges: 8.6% for AGIs below $25k, 10.8% for AGIs $25k-50k, 21.6% for AGIs $50k-75k, 38.7% for AGIs $75k-100k, 40.3% for AGIs $100k-200k, 377.8% for AGIs over 200k)
Ordinary dividends: $1,720 (reported on 9.0% of returns)
Here:
$1,720
State:
$10,949
(% of AGI for various income ranges: 8.8% for AGIs below $25k, 9.9% for AGIs $25k-50k, 20.5% for AGIs $50k-75k, 39.7% for AGIs $75k-100k, 68.3% for AGIs $100k-200k, 360.0% for AGIs over 200k)
Net capital gain/loss in AGI: +$3,954 (reported on 9.9% of returns)
Here:
+$3,954
State:
+$49,306
(% of AGI for various income ranges: 1.4% for AGIs below $25k, 5.9% for AGIs $25k-50k, 28.4% for AGIs $50k-75k, 68.9% for AGIs $75k-100k, 191.1% for AGIs $100k-200k, 3342.2% for AGIs over 200k)
Profit/loss from business: +$7,620 (reported on 16.0% of returns)
Here:
+$7,620
State:
+$15,671
(% of AGI for various income ranges: 158.3% for AGIs below $25k, 189.5% for AGIs $25k-50k, 141.9% for AGIs $50k-75k, 173.2% for AGIs $75k-100k, 230.4% for AGIs $100k-200k, 956.7% for AGIs over 200k)
Taxable individual retirement arrangement distribution: $14,054 (reported on 4.1% of returns)
91722:
$14,054
California:
$23,505
(% of AGI for various income ranges: 30.2% for AGIs below $25k, 53.6% for AGIs $25k-50k, 87.7% for AGIs $50k-75k, 153.7% for AGIs $75k-100k, 247.0% for AGIs $100k-200k, 367.8% for AGIs over 200k)
Total itemized deductions: $27,764 (reported on 14.8% of returns)
Here:
$27,764
State:
$39,517
(% of AGI for various income ranges: 66.0% for AGIs below $25k, 209.7% for AGIs $25k-50k, 643.9% for AGIs $50k-75k, 1265.2% for AGIs $75k-100k, 2340.9% for AGIs $100k-200k, 6364.4% for AGIs over 200k)
Charity contributions: $4,561 (reported on 12.5% of returns)
Here:
$4,561
State:
$12,598
(% of AGI for various income ranges: 3.4% for AGIs below $25k, 20.8% for AGIs $25k-50k, 73.7% for AGIs $50k-75k, 172.7% for AGIs $75k-100k, 354.1% for AGIs $100k-200k, 1384.4% for AGIs over 200k)
Taxes paid: $8,610 (reported on 14.8% of returns)
91722:
$8,610
State:
$8,807
(% of AGI for various income ranges: 16.0% for AGIs below $25k, 58.8% for AGIs $25k-50k, 198.3% for AGIs $50k-75k, 408.5% for AGIs $75k-100k, 754.6% for AGIs $100k-200k, 1717.8% for AGIs over 200k)
Earned income credit: $1,955 (reported on 16.0% of returns)
Here:
$1,955
State:
$2,074
(% of AGI for various income ranges: 79.4% for AGIs below $25k, 66.2% for AGIs $25k-50k, 0.7% for AGIs $50k-75k)
Percentage of individuals using paid preparers for their 2020 taxes: 91.8%
Here:
92%
State:
92%
(% for various income ranges: 90.3% for AGIs below $25k, 92.4% for AGIs $25k-50k, 92.0% for AGIs $50k-75k, 93.0% for AGIs $75k-100k, 93.1% for AGIs $100k-200k, 92.9% for AGIs over 200k)
Averages for the 2012 tax year for zip code 91722, filed in 2013:
Average Adjusted Gross Income (AGI) in 2012: $44,975 (Individual Income Tax Returns)
Here:
$44,975
State:
$72,726
Salary/wage: $43,421 (reported on 87.1% of returns)
Here:
$43,421
State:
$59,079
(% of AGI for various income ranges: 76.0% for AGIs below $25k, 84.6% for AGIs $25k-50k, 86.6% for AGIs $50k-75k, 87.0% for AGIs $75k-100k, 86.8% for AGIs $100k-200k, 58.6% for AGIs over 200k)
Taxable interest for individuals: $457 (reported on 30.2% of returns)
This zip code:
$457
California:
$2,146
(% of AGI for various income ranges: 0.5% for AGIs below $25k, 0.3% for AGIs $25k-50k, 0.2% for AGIs $50k-75k, 0.2% for AGIs $75k-100k, 0.3% for AGIs $100k-200k, 0.9% for AGIs over 200k)
Ordinary dividends: $1,792 (reported on 8.6% of returns)
Here:
$1,792
State:
$9,308
(% of AGI for various income ranges: 0.4% for AGIs below $25k, 0.4% for AGIs $25k-50k, 0.2% for AGIs $50k-75k, 0.3% for AGIs $75k-100k, 0.3% for AGIs $100k-200k, 1.0% for AGIs over 200k)
Net capital gain/loss in AGI: +$2,710 (reported on 6.5% of returns)
Here:
+$2,710
State:
+$30,460
(% of AGI for various income ranges: 0.1% for AGIs $50k-75k, 0.1% for AGIs $75k-100k, 0.3% for AGIs $100k-200k, 7.3% for AGIs over 200k)
Profit/loss from business: +$8,796 (reported on 14.4% of returns)
Here:
+$8,796
State:
+$17,064
(% of AGI for various income ranges: 10.2% for AGIs below $25k, 3.5% for AGIs $25k-50k, 1.4% for AGIs $50k-75k, 1.7% for AGIs $75k-100k, 1.2% for AGIs $100k-200k)
Taxable individual retirement arrangement distribution: $11,570 (reported on 5.0% of returns)
91722:
$11,570
California:
$19,557
(% of AGI for various income ranges: 1.5% for AGIs below $25k, 1.5% for AGIs $25k-50k, 1.1% for AGIs $50k-75k, 1.0% for AGIs $75k-100k, 1.6% for AGIs $100k-200k)
Total itemized deductions: $22,111 (29% of AGI, reported on 35.4% of returns)
Here:
$22,111
State:
$34,004
Here:
29.3% of AGI
State:
22.7% of AGI
(% of AGI for various income ranges: 8.3% for AGIs below $25k, 14.2% for AGIs $25k-50k, 19.4% for AGIs $50k-75k, 20.8% for AGIs $75k-100k, 20.5% for AGIs $100k-200k, 15.9% for AGIs over 200k)
Charity contributions: $2,323 (reported on 29.9% of returns)
Here:
$2,323
State:
$4,659
(% of AGI for various income ranges: 0.5% for AGIs below $25k, 1.2% for AGIs $25k-50k, 1.7% for AGIs $50k-75k, 1.9% for AGIs $75k-100k, 1.9% for AGIs $100k-200k, 2.1% for AGIs over 200k)
Taxes paid: $6,536 (reported on 35.4% of returns)
91722:
$6,536
State:
$14,448
(% of AGI for various income ranges: 1.7% for AGIs below $25k, 3.1% for AGIs $25k-50k, 5.2% for AGIs $50k-75k, 6.2% for AGIs $75k-100k, 7.2% for AGIs $100k-200k, 8.8% for AGIs over 200k)
Earned income credit: $2,246 (reported on 21.0% of returns)
Here:
$2,246
State:
$2,286
(% of AGI for various income ranges: 6.9% for AGIs below $25k, 1.2% for AGIs $25k-50k)
Percentage of individuals using paid preparers for their 2012 taxes: 69.2%
Here:
69%
State:
64%
(% for various income ranges: 65.8% for AGIs below $25k, 70.0% for AGIs $25k-50k, 70.8% for AGIs $50k-75k, 73.6% for AGIs $75k-100k, 73.9% for AGIs $100k-200k, 77.8% for AGIs over 200k)
Averages for the 2004 tax year for zip code 91722, filed in 2005:
Average Adjusted Gross Income (AGI) in 2004: $39,741 (Individual Income Tax Returns)
Here:
$39,741
State:
$58,600
Salary/wage: $39,090 (reported on 88.2% of returns)
Here:
$39,090
State:
$49,455
(% of AGI for various income ranges: 97.5% for AGIs below $10k, 79.9% for AGIs $10k-25k, 87.8% for AGIs $25k-50k, 89.0% for AGIs $50k-75k, 90.8% for AGIs $75k-100k, 81.3% for AGIs over 100k)
Taxable interest for individuals: $683 (reported on 39.5% of returns)
This zip code:
$683
California:
$2,365
(% of AGI for various income ranges: 3.2% for AGIs below $10k, 1.1% for AGIs $10k-25k, 0.6% for AGIs $25k-50k, 0.4% for AGIs $50k-75k, 0.4% for AGIs $75k-100k, 0.9% for AGIs over 100k)
Taxable dividends: $1,044 (reported on 11.9% of returns)
Here:
$1,044
State:
$4,746
(% of AGI for various income ranges: 1.2% for AGIs below $10k, 0.4% for AGIs $10k-25k, 0.3% for AGIs $25k-50k, 0.2% for AGIs $50k-75k, 0.3% for AGIs $75k-100k, 0.4% for AGIs over 100k)
Net capital gain/loss: +$4,649 (reported on 8.5% of returns)
Here:
+$4,649
State:
+$23,418
(% of AGI for various income ranges: -1.3% for AGIs below $10k, -0.0% for AGIs $10k-25k, 0.2% for AGIs $25k-50k, 0.2% for AGIs $50k-75k, 0.5% for AGIs $75k-100k, 4.4% for AGIs over 100k)
Profit/loss from business: +$8,334 (reported on 14.2% of returns)
Here:
+$8,334
State:
+$16,826
(% of AGI for various income ranges: 8.3% for AGIs below $10k, 7.1% for AGIs $10k-25k, 3.5% for AGIs $25k-50k, 2.2% for AGIs $50k-75k, 1.4% for AGIs $75k-100k, 1.9% for AGIs over 100k)
IRA payment deduction: $2,860 (reported on 2.2% of returns)
91722:
$2,860
California:
$3,192
(% of AGI for various income ranges: 0.2% for AGIs $10k-25k, 0.2% for AGIs $25k-50k, 0.2% for AGIs $50k-75k, 0.1% for AGIs $75k-100k, 0.2% for AGIs over 100k)
Self-employed pension: $10,739 (reported on 0.2% of returns)
Here:
$10,739
California:
$17,688
Total itemized deductions: $20,582 (32% of AGI, reported on 41.1% of returns)
Here:
$20,582
State:
$28,113
Here:
32.3% of AGI
State:
25.3% of AGI
(% of AGI for various income ranges: 13.4% for AGIs below $10k, 11.4% for AGIs $10k-25k, 20.0% for AGIs $25k-50k, 24.1% for AGIs $50k-75k, 24.3% for AGIs $75k-100k, 23.0% for AGIs over 100k)
Charity contributions deductions: $2,399 (4% of AGI, reported on 37.0% of returns)
Here:
$2,399
State:
$3,923
Here:
3.6% of AGI
State:
3.3% of AGI
(% of AGI for various income ranges: 0.6% for AGIs below $10k, 0.9% for AGIs $10k-25k, 1.9% for AGIs $25k-50k, 2.5% for AGIs $50k-75k, 2.7% for AGIs $75k-100k, 2.8% for AGIs over 100k)
Total tax: $4,186 (reported on 73.4% of returns)
91722:
$4,186
State:
$10,761
(% of AGI for various income ranges: 3.2% for AGIs below $10k, 4.0% for AGIs $10k-25k, 5.8% for AGIs $25k-50k, 7.2% for AGIs $50k-75k, 8.4% for AGIs $75k-100k, 13.1% for AGIs over 100k)
Earned income credit: $1,722 (reported on 17.3% of returns)
Here:
$1,722
State:
$1,763
Percentage of individuals using paid preparers for their 2004 taxes: 70.5%
Here:
71%
State:
66%
(% for various income ranges: 59.4% for AGIs below $10k, 70.0% for AGIs $10k-25k, 72.2% for AGIs $25k-50k, 75.5% for AGIs $50k-75k, 73.9% for AGIs $75k-100k, 77.6% for AGIs over 100k)
Likely homosexual households (counted as self-reported same-sex unmarried-partner households)
Lesbian couples: 0.9% of all households
Gay men: 0.0% of all households
Household received Food Stamps/SNAP in the past 12 months: 1,234 Household did not receive Food Stamps/SNAP in the past 12 months: 8,952
Women who had a birth in the past 12 months: 350 (179 now married, 173 unmarried) Women who did not have a birth in the past 12 months: 7,647 (3,021 now married, 4,626 unmarried)
Housing units in zip code 91722 with a mortgage: 5,112 (315 second mortgage, 28 home equity loan, 224 both second mortgage and home equity loan) Houses without a mortgage: 138
Median monthly owner costs for units with a mortgage: $2,449 Median monthly owner costs for units without a mortgage: $597
Residents with income below the poverty level in 2022:
This zip code:
6.7%
Whole state:
12.2%
Residents with income below 50% of the poverty level in 2022:
This zip code:
2.0%
Whole state:
6.2%
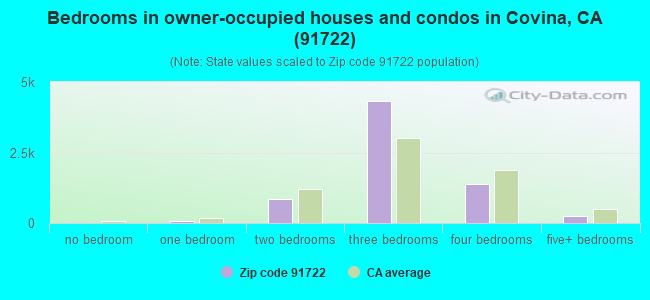
Median number of rooms in houses and condos:
Here:
5.8
State:
6.0
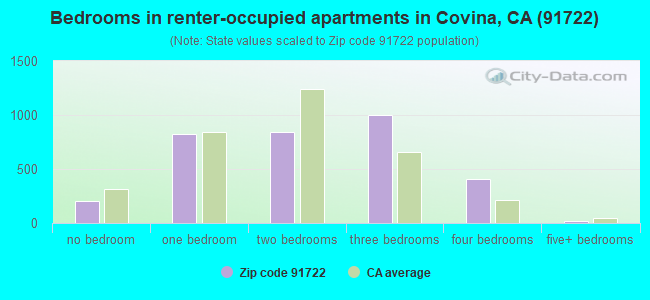
Median number of rooms in apartments:
Here:
4.4
State:
3.9
Notable locations in this zip code not listed on our city pages
Shopping Centers: Irwindale Square Shopping Center (1), Covina Village Shopping Center (2), Covina Town Square Shopping Center (3), Covina Square Shopping Center (4). Display/hide their locations on the map
Churches in zip code 91722 include: Church of Christ (A), Covina Church of Christ (B), Unity Church of the Foothills (C), Saint John Lutheran Church (D). Display/hide their locations on the map
3,823 married couples with children.
1,708 single-parent households (360 men, 1,348 women).
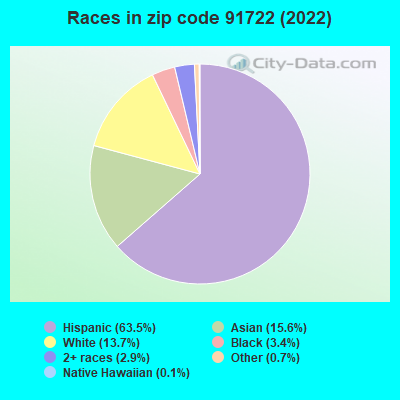
44.7% of residents of 91722 zip code speak English at home.
41.4% of residents speak Spanish at home (69% very well, 13% well, 13% not well, 6% not at all).
1.0% of residents speak other Indo-European language at home (85% very well, 11% well, 4% not well).
12.1% of residents speak Asian or Pacific Island language at home (43% very well, 29% well, 21% not well, 7% not at all).
0.7% of residents speak other language at home (42% very well, 40% well, 18% not at all).
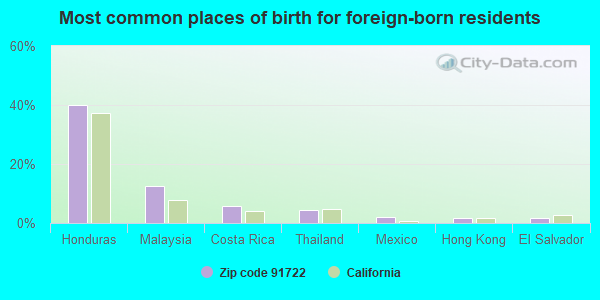
Foreign born population: 10,345 (30.3%) (66.7% of them are naturalized citizens)
This zip code:
30.3%
Whole state:
26.7%
40%Honduras
13%Malaysia
6%Costa Rica
4%Thailand
2%Mexico
2%Hong Kong
2%El Salvador
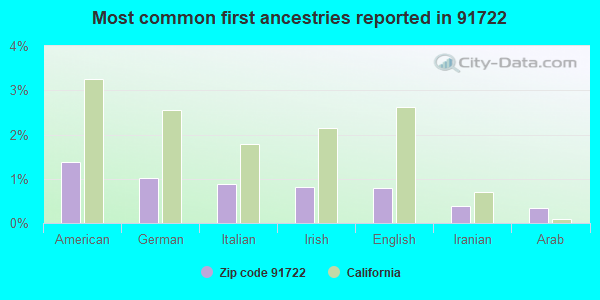
1%American
1%German
1%Italian
1%Irish
1%English
0%Iranian
0%Arab
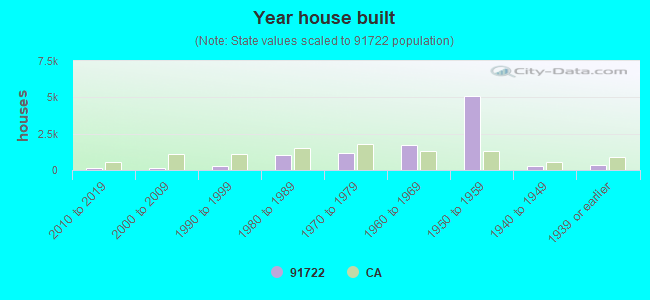
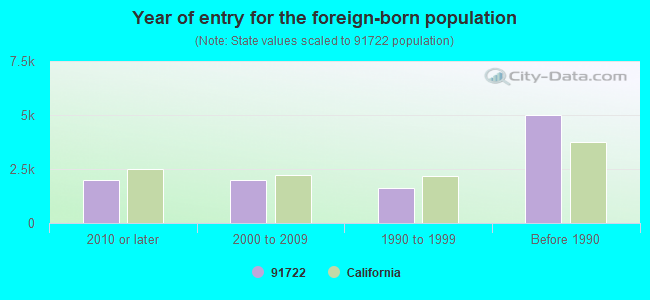
Year of entry for the foreign-born population
1,9772010 or later
1,9872000 to 2009
1,6311990 to 1999
5,005Before 1990
Major facilities with environmental interests located in this zip code:
NORTHVIEW HIGH SCHOOL (1016 WEST CYPRESS in COVINA, CA)
STATE MASTER (California - Hazardous Waste Tracking) - HAZARDOU WASTE PROGRAM (National Center for Education Statistics) - STATE ID-1936418 (Resource Conservation and Recovery Act (tracking hazardous waste)) Small Quantity Generators, between 100 kg and 1000 kg of hazardous waste/month (Resource Conservation and Recovery Act (tracking hazardous waste)) - notification Organizations: COVINA VALLEY USD (CONTACT/OWNER)
, COVINA VALLEY SCHOOL DISTRICT (CONTACT/OWNER)
, COVINA-VALLEY UNIFIED (SCHOOL DISTRICT)
Alternative names: COVINA VALLEY USD NORTHVIEW HIGH SCH
MEDSEP CORPORATION (1630 INDUSTRIAL PARK ST. in COVINA, CA)
STATE MASTER (California - Hazardous Waste Tracking) - HAZARDOU WASTE PROGRAM CRITERIA AND HAZARDOUS AIR POLLUTANT INVENTORY (Inventory of air pollution sources) Small Quantity Generators, between 100 kg and 1000 kg of hazardous waste/month (Resource Conservation and Recovery Act (tracking hazardous waste)) - notification TRI REPORTER (Tracking of toxic chemicals releasing facilities) Business SIC classification: SURGICAL AND MEDICAL INSTRUMENTS AND APPARATUS Business NAICS classification: SURGICAL AND MEDICAL INSTRUMENT MANUFACTURING. Organizations: PALL CORP (CONTACT/OWNER)
1-DAY PAINT & BODY CENTERS INC (645 N GRAND AVE in COVINA, CA)
STATE MASTER (California - Hazardous Waste Tracking) - HAZARDOU WASTE PROGRAM CRITERIA AND HAZARDOUS AIR POLLUTANT INVENTORY (Inventory of air pollution sources) Small Quantity Generators, between 100 kg and 1000 kg of hazardous waste/month (Resource Conservation and Recovery Act (tracking hazardous waste)) Business SIC classification: TOP, BODY, AND UPHOLSTERY REPAIR SHOPS AND PAINT SHOPS Business NAICS classification: AUTOMOTIVE BODY, PAINT, AND INTERIOR REPAIR AND MAINTENANCE.
ACE CLEANERS (310 N AZUSA AVE in COVINA, CA)
STATE MASTER (California - Hazardous Waste Tracking) - HAZARDOU WASTE PROGRAM Small Quantity Generators, between 100 kg and 1000 kg of hazardous waste/month (Resource Conservation and Recovery Act (tracking hazardous waste)) - notification Organizations: PETER HONG (CONTACT/OWNER)
JES DISC GRINDING INC (781 W FRONT ST in COVINA, CA)
STATE MASTER (California - Hazardous Waste Tracking) - HAZARDOU WASTE PROGRAM Small Quantity Generators, between 100 kg and 1000 kg of hazardous waste/month (Resource Conservation and Recovery Act (tracking hazardous waste)) - notification Business NAICS classification: OTHER COMMERCIAL AND SERVICE INDUSTRY MACHINERY MANUFACTURING. Organizations: JOHN E SCHMIDT (CONTACT/OWNER)
NEILSON PRESS INC (692 ARROWGRAND CIRCLE in COVINA, CA)
STATE MASTER (California - Hazardous Waste Tracking) - HAZARDOU WASTE PROGRAM Small Quantity Generators, between 100 kg and 1000 kg of hazardous waste/month (Resource Conservation and Recovery Act (tracking hazardous waste)) - notification Business NAICS classification: COMMERCIAL LITHOGRAPHIC PRINTING. Organizations: AL VASQUEZ (CONTACT/OWNER)
ALICE M ELLINGTON ELEMENTARY SCHOOL (5034 NORTH CLYDEBANK in COVINA, CA)
(Geographic Names Information System) (National Center for Education Statistics) - STATE ID-6011217 Organizations: AZUSA UNIFIED (SCHOOL DISTRICT)
Alternative names: ELLINGTON (ALICE M.) ELEMENTARY
HARRELLS TRANSMISSION (19062 E ARROW HWY in COVINA, CA)
STATE MASTER (California - Hazardous Waste Tracking) - HAZARDOU WASTE PROGRAM Small Quantity Generators, between 100 kg and 1000 kg of hazardous waste/month (Resource Conservation and Recovery Act (tracking hazardous waste)) - notification
JOHN W POTTER INC (1476 W INDUSTRIAL PARK ST in COVINA, CA)
STATE MASTER (California - Hazardous Waste Tracking) - HAZARDOU WASTE PROGRAM Small Quantity Generators, between 100 kg and 1000 kg of hazardous waste/month (Resource Conservation and Recovery Act (tracking hazardous waste)) - notification Business NAICS classification: BARE PRINTED CIRCUIT BOARD MANUFACTURING.
NEW IMAGE DRYCLEANER (201 N GRAND AVE in COVINA, CA)
STATE MASTER (California - Hazardous Waste Tracking) - HAZARDOU WASTE PROGRAM Small Quantity Generators, between 100 kg and 1000 kg of hazardous waste/month (Resource Conservation and Recovery Act (tracking hazardous waste)) Alternative names: NEW IMAGE CLEANERS
FAIR VALLEY HIGH (CONT.) (231 E. STEPHANIE DR. in COVINA, CA)
(National Center for Education Statistics) - STATE ID-1931617 Organizations: COVINA-VALLEY UNIFIED (SCHOOL DISTRICT)
GLADSTONE HIGH (1340 N. ENID in COVINA, CA)
(National Center for Education Statistics) - STATE ID-1933449 Organizations: AZUSA UNIFIED (SCHOOL DISTRICT)
LARK ELLEN ELEMENTARY (4555 N. LARK ELLEN AVE. in COVINA, CA)
(National Center for Education Statistics) - STATE ID-6012520 Organizations: COVINA-VALLEY UNIFIED (SCHOOL DISTRICT)
Housing units lacking complete plumbing facilities: 0.8% Housing units lacking complete kitchen facilities: 2.4%
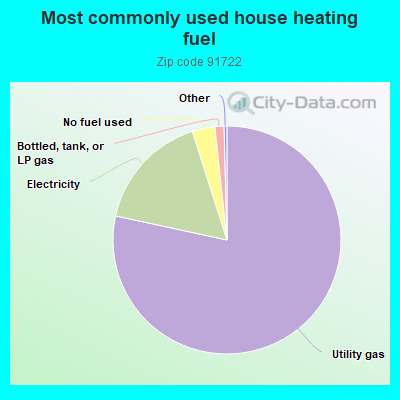
78.4%Utility gas
16.7%Electricity
3.2%No fuel used
1.3%Bottled, tank, or LP gas
Population in 1990: 31,703. Population change in the 1990s: +2,100 (+6.6%).
Place of birth for U.S.-born residents:
This state: 21,366
Northeast: 394
Midwest: 794
South: 665
West: 352
57% of the 91722 zip code residents lived in the same house 5 years ago. Out of people who lived in different houses, 86% lived in this county. Out of people who lived in different counties, 50% lived in California.
93% of the 91722 zip code residents lived in the same house 1 year ago. Out of people who lived in different houses, 79% moved from this county. Out of people who lived in different houses, 6% moved from different county within same state. Out of people who lived in different houses, 6% moved from different state. Out of people who lived in different houses, 9% moved from abroad.
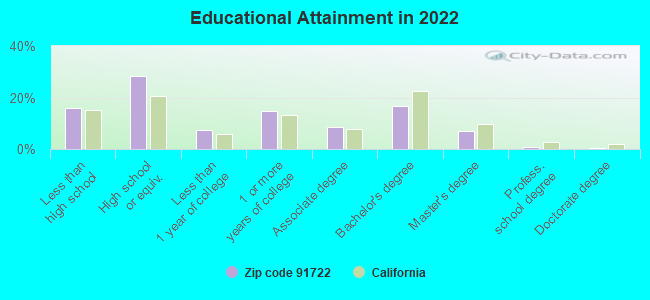
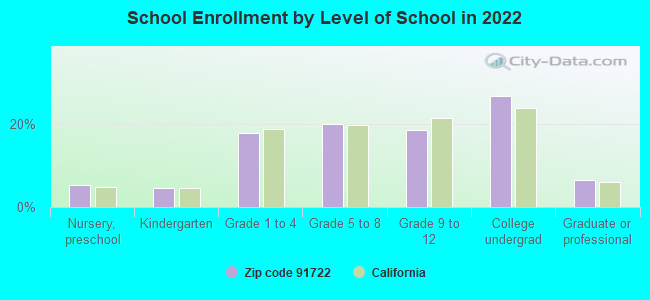
Private vs. public school enrollment:
Students in private schools in grades 1 to 8 (elementary and middle school): 396
Here:
12.9%
California:
10.5%
Students in private schools in grades 9 to 12 (high school): 140
Here:
9.4%
California:
8.5%
Students in private undergraduate colleges: 257
Here:
11.9%
California:
15.9%
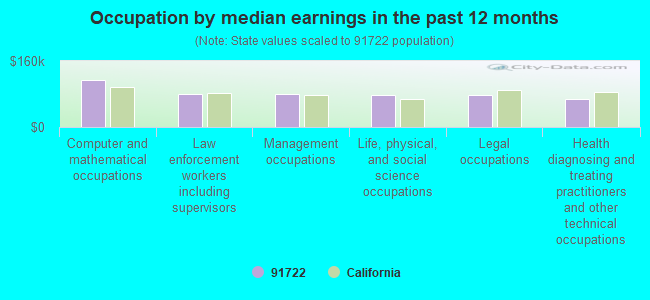
Occupation by median earnings in the past 12 months ($)
114,828Computer and mathematical occupations
80,417Law enforcement workers including supervisors
80,267Management occupations
77,848Life, physical, and social science occupations
76,388Legal occupations
68,890Health diagnosing and treating practitioners and other technical occupations
Companies with biggest federal contracts located in this zip code (COVINA, CA):
CEC VIBRATION PRODUCTS INC (CEC VIBRATION PRODUCTS INC; small business) : $3,576,440 in 64 contractsfrom 1999 to 2006
Contracts for Combination and Miscellaneous Instruments, Electrical and Electronic assemblies, Boards, Cards, and Associated Hardware, Engine Instruments, Electrical and Electronic Properties Measuring and Testing Instruments, and moreby Navy, Defense Logistics Agency, Air Force, Army, and others Signed by year:2000: $125,092; 2001: $236,231; 2002: $546,911; 2003: $467,419; 2004: $591,596; 2005: $945,148; 2006: $431,151.
Biggest contracts:
$458,385 with Navy for Combination and Miscellaneous Instruments. Signed on 2005-03-14. Completion date: 2005-07-14.
$329,120 with Navy for Electrical and Electronic assemblies, Boards, Cards, and Associated Hardware. Signed on 2006-01-05. Completion date: 2006-08-08.
$303,246 with Navy for Combination and Miscellaneous Instruments. Signed on 2003-06-06. Completion date: 2005-01-26.
$262,482, same as above.Signed on 2002-04-03. Completion date: 2002-12-31.
SENSORTRONICS INC (677 ARROW GRAND CIR; small business) : $1,010,523 in 10 contractsfrom 1999 to 2001
Contracts for Electrical and Electronic Properties Measuring and Testing Instruments, Combination and Miscellaneous Instruments, Aircraft Maintenance and Repair Shop Specialized Equipment, Miscellaneous Communication Equipment, and moreby Navy, Army Signed by year:2000: $442,275; 2001: $295,193; 2002: $0; 2003: $0; 2004: $0; 2005: $0; 2006: $0.
Biggest contracts:
$204,372 with Navy for Electrical and Electronic Properties Measuring and Testing Instruments. Signed on 1999-12-02. Completion date: 2000-06-05.
$179,270 with Navy for Combination and Miscellaneous Instruments. Signed on 2001-03-21. Completion date: 2001-07-21.
$145,600, same as above.Signed on 2000-08-31. Completion date: 2001-01-29.
$144,688 with Army for Aircraft Maintenance and Repair Shop Specialized Equipment. Signed on 2000-04-28. Completion date: 2001-03-08.
CEC VIBRATION PRODUCTS, INC (746 ARROW GRAND CIR; small business) 500 employees, $0 revenue. Veteran Owned Business: $972,239 in 29 contractsfrom 2004 to 2006
Contracts for Engine Instruments, Aircraft Maintenance and Repair Shop Specialized Equipment, Combination and Miscellaneous Instruments, Electrical and Electronic Properties Measuring and Testing Instruments, and moreby Defense Logistics Agency, Air Force, Navy, Federal Supply Service, and others Signed by year:2000: $0; 2001: $0; 2002: $0; 2003: $0; 2004: $193,446; 2005: $139,896; 2006: $638,897.
Biggest contracts:
$336,368 with Defense Logistics Agency for Engine Instruments. Signed on 2006-02-17. Completion date: 2007-05-13.
$118,895 with Air Force for Aircraft Maintenance and Repair Shop Specialized Equipment. Signed on 2006-04-07. Completion date: 2007-01-29.
$109,925 with Navy for Combination and Miscellaneous Instruments. Signed on 2006-07-06. Completion date: 2007-12-06.
$100,056 with Defense Logistics Agency for Electrical and Electronic Properties Measuring and Testing Instruments. Signed on 2004-11-01. Completion date: 2005-06-03.
R M BAKER MACHINE & TOOL INC (815 W FRONT ST; small business) : $194,180 in 8 contractsfrom 2003 to 2006
Contracts for Boxes, Cartons, and Crates, Building Components, Prefabricated, Plastics Fabricated Materials, Miscellaneous Machine Tools by Navy Signed by year:2000: $0; 2001: $0; 2002: $0; 2003: $54,473; 2004: $92,319; 2005: $46,001; 2006: $1,387.
Biggest contracts:
$56,500 with Navy for Boxes, Cartons, and Crates. Signed on 2004-03-30. Completion date: 2004-06-14.
$54,473 with Navy for Building Components, Prefabricated. Signed on 2003-03-05. Completion date: 2003-05-16.
$37,517 with Navy for Plastics Fabricated Materials. Signed on 2005-09-20. Completion date: 2005-12-16.
$27,343 with Navy for Miscellaneous Machine Tools. Signed on 2004-08-24. Completion date: 2004-11-10.
ALL-PACK-CO INC (718 ARROW GRAND CIR; small business)
$37,800 with Navy for Office Supplies. Signed on 1999-12-15. Completion date: 2000-09-30.
HERTZ EQUIPMENT RENTAL CORPORA (19034 E ARROW HWY; small business) : $27,812 in 2 contractsfrom 1999 to 2003
$28,188 with Army for Lease or Rental of Equipment -- Plumbing, Heating, and Waste Disposal Equipment. Signed on 1999-12-31. Completion date: 2000-02-15.
-$376 with Army for Training Aids. Signed on 2003-01-17. Completion date: 2000-02-15.
SOS MEDICAL (740 E ARROW HWY STE D; small business) : $23,590 in 6 contractsfrom 2004 to 2006
Contracts for Medical and Surgical Instruments, Equipment, and Supplies, Maintenance, Repair and Rebuilding of Equipment -- Medical, Dental, and Veterinary Equipment and Supplies by Navy Signed by year:2000: $0; 2001: $0; 2002: $0; 2003: $0; 2004: $19,865; 2005: $0; 2006: $3,725.
Biggest contracts:
$8,120 with Navy for Medical and Surgical Instruments, Equipment, and Supplies. Signed on 2004-01-29. Completion date: 2004-02-27.
$4,160, same as above.Signed on 2004-05-07. Completion date: 2004-06-07.
$3,795, same as above.Signed on 2004-03-23. Completion date: 2004-04-20.
$3,790, same as above.Signed on 2004-06-22. Completion date: 2004-07-09.
PAYNE MAGNETICS, INC (854 W FRONT STREET) : $22,525 in 2 contractsfrom 2005 to 2006
$19,142 with Navy for Coils and Transformers. Signed on 2005-02-28. Completion date: 2005-05-13.
$3,383 with Defense Logistics Agency for Coils and Transformers. Signed on 2006-06-12. Completion date: 2006-08-21.
MONTEREY MACHINE PRODUCTS (1504-A INDUSTRIAL PARK STR; small business) 500 employees, $0 revenue. : $5,515 in 2 contractsfrom 2004 to 2005
$2,875 with Defense Logistics Agency for Aircraft Maintenance and Repair Shop Specialized Equipment. Signed on 2004-10-28. Completion date: 2005-01-27.
$2,640 with Defense Logistics Agency for Gas Turbines and Jet Engines, Aircraft; Prime Moving, and Components. Signed on 2005-01-27. Completion date: 2005-11-01.
VISHAY TRANSDUCERS LTD (677 ARROW GRAND CIR) : $4,739 in 2 contractsin 2005
$4,780 with Army for Electrical and Electronic Properties Measuring and Testing Instruments. Signed on 2005-01-28. Completion date: 2005-03-28.
-$41, same as above.Signed on 2005-12-29. Completion date: 2005-03-28.
Top industries in this zip code by the number of employees in 2005:


 Nearest zip codes: 91723, 91791, 91790, 91724, 91740, 91706.