Estimated zip code population in 2022: 26,905 Zip code population in 2010: 25,356 Zip code population in 2000: 25,117
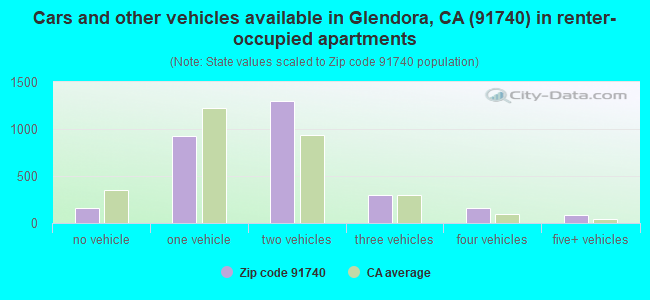
Houses and condos: 8,730 Renter-occupied apartments: 2,951
% of renters here:
35%
State:
44%
March 2022 cost of living index in zip code 91740: 133.3 (high, U.S. average is 100)
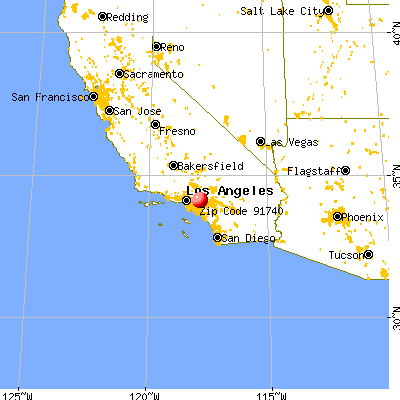
Land area: 5.0 sq. mi. Water area: 0.0 sq. mi.
Population density: 5,405 people per square mile
(average).
OSM Map
General Map
Google Map
MSN Map
OSM Map
General Map
Google Map
MSN Map
OSM Map
General Map
Google Map
MSN Map
OSM Map
General Map
Google Map
MSN Map
Please wait while loading the map...
Real estate property taxes paid for housing units in 2022:
This zip code:
0.6% ($4,256)
California:
0.7% ($4,831)
Median real estate property taxes paid for housing units with mortgages in 2022: $4,739 (0.7%) Median real estate property taxes paid for housing units with no mortgage in 2022: $3,433 (0.5%)
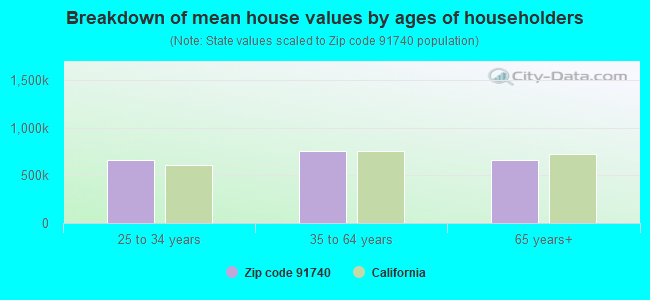
Estimated median house/condo value in 2022: $702,544
91740:
$702,544
California:
$715,900
According to our research of California and other state lists, there were 25 registered sex offenders living in 91740 zip code as of April 27, 2024. The ratio of all residents to sex offenders in zip code 91740 is 1,077 to 1. The ratio of registered sex offenders to all residents in this zip code is lower than the state average.
Median resident age:
This zip code:
38.6 years
California median age:
37.9 years
Average household size:
This zip code:
3.0 people
California:
2.8 people
Averages for the 2020 tax year for zip code 91740, filed in 2021:
Average Adjusted Gross Income (AGI) in 2020: $68,774 (Individual Income Tax Returns)
Here:
$68,774
State:
$95,910
Salary/wage: $63,548 (reported on 80.3% of returns)
Here:
$63,548
State:
$77,331
(% of AGI for various income ranges: 1148.7% for AGIs below $25k, 3776.7% for AGIs $25k-50k, 7260.8% for AGIs $50k-75k, 10818.8% for AGIs $75k-100k, 20911.1% for AGIs $100k-200k, 74682.0% for AGIs over 200k)
Taxable interest for individuals: $1,094 (reported on 36.4% of returns)
This zip code:
$1,094
California:
$2,294
(% of AGI for various income ranges: 17.9% for AGIs below $25k, 23.4% for AGIs $25k-50k, 42.8% for AGIs $50k-75k, 59.8% for AGIs $75k-100k, 87.1% for AGIs $100k-200k, 1428.0% for AGIs over 200k)
Ordinary dividends: $3,948 (reported on 15.2% of returns)
Here:
$3,948
State:
$10,949
(% of AGI for various income ranges: 20.0% for AGIs below $25k, 33.8% for AGIs $25k-50k, 66.2% for AGIs $50k-75k, 68.5% for AGIs $75k-100k, 193.6% for AGIs $100k-200k, 1876.0% for AGIs over 200k)
Net capital gain/loss in AGI: +$9,938 (reported on 15.3% of returns)
Here:
+$9,938
State:
+$49,306
(% of AGI for various income ranges: 1.1% for AGIs below $25k, 11.3% for AGIs $25k-50k, 61.3% for AGIs $50k-75k, 84.9% for AGIs $75k-100k, 297.8% for AGIs $100k-200k, 9722.7% for AGIs over 200k)
Profit/loss from business: +$11,021 (reported on 18.1% of returns)
Here:
+$11,021
State:
+$15,671
(% of AGI for various income ranges: 159.8% for AGIs below $25k, 235.4% for AGIs $25k-50k, 284.2% for AGIs $50k-75k, 244.8% for AGIs $75k-100k, 430.0% for AGIs $100k-200k, 4037.3% for AGIs over 200k)
Taxable individual retirement arrangement distribution: $17,961 (reported on 7.2% of returns)
91740:
$17,961
California:
$23,505
(% of AGI for various income ranges: 56.6% for AGIs below $25k, 87.3% for AGIs $25k-50k, 212.7% for AGIs $50k-75k, 251.3% for AGIs $75k-100k, 453.2% for AGIs $100k-200k, 2124.7% for AGIs over 200k)
Self-employed (Keogh) retirement plans: $31,633 (reported on 0.2% of returns)
91740:
$31,633
California:
$30,163
(% of AGI for various income ranges: 74.7% for AGIs $100k-200k)
Total itemized deductions: $32,878 (reported on 18.1% of returns)
Here:
$32,878
State:
$39,517
(% of AGI for various income ranges: 86.0% for AGIs below $25k, 227.9% for AGIs $25k-50k, 716.4% for AGIs $50k-75k, 1292.1% for AGIs $75k-100k, 2574.4% for AGIs $100k-200k, 12285.3% for AGIs over 200k)
Charity contributions: $6,741 (reported on 15.4% of returns)
Here:
$6,741
State:
$12,598
(% of AGI for various income ranges: 6.0% for AGIs below $25k, 28.4% for AGIs $25k-50k, 88.9% for AGIs $50k-75k, 173.8% for AGIs $75k-100k, 417.0% for AGIs $100k-200k, 3382.0% for AGIs over 200k)
Taxes paid: $8,690 (reported on 18.1% of returns)
91740:
$8,690
State:
$8,807
(% of AGI for various income ranges: 18.4% for AGIs below $25k, 62.0% for AGIs $25k-50k, 200.6% for AGIs $50k-75k, 403.6% for AGIs $75k-100k, 770.5% for AGIs $100k-200k, 2068.7% for AGIs over 200k)
Earned income credit: $1,857 (reported on 12.7% of returns)
Here:
$1,857
State:
$2,074
(% of AGI for various income ranges: 69.0% for AGIs below $25k, 61.5% for AGIs $25k-50k)
Percentage of individuals using paid preparers for their 2020 taxes: 92.4%
Here:
92%
State:
92%
(% for various income ranges: 91.3% for AGIs below $25k, 92.2% for AGIs $25k-50k, 92.9% for AGIs $50k-75k, 93.6% for AGIs $75k-100k, 92.9% for AGIs $100k-200k, 94.2% for AGIs over 200k)
Averages for the 2012 tax year for zip code 91740, filed in 2013:
Average Adjusted Gross Income (AGI) in 2012: $59,259 (Individual Income Tax Returns)
Here:
$59,259
State:
$72,726
Salary/wage: $53,822 (reported on 83.4% of returns)
Here:
$53,822
State:
$59,079
(% of AGI for various income ranges: 70.4% for AGIs below $25k, 78.1% for AGIs $25k-50k, 79.6% for AGIs $50k-75k, 81.1% for AGIs $75k-100k, 82.1% for AGIs $100k-200k, 54.0% for AGIs over 200k)
Taxable interest for individuals: $1,051 (reported on 37.6% of returns)
This zip code:
$1,051
California:
$2,146
(% of AGI for various income ranges: 1.1% for AGIs below $25k, 0.5% for AGIs $25k-50k, 0.5% for AGIs $50k-75k, 0.5% for AGIs $75k-100k, 0.7% for AGIs $100k-200k, 0.9% for AGIs over 200k)
Ordinary dividends: $4,734 (reported on 14.1% of returns)
Here:
$4,734
State:
$9,308
(% of AGI for various income ranges: 0.9% for AGIs below $25k, 0.6% for AGIs $25k-50k, 0.5% for AGIs $50k-75k, 0.8% for AGIs $75k-100k, 0.6% for AGIs $100k-200k, 3.8% for AGIs over 200k)
Net capital gain/loss in AGI: +$5,210 (reported on 11.3% of returns)
Here:
+$5,210
State:
+$30,460
(% of AGI for various income ranges: 0.4% for AGIs $100k-200k, 5.8% for AGIs over 200k)
Profit/loss from business: +$11,250 (reported on 16.9% of returns)
Here:
+$11,250
State:
+$17,064
(% of AGI for various income ranges: 11.0% for AGIs below $25k, 4.6% for AGIs $25k-50k, 2.5% for AGIs $50k-75k, 2.2% for AGIs $75k-100k, 1.8% for AGIs $100k-200k, 2.8% for AGIs over 200k)
Taxable individual retirement arrangement distribution: $14,015 (reported on 7.9% of returns)
91740:
$14,015
California:
$19,557
(% of AGI for various income ranges: 2.7% for AGIs below $25k, 2.5% for AGIs $25k-50k, 1.6% for AGIs $50k-75k, 2.1% for AGIs $75k-100k, 1.8% for AGIs $100k-200k, 1.0% for AGIs over 200k)
Self-employment retirement plans: $17,600 (reported on 0.4% of returns)
91740:
$17,600
California:
$24,530
Total itemized deductions: $27,540 (27% of AGI, reported on 40.1% of returns)
Here:
$27,540
State:
$34,004
Here:
26.8% of AGI
State:
22.7% of AGI
(% of AGI for various income ranges: 11.0% for AGIs below $25k, 14.4% for AGIs $25k-50k, 17.8% for AGIs $50k-75k, 20.4% for AGIs $75k-100k, 20.9% for AGIs $100k-200k, 20.3% for AGIs over 200k)
Charity contributions: $3,909 (reported on 34.9% of returns)
Here:
$3,909
State:
$4,659
(% of AGI for various income ranges: 0.6% for AGIs below $25k, 1.4% for AGIs $25k-50k, 1.8% for AGIs $50k-75k, 2.7% for AGIs $75k-100k, 2.3% for AGIs $100k-200k, 4.1% for AGIs over 200k)
Taxes paid: $9,115 (reported on 40.0% of returns)
91740:
$9,115
State:
$14,448
(% of AGI for various income ranges: 2.1% for AGIs below $25k, 3.1% for AGIs $25k-50k, 5.2% for AGIs $50k-75k, 6.1% for AGIs $75k-100k, 7.5% for AGIs $100k-200k, 9.1% for AGIs over 200k)
Earned income credit: $2,009 (reported on 16.0% of returns)
Here:
$2,009
State:
$2,286
(% of AGI for various income ranges: 5.4% for AGIs below $25k, 1.0% for AGIs $25k-50k)
Percentage of individuals using paid preparers for their 2012 taxes: 66.8%
Here:
67%
State:
64%
(% for various income ranges: 61.9% for AGIs below $25k, 66.7% for AGIs $25k-50k, 69.7% for AGIs $50k-75k, 71.2% for AGIs $75k-100k, 71.4% for AGIs $100k-200k, 81.0% for AGIs over 200k)
Averages for the 2004 tax year for zip code 91740, filed in 2005:
Average Adjusted Gross Income (AGI) in 2004: $51,163 (Individual Income Tax Returns)
Here:
$51,163
State:
$58,600
Salary/wage: $46,797 (reported on 85.0% of returns)
Here:
$46,797
State:
$49,455
(% of AGI for various income ranges: 120.3% for AGIs below $10k, 74.0% for AGIs $10k-25k, 82.4% for AGIs $25k-50k, 85.1% for AGIs $50k-75k, 87.3% for AGIs $75k-100k, 66.7% for AGIs over 100k)
Taxable interest for individuals: $1,220 (reported on 47.3% of returns)
This zip code:
$1,220
California:
$2,365
(% of AGI for various income ranges: 4.9% for AGIs below $10k, 2.0% for AGIs $10k-25k, 1.0% for AGIs $25k-50k, 0.8% for AGIs $50k-75k, 0.6% for AGIs $75k-100k, 1.3% for AGIs over 100k)
Taxable dividends: $2,477 (reported on 18.6% of returns)
Here:
$2,477
State:
$4,746
(% of AGI for various income ranges: 2.3% for AGIs below $10k, 0.8% for AGIs $10k-25k, 0.5% for AGIs $25k-50k, 0.3% for AGIs $50k-75k, 0.3% for AGIs $75k-100k, 1.6% for AGIs over 100k)
Net capital gain/loss: +$12,119 (reported on 13.1% of returns)
Here:
+$12,119
State:
+$23,418
(% of AGI for various income ranges: -2.1% for AGIs below $10k, -0.4% for AGIs $10k-25k, 0.3% for AGIs $25k-50k, 0.5% for AGIs $50k-75k, 0.5% for AGIs $75k-100k, 7.9% for AGIs over 100k)
Profit/loss from business: +$11,852 (reported on 16.9% of returns)
Here:
+$11,852
State:
+$16,826
(% of AGI for various income ranges: 7.6% for AGIs below $10k, 9.8% for AGIs $10k-25k, 4.4% for AGIs $25k-50k, 2.9% for AGIs $50k-75k, 2.7% for AGIs $75k-100k, 3.5% for AGIs over 100k)
IRA payment deduction: $3,225 (reported on 2.8% of returns)
91740:
$3,225
California:
$3,192
(% of AGI for various income ranges: 0.2% for AGIs $10k-25k, 0.3% for AGIs $25k-50k, 0.2% for AGIs $50k-75k, 0.2% for AGIs $75k-100k, 0.1% for AGIs over 100k)
Self-employed pension: $13,165 (reported on 0.7% of returns)
Here:
$13,165
California:
$17,688
(% of AGI for various income ranges: 0.1% for AGIs $25k-50k, 0.1% for AGIs $50k-75k, 0.1% for AGIs $75k-100k, 0.3% for AGIs over 100k)
Total itemized deductions: $25,055 (30% of AGI, reported on 45.3% of returns)
Here:
$25,055
State:
$28,113
Here:
29.8% of AGI
State:
25.3% of AGI
(% of AGI for various income ranges: 20.8% for AGIs below $10k, 13.8% for AGIs $10k-25k, 17.8% for AGIs $25k-50k, 23.4% for AGIs $50k-75k, 27.1% for AGIs $75k-100k, 22.9% for AGIs over 100k)
Charity contributions deductions: $3,849 (4% of AGI, reported on 41.4% of returns)
Here:
$3,849
State:
$3,923
Here:
4.4% of AGI
State:
3.3% of AGI
(% of AGI for various income ranges: 0.9% for AGIs below $10k, 1.2% for AGIs $10k-25k, 1.9% for AGIs $25k-50k, 2.6% for AGIs $50k-75k, 2.7% for AGIs $75k-100k, 4.6% for AGIs over 100k)
Total tax: $6,805 (reported on 78.7% of returns)
91740:
$6,805
State:
$10,761
(% of AGI for various income ranges: 4.8% for AGIs below $10k, 4.8% for AGIs $10k-25k, 6.7% for AGIs $25k-50k, 8.0% for AGIs $50k-75k, 8.9% for AGIs $75k-100k, 15.6% for AGIs over 100k)
Earned income credit: $1,591 (reported on 13.0% of returns)
Here:
$1,591
State:
$1,763
Percentage of individuals using paid preparers for their 2004 taxes: 68.3%
Here:
68%
State:
66%
(% for various income ranges: 56.6% for AGIs below $10k, 66.4% for AGIs $10k-25k, 69.0% for AGIs $25k-50k, 72.7% for AGIs $50k-75k, 72.4% for AGIs $75k-100k, 77.8% for AGIs over 100k)
Likely homosexual households (counted as self-reported same-sex unmarried-partner households)
Lesbian couples: 0.0% of all households
Gay men: 0.1% of all households
Household received Food Stamps/SNAP in the past 12 months: 969 Household did not receive Food Stamps/SNAP in the past 12 months: 7,545
Women who had a birth in the past 12 months: 171 (167 now married, 3 unmarried) Women who did not have a birth in the past 12 months: 6,390 (2,427 now married, 3,967 unmarried)
Housing units in zip code 91740 with a mortgage: 3,604 (307 second mortgage, 5 home equity loan, 237 both second mortgage and home equity loan) Houses without a mortgage: 46
Median monthly owner costs for units with a mortgage: $2,693 Median monthly owner costs for units without a mortgage: $753
Residents with income below the poverty level in 2022:
This zip code:
8.9%
Whole state:
12.2%
Residents with income below 50% of the poverty level in 2022:
This zip code:
4.1%
Whole state:
6.2%
Median number of rooms in houses and condos:
Here:
6.0
State:
6.0
Median number of rooms in apartments:
Here:
4.1
State:
3.9
Notable locations in this zip code not listed on our city pages
Shopping Centers: Glendora Marketplace Shopping Center (1), Lone Hill Shopping Center (2), Arrow Plaza Shopping Center (3). Display/hide their locations on the map
Parks in zip code 91740 include: Gladstone Park (1), Glen Dora Sports Park (2), South Hills Park (3), Dawson Park (4). Display/hide their locations on the map
3,670 married couples with children.
1,407 single-parent households (538 men, 869 women).
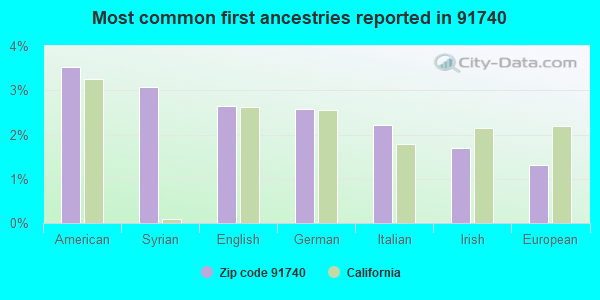
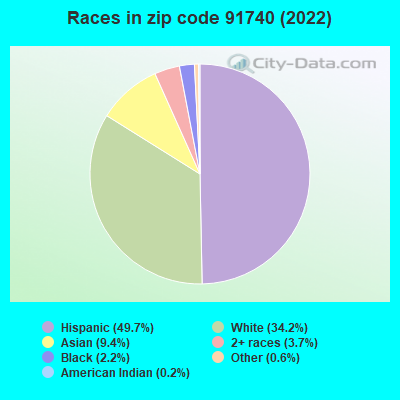
62.1% of residents of 91740 zip code speak English at home.
25.0% of residents speak Spanish at home (77% very well, 13% well, 7% not well, 3% not at all).
2.6% of residents speak other Indo-European language at home (68% very well, 20% well, 12% not well).
7.0% of residents speak Asian or Pacific Island language at home (63% very well, 20% well, 14% not well, 3% not at all).
3.4% of residents speak other language at home (41% very well, 24% well, 25% not well, 10% not at all).
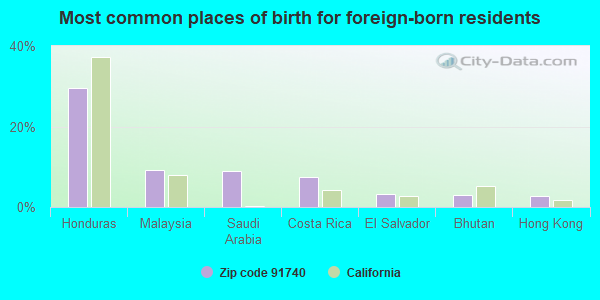
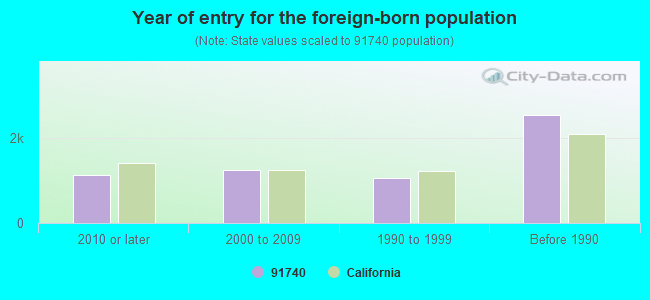
Foreign born population: 5,772 (21.5%) (65.8% of them are naturalized citizens)
Major facilities with environmental interests located in this zip code:
M2 COLLISION CARE CENTER (1947 AUTO CENTER DR in GLENDORA, CA)
STATE MASTER (California - Hazardous Waste Tracking) - HAZARDOU WASTE PROGRAM Small Quantity Generators, between 100 kg and 1000 kg of hazardous waste/month (Resource Conservation and Recovery Act (tracking hazardous waste)) Business NAICS classification: AUTOMOTIVE BODY, PAINT, AND INTERIOR REPAIR AND MAINTENANCE. Organizations: M2 AUTOMOTIVE INC (CONTACT/OPERATOR)
, COLLEY PURSUITS (CONTACT/OWNER)
LIGHTNING OIL CO (927 E MYRTLE AVE in GLENDORA, CA)
STATE MASTER (California - Hazardous Waste Tracking) - HAZARDOU WASTE PROGRAM TRANSPORTER (Resource Conservation and Recovery Act (tracking hazardous waste)) Organizations: SANTISTEVAN JOHN & LEDONNE (CONTACT/OWNER)
GLENDORA CITY OF (440 S LORAINE AVE in GLENDORA, CA)
STATE MASTER (California - Hazardous Waste Tracking) - HAZARDOU WASTE PROGRAM Small Quantity Generators, between 100 kg and 1000 kg of hazardous waste/month (Resource Conservation and Recovery Act (tracking hazardous waste)) - notification
GLENDORA USD (517 E LEMON AVE in GLENDORA, CA)
STATE MASTER (California - Hazardous Waste Tracking) - HAZARDOU WASTE PROGRAM Small Quantity Generators, between 100 kg and 1000 kg of hazardous waste/month (Resource Conservation and Recovery Act (tracking hazardous waste))
CERTIFIED AUTOMOTIVE SPECIALIST (476 S VERMONT AVE in GLENDORA, CA)
STATE MASTER (California - Hazardous Waste Tracking) - HAZARDOU WASTE PROGRAM Small Quantity Generators, between 100 kg and 1000 kg of hazardous waste/month (Resource Conservation and Recovery Act (tracking hazardous waste)) - notification Business NAICS classification: GENERAL AUTOMOTIVE REPAIR. Organizations: WEST COAST PROPERTIES (CONTACT/OWNER)
Alternative names: CERTIFIED AUTOMOTIVE SPECIALISTS INC
GLENDORA DODGE (931 S LONEHILL in GLENDORA, CA)
Small Quantity Generators, between 100 kg and 1000 kg of hazardous waste/month (Resource Conservation and Recovery Act (tracking hazardous waste)) - notification STATE MASTER (California - Used Oil Recycling System ) - USED OIL RECYCLING Organizations: DENNIS SILLETTO (CONTACT/OWNER)
HALLMARK METALS INC (600 W FOOTHILL BLVD in GLENDORA, CA)
STATE MASTER (California - Hazardous Waste Tracking) - HAZARDOU WASTE PROGRAM Small Quantity Generators, between 100 kg and 1000 kg of hazardous waste/month (Resource Conservation and Recovery Act (tracking hazardous waste)) Business NAICS classification: SHEET METAL WORK MANUFACTURING.
CALIFORNIA DAY FRESH FOODS INC (533 W FOOTHILL BL in GLENDORA, CA)
STATE MASTER (California - Hazardous Waste Tracking) - HAZARDOU WASTE PROGRAM Small Quantity Generators, between 100 kg and 1000 kg of hazardous waste/month (Resource Conservation and Recovery Act (tracking hazardous waste)) - notification Organizations: CHIQUITA BRANDS INTL (CONTACT/OWNER)
FULTON AUTOMOTIVE REPAIR (2021 E GLADSTONE ST NO 1 in GLENDORA, CA)
STATE MASTER (California - Hazardous Waste Tracking) - HAZARDOU WASTE PROGRAM Small Quantity Generators, between 100 kg and 1000 kg of hazardous waste/month (Resource Conservation and Recovery Act (tracking hazardous waste)) - notification Organizations: FULTON AUTO REPAIR (CONTACT/OWNER)
MILLIPART INC (412 W CARTER DR in GLENDORA, CA)
STATE MASTER (California - Hazardous Waste Tracking) - HAZARDOU WASTE PROGRAM Small Quantity Generators, between 100 kg and 1000 kg of hazardous waste/month (Resource Conservation and Recovery Act (tracking hazardous waste)) Business NAICS classification: OTHER COMMERCIAL AND SERVICE INDUSTRY MACHINERY MANUFACTURING.
GLENDORA CITY OF (116 E FOOTHILL BLVD in GLENDORA, CA)
(Resource Conservation and Recovery Act (tracking hazardous waste)) Organizations: CITY OF GLENDORA (CONTACT/OWNER)
EXXONMOBIL OIL CORP. (540 W ALOSTA AVE in GLENDORA, CA)
HAZARDOUS WASTE BIENNIAL REPORTER (Resource Conservation and Recovery Act (tracking hazardous waste)) Large Quantity Generators, more that 1000 kg of hazardous waste/month (Resource Conservation and Recovery Act (tracking hazardous waste)) Organizations: EXXONMOBIL OIL CORPORATION (CONTACT/OWNER)
1$ DRY CLEANER C CHEN E LEE (750 WEST ALOSTA UNIT K in GLENDORA, CA)
CRITERIA AND HAZARDOUS AIR POLLUTANT INVENTORY (Inventory of air pollution sources) Small Quantity Generators, between 100 kg and 1000 kg of hazardous waste/month (Resource Conservation and Recovery Act (tracking hazardous waste)) Business SIC classification: DRYCLEANING PLANTS, EXCEPT RUG CLEANING Alternative names: ONE DOLLAR CLEANER
Housing units lacking complete plumbing facilities: 1.1% Housing units lacking complete kitchen facilities: 1.6%
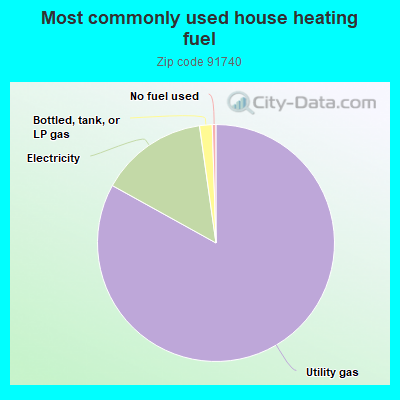
82.4%Utility gas
14.6%Electricity
1.7%Bottled, tank, or LP gas
0.5%No fuel used
Population in 1990: 48,836.
Place of birth for U.S.-born residents:
This state: 18,001
Northeast: 680
Midwest: 1,059
South: 615
West: 552
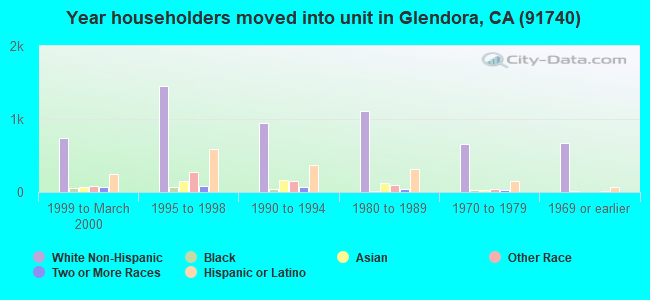
62% of the 91740 zip code residents lived in the same house 5 years ago. Out of people who lived in different houses, 79% lived in this county. Out of people who lived in different counties, 50% lived in California.
90% of the 91740 zip code residents lived in the same house 1 year ago. Out of people who lived in different houses, 80% moved from this county. Out of people who lived in different houses, 8% moved from different county within same state. Out of people who lived in different houses, 6% moved from different state. Out of people who lived in different houses, 3% moved from abroad.
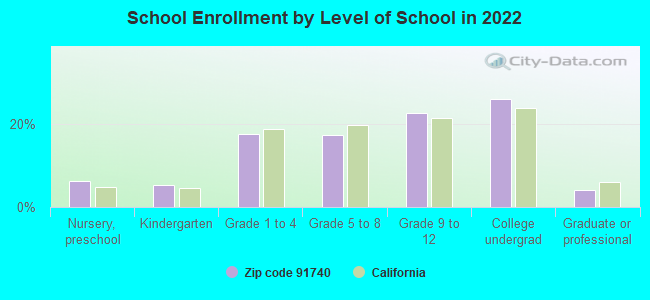
Private vs. public school enrollment:
Students in private schools in grades 1 to 8 (elementary and middle school): 383
Here:
15.6%
California:
10.5%
Students in private schools in grades 9 to 12 (high school): 246
Here:
15.5%
California:
8.5%
Students in private undergraduate colleges: 270
Here:
14.8%
California:
15.9%
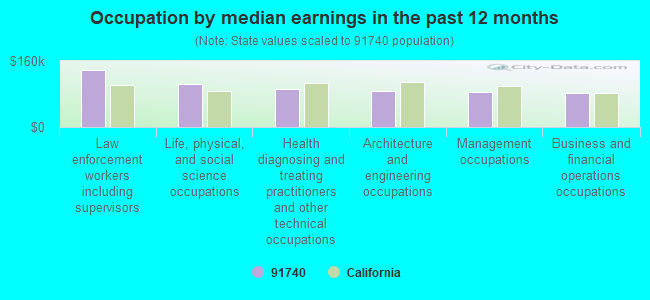
Occupation by median earnings in the past 12 months ($)
137,972Law enforcement workers including supervisors
103,944Life, physical, and social science occupations
91,049Health diagnosing and treating practitioners and other technical occupations
86,280Architecture and engineering occupations
85,564Management occupations
81,464Business and financial operations occupations
Companies with federal contracts located in this zip code (GLENDORA, CA):
HIRAKAWA INC (1822A E ROUTE 66; small business) : $61,366 in 5 contractsfrom 2003 to 2006
Contracts for Custodial Janitorial Services by Army Signed by year:2000: $0; 2001: $0; 2002: $0; 2003: $26,630; 2004: $0; 2005: $20,036; 2006: $14,700.
Biggest contracts:
$20,036 with Army for Custodial Janitorial Services. Signed on 2005-09-09. Completion date: 2006-01-31.
$20,036, same as above.Signed on 2003-03-08. Completion date: 2004-01-31.
$14,700, same as above.Signed on 2006-03-29. Completion date: 2006-01-31.
$6,594, same as above.Signed on 2003-01-05. Completion date: 2003-01-31.
MILLIPART, INC (412 W CARTER DR; small business) : $44,949 in 8 contractsfrom 2004 to 2006
Contracts for Studs, Aircraft Bombing Fire Control Components, Screws, Hose, Pipe, Tube, Lubrication, and Railing Fittings by Defense Logistics Agency Signed by year:2000: $0; 2001: $0; 2002: $0; 2003: $0; 2004: $3,784; 2005: $26,070; 2006: $15,095.
Biggest contracts:
$9,620 with Defense Logistics Agency for Studs. Signed on 2005-03-04. Completion date: 2005-05-28.
$8,310 with Defense Logistics Agency for Aircraft Bombing Fire Control Components. Signed on 2005-03-19. Completion date: 2005-07-28.
$7,474, same as above.Signed on 2006-03-24. Completion date: 2006-06-30.
$4,406 with Defense Logistics Agency for Screws. Signed on 2005-04-13. Completion date: 2005-06-13.
CALIFORNIA COMMERCIAL POOLS (2255 E. AUTO CENTRE DRIVE) : $43,093 in 3 contractsin 2000
$33,816 with Navy for Construction of Structures and Facilities -- Other Non-Building Facilities. Signed on 2000-07-24. Completion date: 2000-02-12.
$7,577, same as above.Signed on 2000-02-28. Completion date: 2000-02-12.
$1,700, same as above.Signed on 2000-05-15. Completion date: 2000-02-12.
SERCK SERVICES, INC (421 E US ROUTE 66) : $33,890 in 4 contractsin 2005
$11,000 with Navy for Maintenance, Repair and Rebuilding of Equipment -- Vehicular Equipment Components. Signed on 2005-03-09. Completion date: 2005-03-31.
$8,720 with Navy for Miscellaneous Engines and Components. Signed on 2005-09-27. Completion date: 2005-10-20.
$8,720 with Navy for Maintenance, Repair and Rebuilding of Equipment -- Engine Accessories. Signed on 2005-07-29. Completion date: 2005-08-19.
$5,450, same as above.Signed on 2005-09-07. Completion date: 2005-09-20.
JAMES MORAN (425 EAST ARROW HIGHWAY; small business)
$5,676 with Army for Custodial Janitorial Services. Signed on 2001-11-05. Completion date: 2002-05-14.
Top industries in this zip code by the number of employees in 2005:


 Nearest zip codes: 91724, 91741, 91773, 91723, 91722, 91791.