Estimated zip code population in 2022: 28,337 Zip code population in 2010: 26,184 Zip code population in 2000: 25,062
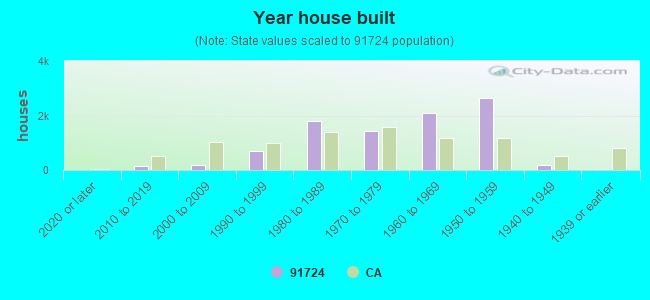
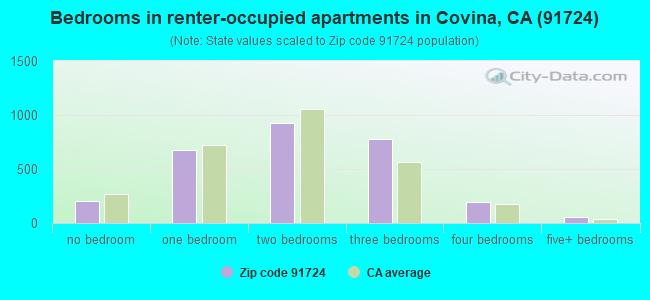
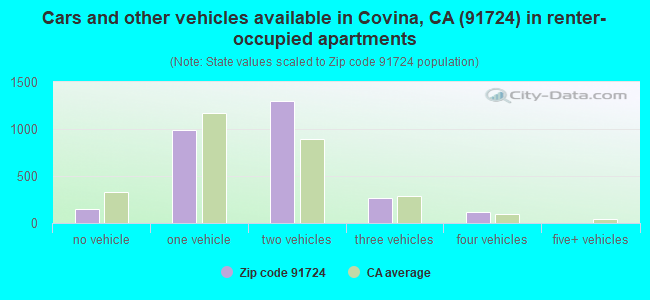
Houses and condos: 9,509 Renter-occupied apartments: 2,834
% of renters here:
31%
State:
44%
March 2022 cost of living index in zip code 91724: 133.4 (high, U.S. average is 100)
Land area: 6.2 sq. mi. Water area: 0.0 sq. mi.
Population density: 4,545 people per square mile
(average).
OSM Map
General Map
Google Map
MSN Map
OSM Map
General Map
Google Map
MSN Map
OSM Map
General Map
Google Map
MSN Map
OSM Map
General Map
Google Map
MSN Map
Please wait while loading the map...
Real estate property taxes paid for housing units in 2022:
This zip code:
0.7% ($4,828)
California:
0.7% ($4,831)
Median real estate property taxes paid for housing units with mortgages in 2022: $5,589 (0.8%) Median real estate property taxes paid for housing units with no mortgage in 2022: $2,901 (0.4%)
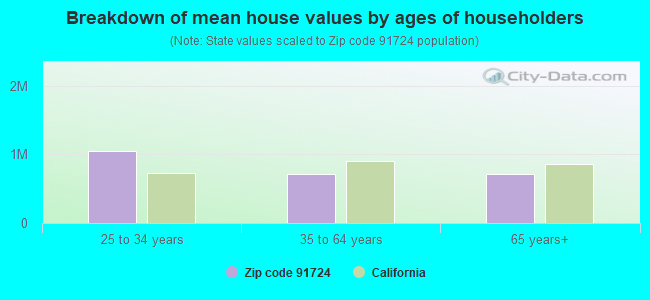
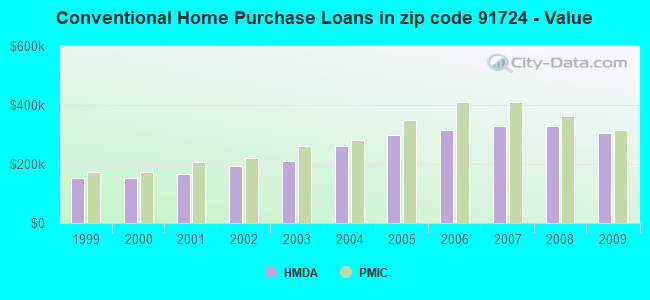
Estimated median house/condo value in 2022: $721,981
91724:
$721,981
California:
$715,900
According to our research of California and other state lists, there were 24 registered sex offenders living in 91724 zip code as of April 27, 2024. The ratio of all residents to sex offenders in zip code 91724 is 1,107 to 1. The ratio of registered sex offenders to all residents in this zip code is lower than the state average.
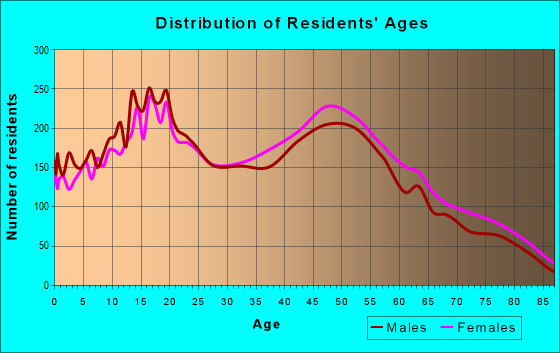
Median resident age:
This zip code:
39.1 years
California median age:
37.9 years
Average household size:
This zip code:
3.1 people
California:
2.8 people
Averages for the 2020 tax year for zip code 91724, filed in 2021:
Average Adjusted Gross Income (AGI) in 2020: $75,635 (Individual Income Tax Returns)
Here:
$75,635
State:
$95,910
Salary/wage: $64,863 (reported on 81.3% of returns)
Here:
$64,863
State:
$77,331
(% of AGI for various income ranges: 1190.0% for AGIs below $25k, 3822.3% for AGIs $25k-50k, 7191.2% for AGIs $50k-75k, 10687.4% for AGIs $75k-100k, 21411.2% for AGIs $100k-200k, 73469.5% for AGIs over 200k)
Taxable interest for individuals: $1,439 (reported on 36.8% of returns)
This zip code:
$1,439
California:
$2,294
(% of AGI for various income ranges: 14.3% for AGIs below $25k, 24.1% for AGIs $25k-50k, 48.0% for AGIs $50k-75k, 62.2% for AGIs $75k-100k, 141.6% for AGIs $100k-200k, 1559.1% for AGIs over 200k)
Ordinary dividends: $5,037 (reported on 15.3% of returns)
Here:
$5,037
State:
$10,949
(% of AGI for various income ranges: 11.5% for AGIs below $25k, 23.3% for AGIs $25k-50k, 54.0% for AGIs $50k-75k, 78.4% for AGIs $75k-100k, 198.3% for AGIs $100k-200k, 2665.5% for AGIs over 200k)
Net capital gain/loss in AGI: +$14,046 (reported on 15.4% of returns)
Here:
+$14,046
State:
+$49,306
(% of AGI for various income ranges: 5.8% for AGIs below $25k, 11.7% for AGIs $25k-50k, 77.0% for AGIs $50k-75k, 94.6% for AGIs $75k-100k, 392.9% for AGIs $100k-200k, 10180.0% for AGIs over 200k)
Profit/loss from business: +$10,654 (reported on 16.9% of returns)
Here:
+$10,654
State:
+$15,671
(% of AGI for various income ranges: 149.2% for AGIs below $25k, 203.9% for AGIs $25k-50k, 233.3% for AGIs $50k-75k, 269.4% for AGIs $75k-100k, 476.7% for AGIs $100k-200k, 2182.3% for AGIs over 200k)
Taxable individual retirement arrangement distribution: $20,452 (reported on 6.4% of returns)
91724:
$20,452
California:
$23,505
(% of AGI for various income ranges: 36.5% for AGIs below $25k, 84.9% for AGIs $25k-50k, 174.6% for AGIs $50k-75k, 245.0% for AGIs $75k-100k, 578.2% for AGIs $100k-200k, 1645.9% for AGIs over 200k)
Self-employed (Keogh) retirement plans: $22,725 (reported on 0.3% of returns)
91724:
$22,725
California:
$30,163
(% of AGI for various income ranges: 76.4% for AGIs $100k-200k)
Total itemized deductions: $33,446 (reported on 20.1% of returns)
Here:
$33,446
State:
$39,517
(% of AGI for various income ranges: 96.3% for AGIs below $25k, 268.1% for AGIs $25k-50k, 746.2% for AGIs $50k-75k, 1482.6% for AGIs $75k-100k, 2990.5% for AGIs $100k-200k, 11514.1% for AGIs over 200k)
Charity contributions: $7,046 (reported on 17.6% of returns)
Here:
$7,046
State:
$12,598
(% of AGI for various income ranges: 4.7% for AGIs below $25k, 32.0% for AGIs $25k-50k, 90.7% for AGIs $50k-75k, 191.6% for AGIs $75k-100k, 477.5% for AGIs $100k-200k, 3398.2% for AGIs over 200k)
Taxes paid: $8,977 (reported on 20.1% of returns)
91724:
$8,977
State:
$8,807
(% of AGI for various income ranges: 23.2% for AGIs below $25k, 63.5% for AGIs $25k-50k, 203.2% for AGIs $50k-75k, 469.5% for AGIs $75k-100k, 924.0% for AGIs $100k-200k, 2231.4% for AGIs over 200k)
Earned income credit: $1,919 (reported on 13.3% of returns)
Here:
$1,919
State:
$2,074
(% of AGI for various income ranges: 73.2% for AGIs below $25k, 63.4% for AGIs $25k-50k)
Percentage of individuals using paid preparers for their 2020 taxes: 92.4%
Here:
92%
State:
92%
(% for various income ranges: 91.5% for AGIs below $25k, 92.7% for AGIs $25k-50k, 91.8% for AGIs $50k-75k, 93.0% for AGIs $75k-100k, 92.8% for AGIs $100k-200k, 94.7% for AGIs over 200k)
Averages for the 2012 tax year for zip code 91724, filed in 2013:
Average Adjusted Gross Income (AGI) in 2012: $62,237 (Individual Income Tax Returns)
Here:
$62,237
State:
$72,726
Salary/wage: $55,382 (reported on 83.2% of returns)
Here:
$55,382
State:
$59,079
(% of AGI for various income ranges: 73.5% for AGIs below $25k, 79.0% for AGIs $25k-50k, 79.0% for AGIs $50k-75k, 78.3% for AGIs $75k-100k, 80.0% for AGIs $100k-200k, 53.8% for AGIs over 200k)
Taxable interest for individuals: $1,403 (reported on 38.4% of returns)
This zip code:
$1,403
California:
$2,146
(% of AGI for various income ranges: 0.9% for AGIs below $25k, 0.5% for AGIs $25k-50k, 0.5% for AGIs $50k-75k, 0.5% for AGIs $75k-100k, 0.5% for AGIs $100k-200k, 2.4% for AGIs over 200k)
Ordinary dividends: $4,786 (reported on 15.4% of returns)
Here:
$4,786
State:
$9,308
(% of AGI for various income ranges: 0.8% for AGIs below $25k, 0.7% for AGIs $25k-50k, 0.5% for AGIs $50k-75k, 0.6% for AGIs $75k-100k, 0.6% for AGIs $100k-200k, 3.6% for AGIs over 200k)
Net capital gain/loss in AGI: +$4,868 (reported on 12.6% of returns)
Here:
+$4,868
State:
+$30,460
(% of AGI for various income ranges: 0.3% for AGIs $75k-100k, 0.2% for AGIs $100k-200k, 4.8% for AGIs over 200k)
Profit/loss from business: +$13,962 (reported on 16.4% of returns)
Here:
+$13,962
State:
+$17,064
(% of AGI for various income ranges: 11.2% for AGIs below $25k, 5.3% for AGIs $25k-50k, 1.9% for AGIs $50k-75k, 2.8% for AGIs $75k-100k, 1.9% for AGIs $100k-200k, 4.8% for AGIs over 200k)
Taxable individual retirement arrangement distribution: $17,841 (reported on 7.9% of returns)
91724:
$17,841
California:
$19,557
(% of AGI for various income ranges: 3.0% for AGIs below $25k, 1.8% for AGIs $25k-50k, 2.0% for AGIs $50k-75k, 2.0% for AGIs $75k-100k, 2.4% for AGIs $100k-200k, 2.4% for AGIs over 200k)
Self-employment retirement plans: $17,780 (reported on 0.4% of returns)
91724:
$17,780
California:
$24,530
Total itemized deductions: $28,312 (26% of AGI, reported on 43.0% of returns)
Here:
$28,312
State:
$34,004
Here:
26.4% of AGI
State:
22.7% of AGI
(% of AGI for various income ranges: 11.9% for AGIs below $25k, 14.8% for AGIs $25k-50k, 20.2% for AGIs $50k-75k, 22.0% for AGIs $75k-100k, 22.2% for AGIs $100k-200k, 18.4% for AGIs over 200k)
Charity contributions: $3,528 (reported on 37.4% of returns)
Here:
$3,528
State:
$4,659
(% of AGI for various income ranges: 0.7% for AGIs below $25k, 1.2% for AGIs $25k-50k, 2.1% for AGIs $50k-75k, 2.3% for AGIs $75k-100k, 2.3% for AGIs $100k-200k, 2.8% for AGIs over 200k)
Taxes paid: $9,701 (reported on 43.0% of returns)
91724:
$9,701
State:
$14,448
(% of AGI for various income ranges: 2.5% for AGIs below $25k, 3.6% for AGIs $25k-50k, 5.4% for AGIs $50k-75k, 6.8% for AGIs $75k-100k, 7.9% for AGIs $100k-200k, 8.9% for AGIs over 200k)
Earned income credit: $2,168 (reported on 16.4% of returns)
Here:
$2,168
State:
$2,286
(% of AGI for various income ranges: 6.1% for AGIs below $25k, 1.1% for AGIs $25k-50k)
Percentage of individuals using paid preparers for their 2012 taxes: 68.0%
Here:
68%
State:
64%
(% for various income ranges: 60.8% for AGIs below $25k, 68.7% for AGIs $25k-50k, 69.6% for AGIs $50k-75k, 74.2% for AGIs $75k-100k, 75.4% for AGIs $100k-200k, 82.1% for AGIs over 200k)
Averages for the 2004 tax year for zip code 91724, filed in 2005:
Average Adjusted Gross Income (AGI) in 2004: $60,523 (Individual Income Tax Returns)
Here:
$60,523
State:
$58,600
Salary/wage: $50,424 (reported on 84.0% of returns)
Here:
$50,424
State:
$49,455
(% of AGI for various income ranges: 201.9% for AGIs below $10k, 75.0% for AGIs $10k-25k, 81.5% for AGIs $25k-50k, 82.0% for AGIs $50k-75k, 83.3% for AGIs $75k-100k, 56.5% for AGIs over 100k)
Taxable interest for individuals: $1,954 (reported on 49.1% of returns)
This zip code:
$1,954
California:
$2,365
(% of AGI for various income ranges: 9.8% for AGIs below $10k, 2.4% for AGIs $10k-25k, 1.1% for AGIs $25k-50k, 0.9% for AGIs $50k-75k, 0.9% for AGIs $75k-100k, 1.9% for AGIs over 100k)
Taxable dividends: $3,070 (reported on 21.4% of returns)
Here:
$3,070
State:
$4,746
(% of AGI for various income ranges: 5.0% for AGIs below $10k, 0.8% for AGIs $10k-25k, 0.7% for AGIs $25k-50k, 0.7% for AGIs $50k-75k, 0.5% for AGIs $75k-100k, 1.5% for AGIs over 100k)
Net capital gain/loss: +$17,237 (reported on 17.2% of returns)
Here:
+$17,237
State:
+$23,418
(% of AGI for various income ranges: -4.0% for AGIs below $10k, 0.0% for AGIs $10k-25k, 0.3% for AGIs $25k-50k, 0.9% for AGIs $50k-75k, 0.6% for AGIs $75k-100k, 9.5% for AGIs over 100k)
Profit/loss from business: +$15,064 (reported on 17.1% of returns)
Here:
+$15,064
State:
+$16,826
(% of AGI for various income ranges: 9.4% for AGIs below $10k, 8.4% for AGIs $10k-25k, 5.1% for AGIs $25k-50k, 4.0% for AGIs $50k-75k, 3.5% for AGIs $75k-100k, 3.8% for AGIs over 100k)
Profit/loss from farming: +$10,636 (reported on 0.1% of returns)
Here:
+$10,636
State:
-$7,562
IRA payment deduction: $3,483 (reported on 3.0% of returns)
91724:
$3,483
California:
$3,192
(% of AGI for various income ranges: 0.9% for AGIs below $10k, 0.2% for AGIs $10k-25k, 0.3% for AGIs $25k-50k, 0.3% for AGIs $50k-75k, 0.2% for AGIs $75k-100k, 0.1% for AGIs over 100k)
Self-employed pension: $16,188 (reported on 0.9% of returns)
Here:
$16,188
California:
$17,688
(% of AGI for various income ranges: 0.1% for AGIs $25k-50k, 0.1% for AGIs $50k-75k, 0.2% for AGIs $75k-100k, 0.4% for AGIs over 100k)
Total itemized deductions: $26,797 (27% of AGI, reported on 47.8% of returns)
Here:
$26,797
State:
$28,113
Here:
26.9% of AGI
State:
25.3% of AGI
(% of AGI for various income ranges: 30.6% for AGIs below $10k, 18.9% for AGIs $10k-25k, 19.4% for AGIs $25k-50k, 25.3% for AGIs $50k-75k, 25.9% for AGIs $75k-100k, 19.0% for AGIs over 100k)
Charity contributions deductions: $4,256 (4% of AGI, reported on 43.9% of returns)
Here:
$4,256
State:
$3,923
Here:
4.2% of AGI
State:
3.3% of AGI
(% of AGI for various income ranges: 1.4% for AGIs below $10k, 1.3% for AGIs $10k-25k, 2.0% for AGIs $25k-50k, 3.1% for AGIs $50k-75k, 3.0% for AGIs $75k-100k, 3.7% for AGIs over 100k)
Total tax: $9,367 (reported on 78.4% of returns)
91724:
$9,367
State:
$10,761
(% of AGI for various income ranges: 6.4% for AGIs below $10k, 4.5% for AGIs $10k-25k, 6.7% for AGIs $25k-50k, 8.1% for AGIs $50k-75k, 8.8% for AGIs $75k-100k, 17.0% for AGIs over 100k)
Earned income credit: $1,716 (reported on 12.6% of returns)
Here:
$1,716
State:
$1,763
Percentage of individuals using paid preparers for their 2004 taxes: 70.0%
Here:
70%
State:
66%
(% for various income ranges: 61.5% for AGIs below $10k, 65.5% for AGIs $10k-25k, 70.6% for AGIs $25k-50k, 72.4% for AGIs $50k-75k, 74.7% for AGIs $75k-100k, 79.8% for AGIs over 100k)
Likely homosexual households (counted as self-reported same-sex unmarried-partner households)
Lesbian couples: 0.1% of all households
Gay men: 0.2% of all households
Household received Food Stamps/SNAP in the past 12 months: 952 Household did not receive Food Stamps/SNAP in the past 12 months: 8,212
Women who had a birth in the past 12 months: 278 (196 now married, 81 unmarried) Women who did not have a birth in the past 12 months: 6,498 (2,481 now married, 4,020 unmarried)
Housing units in zip code 91724 with a mortgage: 4,437 (443 second mortgage, 22 home equity loan, 380 both second mortgage and home equity loan) Houses without a mortgage: 46
Median monthly owner costs for units with a mortgage: $2,714 Median monthly owner costs for units without a mortgage: $718
Residents with income below the poverty level in 2022:
This zip code:
8.7%
Whole state:
12.2%
Residents with income below 50% of the poverty level in 2022:
This zip code:
6.0%
Whole state:
6.2%
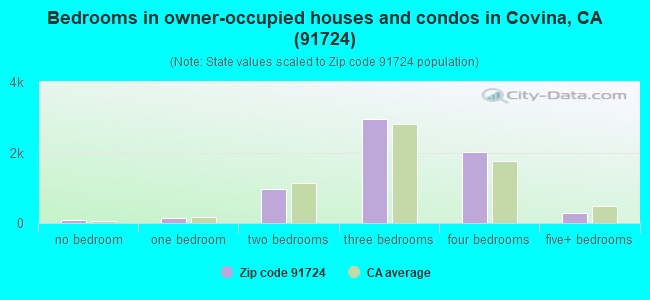
Median number of rooms in houses and condos:
Here:
6.1
State:
6.0
Median number of rooms in apartments:
Here:
4.2
State:
3.9
Notable locations in this zip code not listed on our city pages
Notable locations in zip code 91724: Charter Oak Branch County of Los Angeles Public Library (A), Masonic Home for Children (B), Los Angeles County Fire Department Station 153 (C). Display/hide their locations on the map
Churches in zip code 91724 include: Congregational Church of the Good Shepherd (A), Kingdom Hall of Jehovahs Witnesses (B), Prince of Peace Lutheran Church (C), Saint Louise De Marillac Catholic Church (D), Word of Faith Christian Center (E), Church of Jesus Christ of Latter Day Saints (F), Community of Christ Church (G), Covina Christian Church (H), Covina Evangelical Free Church (I). Display/hide their locations on the map
3,223 married couples with children.
1,412 single-parent households (413 men, 999 women).
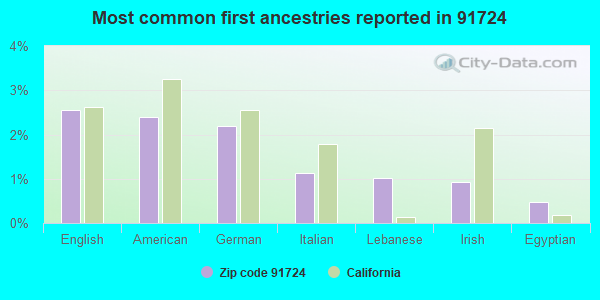
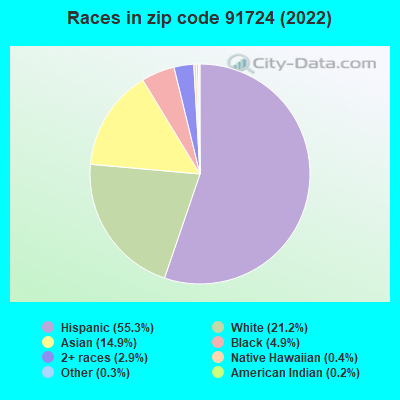
53.4% of residents of 91724 zip code speak English at home.
32.8% of residents speak Spanish at home (79% very well, 11% well, 7% not well, 3% not at all).
0.7% of residents speak other Indo-European language at home (78% very well, 19% well, 3% not well).
11.7% of residents speak Asian or Pacific Island language at home (59% very well, 23% well, 15% not well, 4% not at all).
1.3% of residents speak other language at home (56% very well, 33% well, 2% not well, 10% not at all).
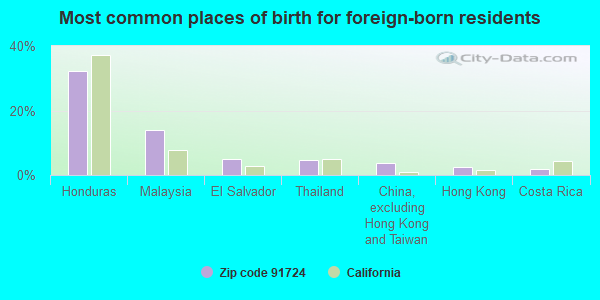
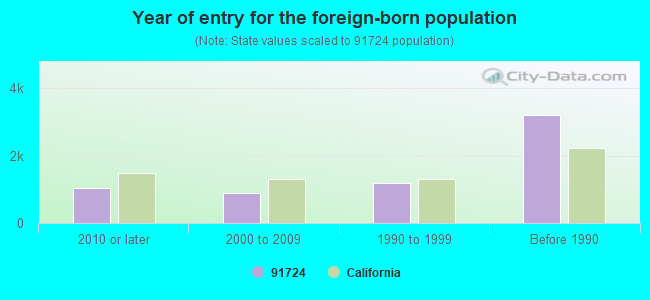
Foreign born population: 6,265 (22.1%) (74.7% of them are naturalized citizens)
Facilities with environmental interests located in this zip code:
NORAM CORP (1079 E EDNA PL in COVINA, CA)
STATE MASTER (California - Hazardous Waste Tracking) - HAZARDOU WASTE PROGRAM Small Quantity Generators, between 100 kg and 1000 kg of hazardous waste/month (Resource Conservation and Recovery Act (tracking hazardous waste)) - notification Organizations: KIM VANGSTAD (CONTACT/OWNER)
EXXONMOBIL OIL CORP NO 11973 (19505 E CYPRESS ST in COVINA, CA)
HAZARDOUS WASTE BIENNIAL REPORTER (Resource Conservation and Recovery Act (tracking hazardous waste)) Large Quantity Generators, more that 1000 kg of hazardous waste/month (Resource Conservation and Recovery Act (tracking hazardous waste)) Organizations: EXXONMOBIL OIL CORPORATION (CONTACT/OPERATOR)
Alternative names: EXXON MOBIL OIL CORP
A & D DRAIN & PUMPING SERV (4657 GLEN ARDEN in COVINA, CA)
TRANSPORTER (Resource Conservation and Recovery Act (tracking hazardous waste)) Organizations: ARCH T MCCOY (CONTACT/OWNER)
FLOWER FRESH 1 HR CLEANERS (1351 N GRAND AVE in COVINA, CA)
Small Quantity Generators, between 100 kg and 1000 kg of hazardous waste/month (Resource Conservation and Recovery Act (tracking hazardous waste)) - notification Organizations: SONG BYUNG K (CONTACT/OWNER)
K V PRODUCTS (1060 EAST CYPRESS in COVINA, CA)
Small Quantity Generators, between 100 kg and 1000 kg of hazardous waste/month (Resource Conservation and Recovery Act (tracking hazardous waste)) - notification Organizations: JACK PRITCHARD (CONTACT/OWNER)
CENTERLESS PRECISION (616 N DODSWORTH AVE in COVINA, CA)
Small Quantity Generators, between 100 kg and 1000 kg of hazardous waste/month (Resource Conservation and Recovery Act (tracking hazardous waste)) - notification Business NAICS classification: OTHER COMMERCIAL AND SERVICE INDUSTRY MACHINERY MANUFACTURING. Organizations: S L SEYMOUR CONTRACTOR INC (CONTACT/OWNER)
EG & G POWER SYS. INC. (1330 E. CYPRESS ST. in COVINA, CA)
CRITERIA AND HAZARDOUS AIR POLLUTANT INVENTORY (Inventory of air pollution sources) TRI REPORTER (Tracking of toxic chemicals releasing facilities) Business SIC classification: SEMICONDUCTORS AND RELATED DEVICES; ELECTRONIC COMPONENTS
G AND K MACHINE CO INC (1236 E EONA PL in COVINA, CA)
Small Quantity Generators, between 100 kg and 1000 kg of hazardous waste/month (Resource Conservation and Recovery Act (tracking hazardous waste)) - notification Business NAICS classification: OTHER COMMERCIAL AND SERVICE INDUSTRY MACHINERY MANUFACTURING. Organizations: MONA LEE ARCE (CONTACT/OWNER)
H AND A TRANSMISSION (648 N GRAND AVE in COVINA, CA)
Small Quantity Generators, between 100 kg and 1000 kg of hazardous waste/month (Resource Conservation and Recovery Act (tracking hazardous waste)) - notification
K MART (1162 N CITRUS AVE in COVINA, CA)
Small Quantity Generators, between 100 kg and 1000 kg of hazardous waste/month (Resource Conservation and Recovery Act (tracking hazardous waste)) - notification
MARLEE MANUFACTURING INCORPORATED (832 NORTH GRAND AVENUE in COVINA, CA)
CRITERIA AND HAZARDOUS AIR POLLUTANT INVENTORY (Inventory of air pollution sources) Business SIC classification: CURRENT-CARRYING WIRING DEVICES
CARCO PACIFIC CORP (813 N CUMMINGS in COVINA, CA)
COMPLIANCE ACTIVITY (Tracking inspections of insecticide, fungicide, and rodenticide, and toxic substances)
Housing units lacking complete plumbing facilities: 3.9% Housing units lacking complete kitchen facilities: 4.6%
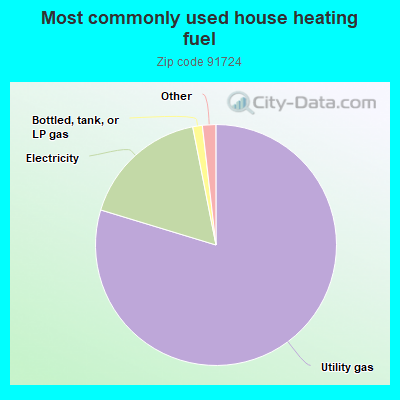
79.7%Utility gas
17.2%Electricity
1.3%Bottled, tank, or LP gas
1.0%No fuel used
0.7%Solar energy
Population in 1990: 23,462. Population change in the 1990s: +1,600 (+6.8%).
Place of birth for U.S.-born residents:
This state: 19,484
Northeast: 555
Midwest: 674
South: 580
West: 669
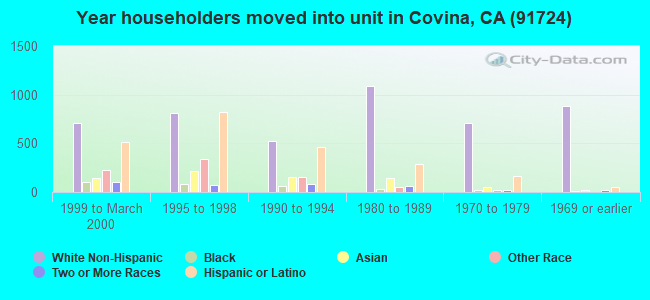
58% of the 91724 zip code residents lived in the same house 5 years ago. Out of people who lived in different houses, 82% lived in this county. Out of people who lived in different counties, 50% lived in California.
92% of the 91724 zip code residents lived in the same house 1 year ago. Out of people who lived in different houses, 73% moved from this county. Out of people who lived in different houses, 16% moved from different county within same state. Out of people who lived in different houses, 4% moved from different state. Out of people who lived in different houses, 6% moved from abroad.
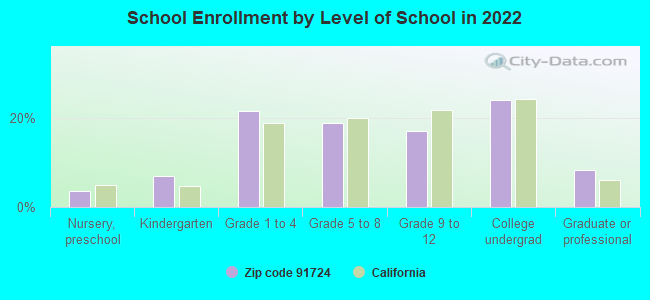
Private vs. public school enrollment:
Students in private schools in grades 1 to 8 (elementary and middle school): 294
Here:
10.5%
California:
10.5%
Students in private schools in grades 9 to 12 (high school): 221
Here:
18.6%
California:
8.5%
Students in private undergraduate colleges: 212
Here:
12.7%
California:
15.9%
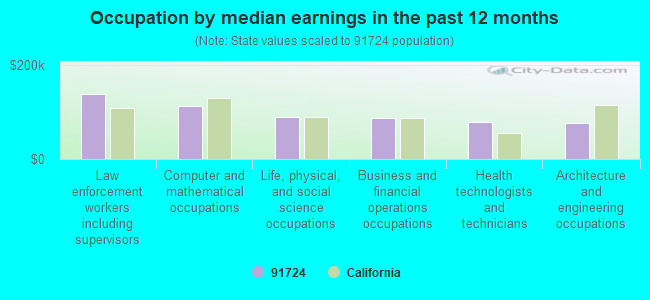
Occupation by median earnings in the past 12 months ($)
138,490Law enforcement workers including supervisors
112,375Computer and mathematical occupations
88,761Life, physical, and social science occupations
87,458Business and financial operations occupations
78,101Health technologists and technicians
75,859Architecture and engineering occupations
Companies with biggest federal contracts located in this zip code (COVINA, CA):
PERKINELMER OPTOELECTRONICS, A (1330 EAST CYPRESS ST) : $4,465,910 in 168 contractsfrom 1999 to 2006
Contracts for Converters, Electrical, Nonrotating, Electronic Modules, Electrical and Electronic assemblies, Boards, Cards, and Associated Hardware, Miscellaneous Communication Equipment, and moreby Air Force, Navy, Army, Defense Logistics Agency, and others Signed by year:2000: $1,245,653; 2001: $1,028,152; 2002: $372,421; 2003: $431,898; 2004: $307,247; 2005: $451,921; 2006: $332,042.
Biggest contracts:
$713,260 with Air Force for Converters, Electrical, Nonrotating. Signed on 2005-09-27. Completion date: 2005-07-29.
$295,232 with Navy for Electronic Modules. Signed on 2001-03-12. Completion date: 2002-05-12.
$249,383 with Navy for Converters, Electrical, Nonrotating. Signed on 2000-02-17. Completion date: 2000-06-16.
$229,288, same as above.Signed on 2001-11-21. Completion date: 2001-11-21.
EXCLUSIVE TENT RENTALS, INC (663 N DARFIELD AVE; small business) 50 employees, $0 revenue. : $1,410,374 in 30 contractsfrom 2004 to 2006
Contracts for Tents and Tarpaulins, Prefabricated and Portable Buildings, Lease or Rental of Equipment -- Recreational and Athletic Equipment, Lease or Rental of Facilities -- Other Non-Building Facilities, and moreby Army Signed by year:2000: $0; 2001: $0; 2002: $0; 2003: $0; 2004: $536,185; 2005: $431,776; 2006: $442,413.
Biggest contracts:
$282,960 with Army for Tents and Tarpaulins. Signed on 2004-11-10. Completion date: 2005-05-15.
$249,200, same as above.Signed on 2005-08-02. Completion date: 2005-08-08.
$196,000 with Army for Prefabricated and Portable Buildings. Signed on 2006-03-03. Completion date: 2006-06-23.
$108,300 with Army for Lease or Rental of Equipment -- Recreational and Athletic Equipment. Signed on 2004-08-14. Completion date: 2004-10-29.
TECHNOLOGY FOCUS LLC (635 SOUTH CHAPPARO ROAD; small business) : $1,121,964 in 5 contractsfrom 2000 to 2002
Contracts for Other Defense -- Applied Research and Exploratory Development (R&D), Other Defense -- Operational Systems Development (R&D), Other Defense -- Basic Research (R&D) by Navy Signed by year:2000: $69,914; 2001: $329,996; 2002: $722,054; 2003: $0; 2004: $0; 2005: $0; 2006: $0.
Biggest contracts:
$400,000 with Navy for Other Defense -- Applied Research and Exploratory Development (R&D). Signed on 2002-05-22. Completion date: 2003-02-28.
$322,054 with Navy for Other Defense -- Operational Systems Development (R&D). Signed on 2002-09-30. Completion date: 2003-02-28.
$300,000 with Navy for Other Defense -- Applied Research and Exploratory Development (R&D). Signed on 2001-10-30. Completion date: 2003-12-31.
$69,914 with Navy for Other Defense -- Basic Research (R&D). Signed on 2000-11-15. Completion date: 2001-11-15.
CVI OPTICAL COMPONENTS (1175 EAST EDNA PLACE; small business) : $1,105,069 in 34 contractsfrom 2000 to 2006
Contracts for Aircraft Gunnery Fire Control Components, Miscellaneous Prefabricated Structures, Optical Instruments, Test Equipment, Components and Accessories, Hand Tools, Nonedged, Nonpowered, and moreby Army, Navy, Defense Logistics Agency Signed by year:2000: $151,892; 2001: $244,018; 2002: $1,269; 2003: $483,525; 2004: $39,501; 2005: $167,544; 2006: $17,320.
Biggest contracts:
$249,275 with Army for Aircraft Gunnery Fire Control Components. Signed on 2003-11-07. Completion date: 2006-05-30.
$162,250, same as above.Signed on 2003-06-30. Completion date: 2006-05-30.
$89,754 with Navy for Miscellaneous Prefabricated Structures. Taking place in NV. Signed on 2005-01-14. Completion date: 2005-06-22.
$62,348 with Army for Optical Instruments, Test Equipment, Components and Accessories. Signed on 2001-11-06. Completion date: 2002-06-05.
PERKINELMER OPTOELECTRONICS NC (1330 E CYPRESS ST)
$807,488 with Defense Logistics Agency for Converters, Electrical, Nonrotating. Signed on 2005-02-28. Completion date: 2005-12-26.
OLIVAS VALDEZ INC (846 N CHARTER DR; small business) : $117,448 in 2 contractsin 2003
$72,450 with U.S. Army Corps of Engineers - civil program financing only for Hazardous Substance Removal, Cleanup, and Disposal Services and Operational Support. Signed on 2003-08-19. Completion date: 2003-09-30.
$44,998, same as above.Signed on 2003-08-19. Completion date: 2003-09-30.
G P C & SONS CONSTRUCTION (21057 E COVINA BLVD; small business)
$47,403 with Navy for Miscellaneous Items. Signed on 2004-11-16. Completion date: 2004-11-29.
FOLDING GATE SYSTEMS (21050 E CIENEGA AVE; small business)
$29,650 with Army for Metal Finishing Equipment. Signed on 2003-03-22. Completion date: 2003-04-30.
SUNNY COMPONENTS INC (1370 EAST CYPRESS STREET U; small business) : $12,870 in 3 contractsfrom 2002 to 2004
$6,435 with Defense Logistics Agency for Electrical and Electronic Properties Measuring and Testing Instruments. Signed on 2004-10-14. Completion date: 2004-11-13.
$6,435, same as above.Signed on 2004-10-14. Completion date: 2004-11-13.
$0, same as above.Signed on 2002-09-11. Completion date: 2004-09-16.
AMERICAN GRADUATE UNIVERSITY, (733 N DODSWORTH AVE) : $11,812 in 3 contractsin 2005
$10,951 with U.S. Army Corps of Engineers - civil program financing only for Training/Curriculum Development. Signed on 2005-04-04. Completion date: 2005-02-11.
$761, same as above.Signed on 2005-05-23. Completion date: 2005-02-11.
$100, same as above.Signed on 2005-04-08. Completion date: 2005-02-11.
Top industries in this zip code by the number of employees in 2005:
Administrative and Support and Waste Management and Remediation Services: Telemarketing Bureaus (500-999 employees: 1 establishment)
Other Services (except Public Administration): Religious Organizations (100-249: 1, 50-99: 1, 20-49: 2, 5-9: 3, 1-4: 7)
Educational Services: Elementary and Secondary Schools (100-249: 2)
Health Care and Social Assistance: Home Health Care Services (100-249: 1, 20-49: 3, 10-19: 1, 1-4: 2)
Finance and Insurance: Insurance Agencies and Brokerages (50-99: 1, 20-49: 2, 10-19: 4, 5-9: 1, 1-4: 13)
Real Estate and Rental and Leasing: Other Activities Related to Real Estate (100-249: 1, 10-19: 2, 1-4: 1)
Finance and Insurance: Real Estate Credit (50-99: 2, 20-49: 1, 1-4: 7)


+$10,636
-$7,562
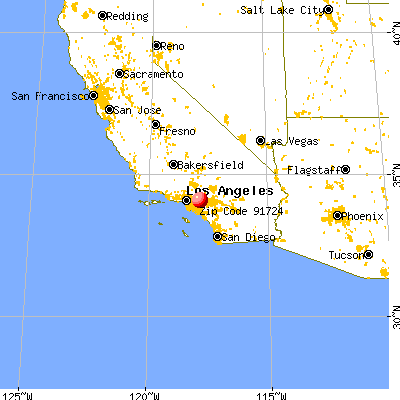
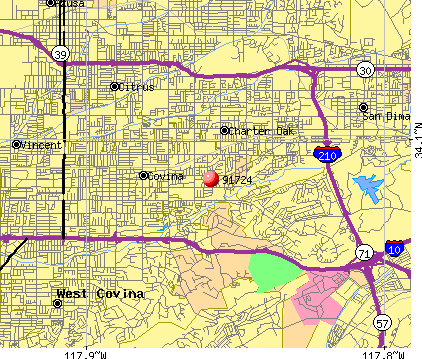 Nearest zip codes: 91723, 91740, 91791, 91773, 91722, 91789.