Estimated zip code population in 2022: 33,620 Zip code population in 2010: 32,414 Zip code population in 2000: 30,442
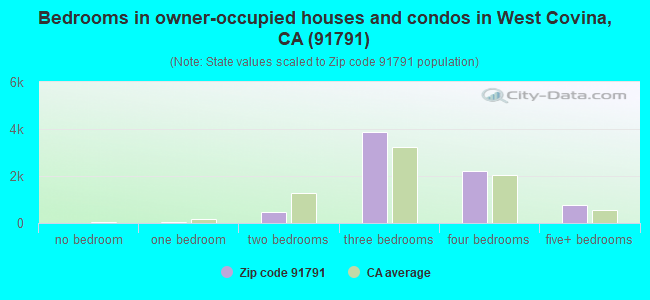
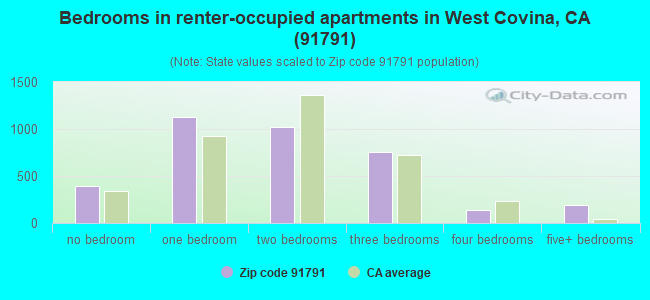
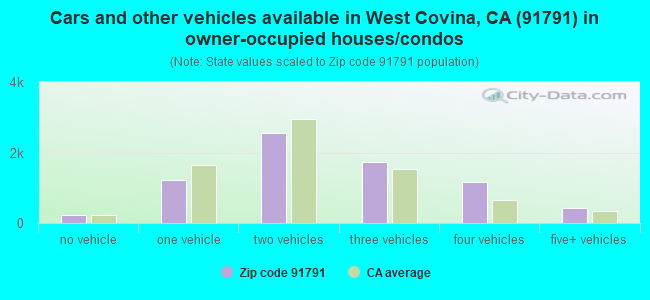
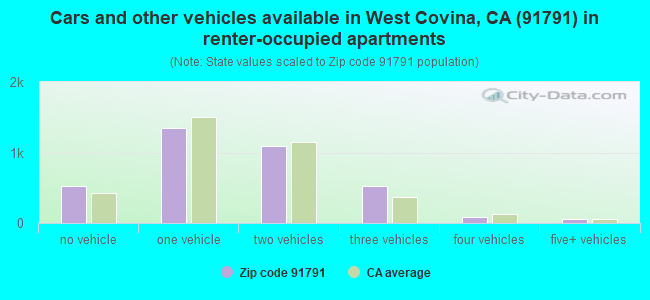
Houses and condos: 11,555 Renter-occupied apartments: 3,626
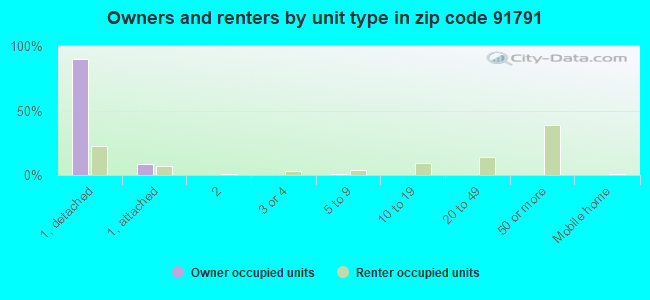
% of renters here:
33%
State:
44%
March 2022 cost of living index in zip code 91791: 133.7 (high, U.S. average is 100)
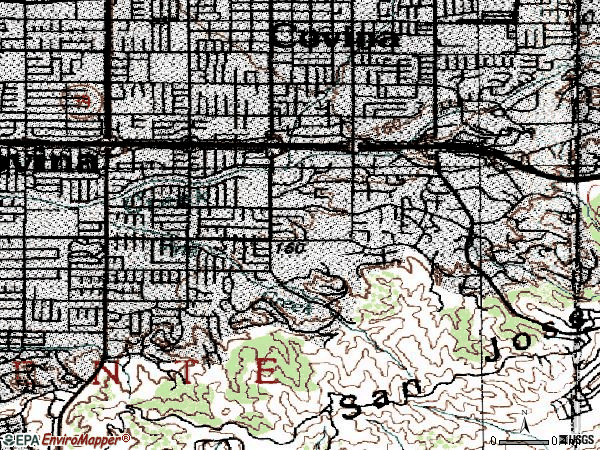
Land area: 6.6 sq. mi. Water area: 0.0 sq. mi.
Population density: 5,067 people per square mile
(average).
OSM Map
General Map
Google Map
MSN Map
OSM Map
General Map
Google Map
MSN Map
OSM Map
General Map
Google Map
MSN Map
OSM Map
General Map
Google Map
MSN Map
Please wait while loading the map...
Real estate property taxes paid for housing units in 2022:
This zip code:
0.7% ($5,429)
California:
0.7% ($4,831)
Median real estate property taxes paid for housing units with mortgages in 2022: $5,663 (0.7%) Median real estate property taxes paid for housing units with no mortgage in 2022: $5,239 (0.7%)
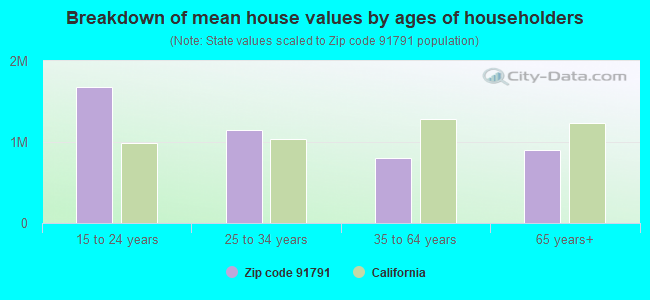
Estimated median house/condo value in 2022: $776,816
91791:
$776,816
California:
$715,900
According to our research of California and other state lists, there were 28 registered sex offenders living in 91791 zip code as of April 26, 2024. The ratio of all residents to sex offenders in zip code 91791 is 1,213 to 1. The ratio of registered sex offenders to all residents in this zip code is lower than the state average.
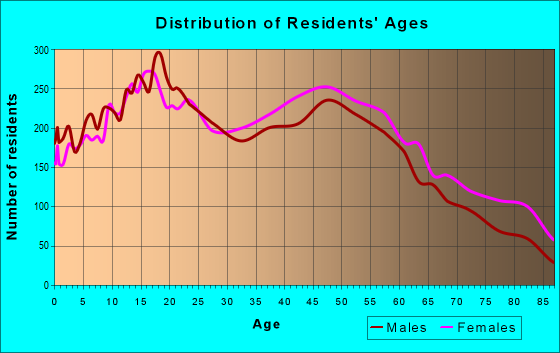
Median resident age:
This zip code:
43.8 years
California median age:
37.9 years
Average household size:
This zip code:
3.1 people
California:
2.8 people
Averages for the 2020 tax year for zip code 91791, filed in 2021:
Average Adjusted Gross Income (AGI) in 2020: $80,619 (Individual Income Tax Returns)
Here:
$80,619
State:
$95,910
Salary/wage: $63,866 (reported on 78.7% of returns)
Here:
$63,866
State:
$77,331
(% of AGI for various income ranges: 1141.2% for AGIs below $25k, 3936.4% for AGIs $25k-50k, 7417.7% for AGIs $50k-75k, 10508.1% for AGIs $75k-100k, 21051.7% for AGIs $100k-200k, 92344.2% for AGIs over 200k)
Taxable interest for individuals: $1,825 (reported on 36.4% of returns)
This zip code:
$1,825
California:
$2,294
(% of AGI for various income ranges: 21.4% for AGIs below $25k, 28.4% for AGIs $25k-50k, 50.8% for AGIs $50k-75k, 91.6% for AGIs $75k-100k, 180.6% for AGIs $100k-200k, 2412.1% for AGIs over 200k)
Ordinary dividends: $6,725 (reported on 17.2% of returns)
Here:
$6,725
State:
$10,949
(% of AGI for various income ranges: 20.2% for AGIs below $25k, 32.2% for AGIs $25k-50k, 63.4% for AGIs $50k-75k, 106.0% for AGIs $75k-100k, 268.8% for AGIs $100k-200k, 5258.8% for AGIs over 200k)
Net capital gain/loss in AGI: +$21,302 (reported on 18.6% of returns)
Here:
+$21,302
State:
+$49,306
(% of AGI for various income ranges: 17.2% for AGIs below $25k, 45.6% for AGIs $25k-50k, 102.1% for AGIs $50k-75k, 139.7% for AGIs $75k-100k, 656.7% for AGIs $100k-200k, 22575.0% for AGIs over 200k)
Profit/loss from business: +$13,240 (reported on 19.0% of returns)
Here:
+$13,240
State:
+$15,671
(% of AGI for various income ranges: 175.0% for AGIs below $25k, 241.3% for AGIs $25k-50k, 238.1% for AGIs $50k-75k, 361.4% for AGIs $75k-100k, 564.8% for AGIs $100k-200k, 6450.8% for AGIs over 200k)
Taxable individual retirement arrangement distribution: $21,639 (reported on 5.6% of returns)
91791:
$21,639
California:
$23,505
(% of AGI for various income ranges: 37.7% for AGIs below $25k, 63.1% for AGIs $25k-50k, 129.5% for AGIs $50k-75k, 253.3% for AGIs $75k-100k, 558.5% for AGIs $100k-200k, 2482.1% for AGIs over 200k)
Self-employed (Keogh) retirement plans: $36,200 (reported on 0.4% of returns)
91791:
$36,200
California:
$30,163
(% of AGI for various income ranges: 50.4% for AGIs $75k-100k, 858.3% for AGIs over 200k)
Total itemized deductions: $34,601 (reported on 18.1% of returns)
Here:
$34,601
State:
$39,517
(% of AGI for various income ranges: 96.2% for AGIs below $25k, 259.9% for AGIs $25k-50k, 708.9% for AGIs $50k-75k, 1371.7% for AGIs $75k-100k, 2993.3% for AGIs $100k-200k, 13986.7% for AGIs over 200k)
Charity contributions: $7,244 (reported on 15.4% of returns)
Here:
$7,244
State:
$12,598
(% of AGI for various income ranges: 5.1% for AGIs below $25k, 26.2% for AGIs $25k-50k, 83.7% for AGIs $50k-75k, 191.1% for AGIs $75k-100k, 486.0% for AGIs $100k-200k, 3633.3% for AGIs over 200k)
Taxes paid: $9,037 (reported on 18.0% of returns)
91791:
$9,037
State:
$8,807
(% of AGI for various income ranges: 23.6% for AGIs below $25k, 71.8% for AGIs $25k-50k, 203.9% for AGIs $50k-75k, 423.3% for AGIs $75k-100k, 899.6% for AGIs $100k-200k, 2590.8% for AGIs over 200k)
Earned income credit: $1,829 (reported on 13.8% of returns)
Here:
$1,829
State:
$2,074
(% of AGI for various income ranges: 72.1% for AGIs below $25k, 61.3% for AGIs $25k-50k, 0.8% for AGIs $50k-75k)
Percentage of individuals using paid preparers for their 2020 taxes: 91.5%
Here:
91%
State:
92%
(% for various income ranges: 90.5% for AGIs below $25k, 91.7% for AGIs $25k-50k, 92.0% for AGIs $50k-75k, 90.7% for AGIs $75k-100k, 92.4% for AGIs $100k-200k, 93.3% for AGIs over 200k)
Averages for the 2012 tax year for zip code 91791, filed in 2013:
Average Adjusted Gross Income (AGI) in 2012: $67,729 (Individual Income Tax Returns)
Here:
$67,729
State:
$72,726
Salary/wage: $55,297 (reported on 82.2% of returns)
Here:
$55,297
State:
$59,079
(% of AGI for various income ranges: 74.1% for AGIs below $25k, 80.5% for AGIs $25k-50k, 79.6% for AGIs $50k-75k, 78.7% for AGIs $75k-100k, 76.5% for AGIs $100k-200k, 40.5% for AGIs over 200k)
Taxable interest for individuals: $1,530 (reported on 38.2% of returns)
This zip code:
$1,530
California:
$2,146
(% of AGI for various income ranges: 1.2% for AGIs below $25k, 0.6% for AGIs $25k-50k, 0.6% for AGIs $50k-75k, 0.6% for AGIs $75k-100k, 0.7% for AGIs $100k-200k, 1.3% for AGIs over 200k)
Ordinary dividends: $6,312 (reported on 16.7% of returns)
Here:
$6,312
State:
$9,308
(% of AGI for various income ranges: 1.1% for AGIs below $25k, 0.7% for AGIs $25k-50k, 0.8% for AGIs $50k-75k, 1.1% for AGIs $75k-100k, 1.2% for AGIs $100k-200k, 2.9% for AGIs over 200k)
Net capital gain/loss in AGI: +$9,409 (reported on 14.4% of returns)
Here:
+$9,409
State:
+$30,460
(% of AGI for various income ranges: 0.2% for AGIs $50k-75k, 0.2% for AGIs $75k-100k, 0.6% for AGIs $100k-200k, 6.3% for AGIs over 200k)
Profit/loss from business: +$15,195 (reported on 17.0% of returns)
Here:
+$15,195
State:
+$17,064
(% of AGI for various income ranges: 11.4% for AGIs below $25k, 4.5% for AGIs $25k-50k, 3.2% for AGIs $50k-75k, 2.4% for AGIs $75k-100k, 2.7% for AGIs $100k-200k, 3.7% for AGIs over 200k)
Taxable individual retirement arrangement distribution: $17,359 (reported on 7.7% of returns)
91791:
$17,359
California:
$19,557
(% of AGI for various income ranges: 2.5% for AGIs below $25k, 2.1% for AGIs $25k-50k, 1.7% for AGIs $50k-75k, 1.8% for AGIs $75k-100k, 2.3% for AGIs $100k-200k, 1.7% for AGIs over 200k)
Self-employment retirement plans: $21,011 (reported on 0.6% of returns)
91791:
$21,011
California:
$24,530
(% of AGI for various income ranges: 0.2% for AGIs $25k-50k, 0.1% for AGIs $100k-200k, 0.5% for AGIs over 200k)
Total itemized deductions: $32,383 (26% of AGI, reported on 42.1% of returns)
Here:
$32,383
State:
$34,004
Here:
26.4% of AGI
State:
22.7% of AGI
(% of AGI for various income ranges: 12.0% for AGIs below $25k, 15.3% for AGIs $25k-50k, 20.2% for AGIs $50k-75k, 22.8% for AGIs $75k-100k, 22.4% for AGIs $100k-200k, 20.5% for AGIs over 200k)
Charity contributions: $3,793 (reported on 35.4% of returns)
Here:
$3,793
State:
$4,659
(% of AGI for various income ranges: 0.7% for AGIs below $25k, 1.3% for AGIs $25k-50k, 2.0% for AGIs $50k-75k, 2.2% for AGIs $75k-100k, 2.2% for AGIs $100k-200k, 2.3% for AGIs over 200k)
Taxes paid: $11,839 (reported on 41.9% of returns)
91791:
$11,839
State:
$14,448
(% of AGI for various income ranges: 2.9% for AGIs below $25k, 3.7% for AGIs $25k-50k, 5.7% for AGIs $50k-75k, 7.3% for AGIs $75k-100k, 8.3% for AGIs $100k-200k, 9.7% for AGIs over 200k)
Earned income credit: $2,104 (reported on 17.0% of returns)
Here:
$2,104
State:
$2,286
(% of AGI for various income ranges: 5.9% for AGIs below $25k, 1.1% for AGIs $25k-50k)
Percentage of individuals using paid preparers for their 2012 taxes: 69.9%
Here:
70%
State:
64%
(% for various income ranges: 64.6% for AGIs below $25k, 69.1% for AGIs $25k-50k, 72.4% for AGIs $50k-75k, 74.1% for AGIs $75k-100k, 76.2% for AGIs $100k-200k, 82.7% for AGIs over 200k)
Averages for the 2004 tax year for zip code 91791, filed in 2005:
Average Adjusted Gross Income (AGI) in 2004: $57,293 (Individual Income Tax Returns)
Here:
$57,293
State:
$58,600
Salary/wage: $49,125 (reported on 82.1% of returns)
Here:
$49,125
State:
$49,455
(% of AGI for various income ranges: 178.0% for AGIs below $10k, 75.0% for AGIs $10k-25k, 82.0% for AGIs $25k-50k, 79.9% for AGIs $50k-75k, 81.4% for AGIs $75k-100k, 58.8% for AGIs over 100k)
Taxable interest for individuals: $2,050 (reported on 48.6% of returns)
This zip code:
$2,050
California:
$2,365
(% of AGI for various income ranges: 13.3% for AGIs below $10k, 1.9% for AGIs $10k-25k, 1.3% for AGIs $25k-50k, 1.3% for AGIs $50k-75k, 1.1% for AGIs $75k-100k, 2.0% for AGIs over 100k)
Taxable dividends: $3,674 (reported on 21.2% of returns)
Here:
$3,674
State:
$4,746
(% of AGI for various income ranges: 6.6% for AGIs below $10k, 1.1% for AGIs $10k-25k, 1.0% for AGIs $25k-50k, 0.8% for AGIs $50k-75k, 0.8% for AGIs $75k-100k, 1.8% for AGIs over 100k)
Net capital gain/loss: +$15,345 (reported on 18.7% of returns)
Here:
+$15,345
State:
+$23,418
(% of AGI for various income ranges: 1.9% for AGIs below $10k, 0.0% for AGIs $10k-25k, 0.3% for AGIs $25k-50k, 0.4% for AGIs $50k-75k, 1.3% for AGIs $75k-100k, 9.6% for AGIs over 100k)
Profit/loss from business: +$16,843 (reported on 17.2% of returns)
Here:
+$16,843
State:
+$16,826
(% of AGI for various income ranges: 19.8% for AGIs below $10k, 8.9% for AGIs $10k-25k, 5.0% for AGIs $25k-50k, 4.3% for AGIs $50k-75k, 4.1% for AGIs $75k-100k, 4.9% for AGIs over 100k)
IRA payment deduction: $3,758 (reported on 3.3% of returns)
91791:
$3,758
California:
$3,192
(% of AGI for various income ranges: 0.6% for AGIs below $10k, 0.2% for AGIs $10k-25k, 0.3% for AGIs $25k-50k, 0.3% for AGIs $50k-75k, 0.2% for AGIs $75k-100k, 0.2% for AGIs over 100k)
Self-employed pension: $16,775 (reported on 1.0% of returns)
Here:
$16,775
California:
$17,688
(% of AGI for various income ranges: 0.1% for AGIs $25k-50k, 0.1% for AGIs $50k-75k, 0.1% for AGIs $75k-100k, 0.5% for AGIs over 100k)
Total itemized deductions: $26,793 (27% of AGI, reported on 46.2% of returns)
Here:
$26,793
State:
$28,113
Here:
27.5% of AGI
State:
25.3% of AGI
(% of AGI for various income ranges: 42.0% for AGIs below $10k, 13.8% for AGIs $10k-25k, 22.2% for AGIs $25k-50k, 25.8% for AGIs $50k-75k, 26.9% for AGIs $75k-100k, 19.5% for AGIs over 100k)
Charity contributions deductions: $3,480 (3% of AGI, reported on 41.3% of returns)
Here:
$3,480
State:
$3,923
Here:
3.4% of AGI
State:
3.3% of AGI
(% of AGI for various income ranges: 1.9% for AGIs below $10k, 1.1% for AGIs $10k-25k, 2.1% for AGIs $25k-50k, 2.8% for AGIs $50k-75k, 2.9% for AGIs $75k-100k, 2.7% for AGIs over 100k)
Total tax: $9,340 (reported on 76.2% of returns)
91791:
$9,340
State:
$10,761
(% of AGI for various income ranges: 8.4% for AGIs below $10k, 4.3% for AGIs $10k-25k, 6.3% for AGIs $25k-50k, 8.1% for AGIs $50k-75k, 8.7% for AGIs $75k-100k, 17.9% for AGIs over 100k)
Earned income credit: $1,627 (reported on 13.8% of returns)
Here:
$1,627
State:
$1,763
Percentage of individuals using paid preparers for their 2004 taxes: 71.7%
Here:
72%
State:
66%
(% for various income ranges: 61.4% for AGIs below $10k, 69.8% for AGIs $10k-25k, 72.0% for AGIs $25k-50k, 74.7% for AGIs $50k-75k, 75.4% for AGIs $75k-100k, 81.6% for AGIs over 100k)
Likely homosexual households (counted as self-reported same-sex unmarried-partner households)
Lesbian couples: 0.1% of all households
Gay men: 0.0% of all households
Household received Food Stamps/SNAP in the past 12 months: 1,339 Household did not receive Food Stamps/SNAP in the past 12 months: 9,630
Women who had a birth in the past 12 months: 228 (175 now married, 53 unmarried) Women who did not have a birth in the past 12 months: 6,893 (2,580 now married, 4,319 unmarried)
Housing units in zip code 91791 with a mortgage: 4,628 (427 second mortgage, 19 home equity loan, 324 both second mortgage and home equity loan) Houses without a mortgage: 37
Median monthly owner costs for units with a mortgage: $2,704 Median monthly owner costs for units without a mortgage: $818
Residents with income below the poverty level in 2022:
This zip code:
8.5%
Whole state:
12.2%
Residents with income below 50% of the poverty level in 2022:
This zip code:
3.7%
Whole state:
6.2%
Median number of rooms in houses and condos:
Here:
6.5
State:
6.0
Median number of rooms in apartments:
Here:
3.8
State:
3.9
Notable locations in this zip code not listed on our city pages
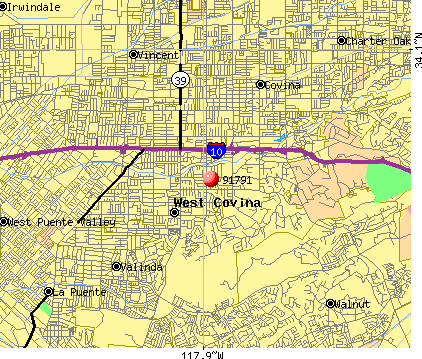
Notable locations in zip code 91791: South Hills Country Club (A), City of West Covina Fire Department Station 2 (B). Display/hide their locations on the map
Shopping Centers: West Covina Plaza Shopping Center (1), South Hills Plaza Shopping Center (2), Eastland Shopping Center (3), Country Club Shopping Center (4), Grand Creek Shopping Center (5). Display/hide their locations on the map
Churches in zip code 91791 include: Union Evangelical Church (A), Christ Lutheran Church (B), Saint Marthas Episcopal Church (C), South Hills Church of Christ (D), United Methodist Church of West Covina (E). Display/hide their locations on the map
3,221 married couples with children.
949 single-parent households (157 men, 792 women).
44.9% of residents of 91791 zip code speak English at home.
30.3% of residents speak Spanish at home (64% very well, 18% well, 9% not well, 9% not at all).
2.4% of residents speak other Indo-European language at home (67% very well, 21% well, 8% not well, 4% not at all).
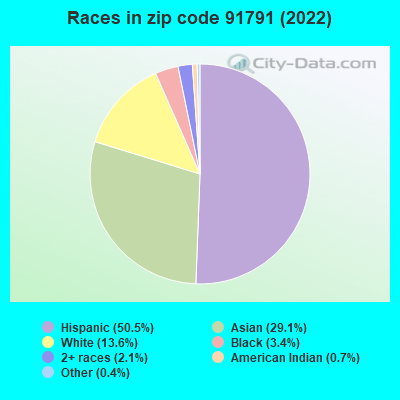
22.0% of residents speak Asian or Pacific Island language at home (48% very well, 28% well, 17% not well, 7% not at all).
0.9% of residents speak other language at home (68% very well, 21% well, 11% not well).
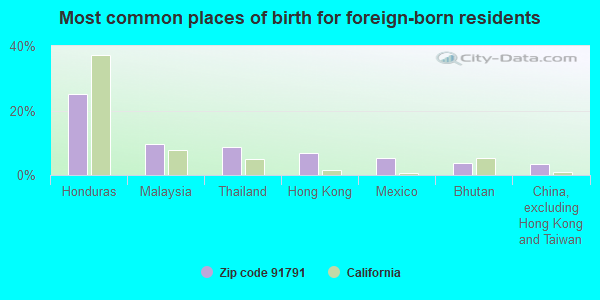
Foreign born population: 12,240 (36.4%) (73.3% of them are naturalized citizens)
Major facilities with environmental interests located in this zip code:
EQUILON ENTERPRISES LLC (305 N CITRUS in WEST COVINA, CA) . Federal Facility
STATE MASTER (California - Hazardous Waste Tracking) - HAZARDOU WASTE PROGRAM Small Quantity Generators, between 100 kg and 1000 kg of hazardous waste/month (Resource Conservation and Recovery Act (tracking hazardous waste)) - notification STATE MASTER (California - Used Oil Recycling System ) - USED OIL RECYCLING Organizations: EQUILON ENTERPRISES, LLC (CONTACT/OWNER)
Alternative names: EZ LUBE #65, SHELL OIL CO
GLIDDEN COMPANY (2501 EAST GARVEY AVENUE in WEST COVINA, CA)
STATE MASTER (California - Hazardous Waste Tracking) - HAZARDOU WASTE PROGRAM Small Quantity Generators, between 100 kg and 1000 kg of hazardous waste/month (Resource Conservation and Recovery Act (tracking hazardous waste)) - notification Alternative names: THE GLIDDEN CO. DBA ICI
GROVECENTER ELEMENTARY (775 N. LARK ELLEN AVE. in WEST COVINA, CA)
(National Center for Education Statistics) - STATE ID-6012512 Organizations: COVINA-VALLEY UNIFIED (SCHOOL DISTRICT)
HOLLENCREST MIDDLE (2101 E. MERCED AVE. in WEST COVINA, CA)
(National Center for Education Statistics) - STATE ID-6023477 Organizations: WEST COVINA UNIFIED (SCHOOL DISTRICT)
MERCED ELEMENTARY (1545 E. MERCED ST. in WEST COVINA, CA)
(National Center for Education Statistics) - STATE ID-6023485 Organizations: WEST COVINA UNIFIED (SCHOOL DISTRICT)
EXXONMOBIL OIL CORP. (201 S AZUSA AVE in WEST COVINA, CA)
HAZARDOUS WASTE BIENNIAL REPORTER (Resource Conservation and Recovery Act (tracking hazardous waste)) Large Quantity Generators, more that 1000 kg of hazardous waste/month (Resource Conservation and Recovery Act (tracking hazardous waste)) Organizations: EXXONMOBIL OIL CORPORATION (CONTACT/OWNER)
ABCO (1818 ADAMS DR in WEST COVINA, CA)
TRANSPORTER (Resource Conservation and Recovery Act (tracking hazardous waste))
EXPRESS CLEANERS (1347 S AZUSA AVE STE E in WEST COVINA, CA)
Small Quantity Generators, between 100 kg and 1000 kg of hazardous waste/month (Resource Conservation and Recovery Act (tracking hazardous waste)) - notification Organizations: DADAYAN VARUZHAN (CONTACT/OWNER)
, VAROUZAN DANAYAN (CONTACT/OWNER)
GOLDEN OIL (1423 THACKERY in WEST COVINA, CA)
TRANSPORTER (Resource Conservation and Recovery Act (tracking hazardous waste)) Organizations: TIMOTHY GOLDEN (CONTACT/OWNER)
GREENHILLS AUTOMOTIVE (360 S GLENDORA AVE in WEST COVINA, CA)
Small Quantity Generators, between 100 kg and 1000 kg of hazardous waste/month (Resource Conservation and Recovery Act (tracking hazardous waste)) - notification Organizations: RUBIN FELD SAM (CONTACT/OWNER)
H Q CLEANERS (425 N AZUSA AVE in WEST COVINA, CA)
Small Quantity Generators, between 100 kg and 1000 kg of hazardous waste/month (Resource Conservation and Recovery Act (tracking hazardous waste)) - notification Organizations: KIM HYUN NAM (CONTACT/OWNER)
MANDY WILLIAMS OLDSMOBILE (2525 E WORKMAN AVE in WEST COVINA, CA)
Small Quantity Generators, between 100 kg and 1000 kg of hazardous waste/month (Resource Conservation and Recovery Act (tracking hazardous waste)) - notification
A L R ENGINEERING (100 N BARRANCA AVE in WEST COVINA, CA)
Small Quantity Generators, between 100 kg and 1000 kg of hazardous waste/month (Resource Conservation and Recovery Act (tracking hazardous waste))
Housing units lacking complete plumbing facilities: 0.8% Housing units lacking complete kitchen facilities: 4.3%
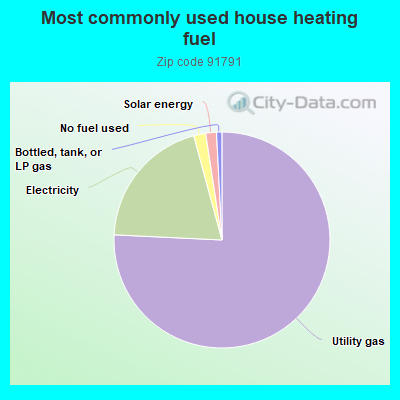
75.7%Utility gas
20.0%Electricity
1.8%No fuel used
1.6%Solar energy
0.8%Bottled, tank, or LP gas
Population in 1990: 25,685. Population change in the 1990s: +4,757 (+18.5%).
Place of birth for U.S.-born residents:
This state: 18,871
Northeast: 296
Midwest: 679
South: 837
West: 490
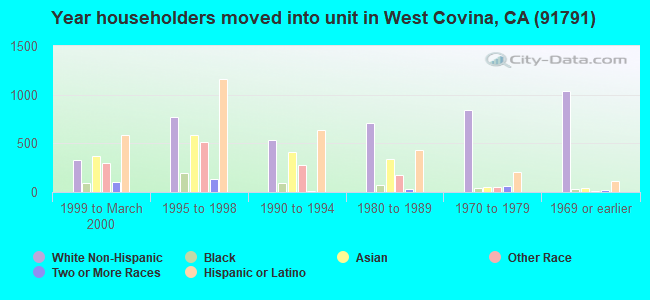
59% of the 91791 zip code residents lived in the same house 5 years ago. Out of people who lived in different houses, 86% lived in this county. Out of people who lived in different counties, 50% lived in California.
92% of the 91791 zip code residents lived in the same house 1 year ago. Out of people who lived in different houses, 78% moved from this county. Out of people who lived in different houses, 12% moved from different county within same state. Out of people who lived in different houses, 2% moved from different state. Out of people who lived in different houses, 8% moved from abroad.
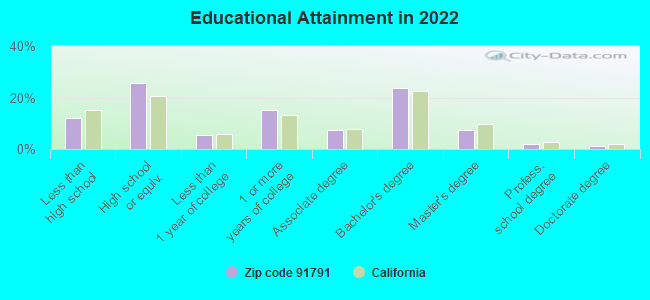
Private vs. public school enrollment:
Students in private schools in grades 1 to 8 (elementary and middle school): 292
Here:
11.3%
California:
10.5%
Students in private schools in grades 9 to 12 (high school): 150
Here:
9.8%
California:
8.5%
Students in private undergraduate colleges: 304
Here:
14.0%
California:
15.9%
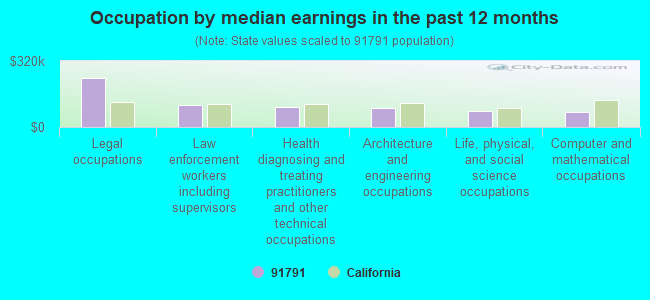
Occupation by median earnings in the past 12 months ($)
237,352Legal occupations
107,428Law enforcement workers including supervisors
97,955Health diagnosing and treating practitioners and other technical occupations
91,039Architecture and engineering occupations
78,782Life, physical, and social science occupations
73,897Computer and mathematical occupations
Companies with federal contracts located in this zip code:
METRO MONITORING SERVICES (2859 EVANDERHOOF DR in WEST COVINA, CA; small business) : $1,474,606 in 25 contractsfrom 1999 to 2003
Contracts for Facilities Operations Support Services, Weather Reporting/Observation Services by Army, National Oceanic and Atmospheric Administration/Under Secretary for Oceans and Atmosphere, U.S. Army Corps of Engineers - civil program financing only Signed by year:2000: $224,213; 2001: $601,069; 2002: $482,321; 2003: -$189,210; 2004: $0; 2005: $0; 2006: $0.
Biggest contracts:
$313,761 with Army for Facilities Operations Support Services. Taking place in PA. Signed on 2001-12-04. Completion date: 2002-09-30.
$270,719, same as above.Signed on 2002-11-22. Completion date: 2002-09-30.
$167,000 with National Oceanic and Atmospheric Administration/Under Secretary for Oceans and Atmosphere for Weather Reporting/Observation Services. Taking place in UT. Signed on 1999-10-15. Completion date: 2000-09-15.
$166,308 with U.S. Army Corps of Engineers - civil program financing only for Facilities Operations Support Services. Taking place in FL. Signed on 2001-10-01. Completion date: 2002-09-30.
BRIGHTON MANAGEMENT (3211 E GARVEY AVE N in WEST COVINA, CA; small business) : $13,866 in 2 contractsin 2004
$11,346 with Army for Lodging - Hotel/Motel. Signed on 2004-09-02. Completion date: 2004-09-09.
$2,520, same as above.Signed on 2004-01-21. Completion date: 2004-01-10.
Top industries in this zip code by the number of employees in 2005:
2005 - 2011 National Fire Incident Reporting System (NFIRS) incidents
According to the data from the years 2005 - 2011 the average number of fires per year is 28. The highest number of reported fire incidents - 77 took place in 2005, and the least - 0 in 2007. The data has a decreasing trend.
When looking into fire subcategories, the most incidents belonged to: Mobile Property/Vehicle Fires (37.2%), and Structure Fires (30.6%).
Fire incident types reported to NFIRS in Zip Code 91791


 Nearest zip codes: 91723, 91722, 91792, 91724, 91790, 91744.
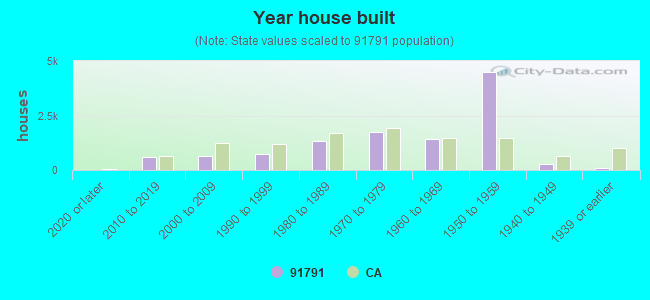


 . Federal Facility

 According to the data from the years 2005 - 2011 the average number of fires per year is 28. The highest number of reported fire incidents - 77 took place in 2005, and the least - 0 in 2007. The data has a decreasing trend.
 When looking into fire subcategories, the most incidents belonged to: Mobile Property/Vehicle Fires (37.2%), and Structure Fires (30.6%).