Estimated zip code population in 2022: 33,158 Zip code population in 2010: 33,249 Zip code population in 2000: 35,512
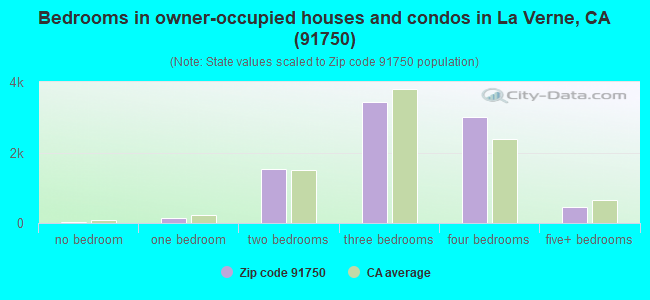
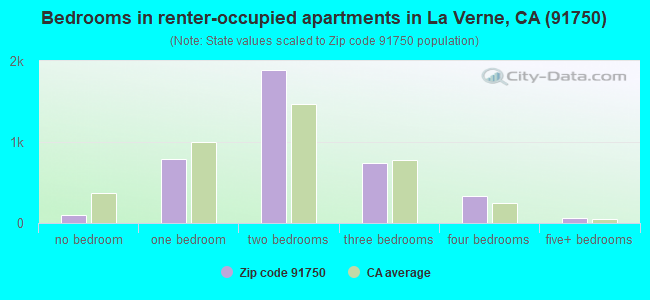
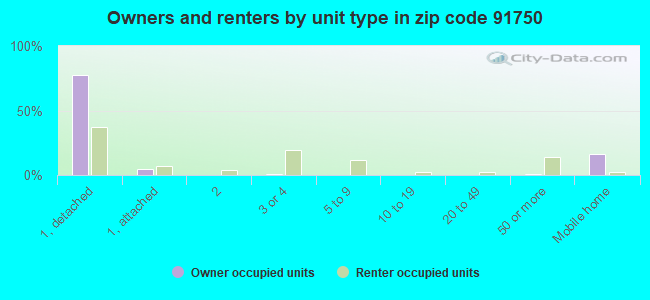
Houses and condos: 12,972 Renter-occupied apartments: 3,928
% of renters here:
31%
State:
44%
March 2022 cost of living index in zip code 91750: 133.7 (high, U.S. average is 100)
Land area: 25.2 sq. mi. Water area: 0.2 sq. mi.
Population density: 1,314 people per square mile
(low).
OSM Map
General Map
Google Map
MSN Map
OSM Map
General Map
Google Map
MSN Map
OSM Map
General Map
Google Map
MSN Map
OSM Map
General Map
Google Map
MSN Map
Please wait while loading the map...
Real estate property taxes paid for housing units in 2022:
This zip code:
0.6% ($5,024)
California:
0.7% ($4,831)
Median real estate property taxes paid for housing units with mortgages in 2022: $6,055 (0.7%) Median real estate property taxes paid for housing units with no mortgage in 2022: $3,231 (0.5%)
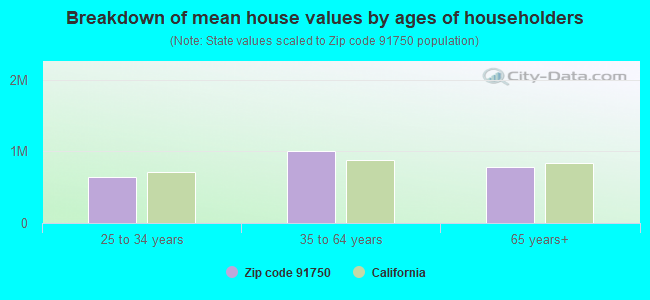
Estimated median house/condo value in 2022: $797,556
91750:
$797,556
California:
$715,900
According to our research of California and other state lists, there were 26 registered sex offenders living in 91750 zip code as of April 27, 2024. The ratio of all residents to sex offenders in zip code 91750 is 1,333 to 1. The ratio of registered sex offenders to all residents in this zip code is lower than the state average.
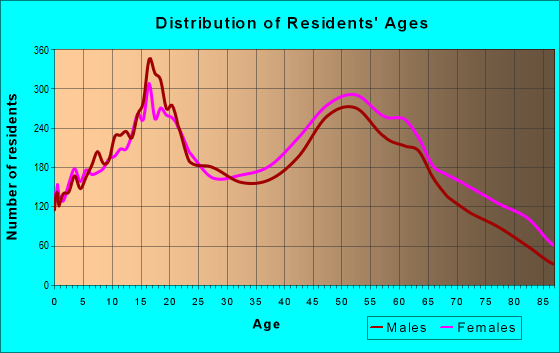
Median resident age:
This zip code:
45.8 years
California median age:
37.9 years
Average household size:
This zip code:
2.6 people
California:
2.8 people
Averages for the 2020 tax year for zip code 91750, filed in 2021:
Average Adjusted Gross Income (AGI) in 2020: $94,257 (Individual Income Tax Returns)
Here:
$94,257
State:
$95,910
Salary/wage: $77,100 (reported on 75.5% of returns)
Here:
$77,100
State:
$77,331
(% of AGI for various income ranges: 1146.8% for AGIs below $25k, 3716.4% for AGIs $25k-50k, 6731.7% for AGIs $50k-75k, 9905.5% for AGIs $75k-100k, 20010.7% for AGIs $100k-200k, 71186.8% for AGIs over 200k)
Taxable interest for individuals: $1,851 (reported on 44.4% of returns)
This zip code:
$1,851
California:
$2,294
(% of AGI for various income ranges: 24.2% for AGIs below $25k, 38.5% for AGIs $25k-50k, 77.4% for AGIs $50k-75k, 104.6% for AGIs $75k-100k, 176.8% for AGIs $100k-200k, 1538.9% for AGIs over 200k)
Ordinary dividends: $7,042 (reported on 22.7% of returns)
Here:
$7,042
State:
$10,949
(% of AGI for various income ranges: 39.8% for AGIs below $25k, 49.7% for AGIs $25k-50k, 107.7% for AGIs $50k-75k, 209.8% for AGIs $75k-100k, 340.4% for AGIs $100k-200k, 3297.2% for AGIs over 200k)
Net capital gain/loss in AGI: +$25,996 (reported on 21.9% of returns)
Here:
+$25,996
State:
+$49,306
(% of AGI for various income ranges: 9.8% for AGIs below $25k, 34.4% for AGIs $25k-50k, 78.4% for AGIs $50k-75k, 162.8% for AGIs $75k-100k, 468.1% for AGIs $100k-200k, 18103.2% for AGIs over 200k)
Profit/loss from business: +$13,598 (reported on 17.5% of returns)
Here:
+$13,598
State:
+$15,671
(% of AGI for various income ranges: 141.2% for AGIs below $25k, 199.0% for AGIs $25k-50k, 239.8% for AGIs $50k-75k, 343.6% for AGIs $75k-100k, 536.8% for AGIs $100k-200k, 3348.9% for AGIs over 200k)
Taxable individual retirement arrangement distribution: $21,663 (reported on 10.3% of returns)
91750:
$21,663
California:
$23,505
(% of AGI for various income ranges: 79.5% for AGIs below $25k, 135.1% for AGIs $25k-50k, 260.6% for AGIs $50k-75k, 511.6% for AGIs $75k-100k, 808.7% for AGIs $100k-200k, 2096.8% for AGIs over 200k)
Self-employed (Keogh) retirement plans: $30,110 (reported on 0.6% of returns)
91750:
$30,110
California:
$30,163
(% of AGI for various income ranges: 42.6% for AGIs $100k-200k, 482.8% for AGIs over 200k)
Total itemized deductions: $47,501 (reported on 22.9% of returns)
Here:
$47,501
State:
$39,517
(% of AGI for various income ranges: 128.0% for AGIs below $25k, 307.5% for AGIs $25k-50k, 712.7% for AGIs $50k-75k, 1519.1% for AGIs $75k-100k, 2999.2% for AGIs $100k-200k, 20784.7% for AGIs over 200k)
Charity contributions: $7,525 (reported on 20.3% of returns)
Here:
$7,525
State:
$12,598
(% of AGI for various income ranges: 7.7% for AGIs below $25k, 34.5% for AGIs $25k-50k, 90.8% for AGIs $50k-75k, 219.2% for AGIs $75k-100k, 475.7% for AGIs $100k-200k, 2843.0% for AGIs over 200k)
Taxes paid: $8,861 (reported on 22.9% of returns)
91750:
$8,861
State:
$8,807
(% of AGI for various income ranges: 24.6% for AGIs below $25k, 68.2% for AGIs $25k-50k, 176.2% for AGIs $50k-75k, 434.5% for AGIs $75k-100k, 882.1% for AGIs $100k-200k, 2169.4% for AGIs over 200k)
Earned income credit: $1,671 (reported on 9.2% of returns)
Here:
$1,671
State:
$2,074
(% of AGI for various income ranges: 53.0% for AGIs below $25k, 47.0% for AGIs $25k-50k, 0.6% for AGIs $50k-75k)
Percentage of individuals using paid preparers for their 2020 taxes: 92.3%
Here:
92%
State:
92%
(% for various income ranges: 91.2% for AGIs below $25k, 92.1% for AGIs $25k-50k, 92.3% for AGIs $50k-75k, 92.7% for AGIs $75k-100k, 92.9% for AGIs $100k-200k, 94.3% for AGIs over 200k)
Averages for the 2012 tax year for zip code 91750, filed in 2013:
Average Adjusted Gross Income (AGI) in 2012: $76,717 (Individual Income Tax Returns)
Here:
$76,717
State:
$72,726
Salary/wage: $65,495 (reported on 79.3% of returns)
Here:
$65,495
State:
$59,079
(% of AGI for various income ranges: 66.8% for AGIs below $25k, 71.7% for AGIs $25k-50k, 70.5% for AGIs $50k-75k, 71.1% for AGIs $75k-100k, 77.4% for AGIs $100k-200k, 52.7% for AGIs over 200k)
Taxable interest for individuals: $1,397 (reported on 46.8% of returns)
This zip code:
$1,397
California:
$2,146
(% of AGI for various income ranges: 1.8% for AGIs below $25k, 0.8% for AGIs $25k-50k, 0.8% for AGIs $50k-75k, 0.8% for AGIs $75k-100k, 0.6% for AGIs $100k-200k, 1.0% for AGIs over 200k)
Ordinary dividends: $4,895 (reported on 22.5% of returns)
Here:
$4,895
State:
$9,308
(% of AGI for various income ranges: 1.7% for AGIs below $25k, 1.0% for AGIs $25k-50k, 1.2% for AGIs $50k-75k, 1.2% for AGIs $75k-100k, 0.9% for AGIs $100k-200k, 2.3% for AGIs over 200k)
Net capital gain/loss in AGI: +$9,748 (reported on 19.0% of returns)
Here:
+$9,748
State:
+$30,460
(% of AGI for various income ranges: 0.1% for AGIs $25k-50k, 0.4% for AGIs $50k-75k, 0.3% for AGIs $75k-100k, 0.8% for AGIs $100k-200k, 7.2% for AGIs over 200k)
Profit/loss from business: +$14,299 (reported on 16.9% of returns)
Here:
+$14,299
State:
+$17,064
(% of AGI for various income ranges: 9.6% for AGIs below $25k, 5.3% for AGIs $25k-50k, 3.6% for AGIs $50k-75k, 2.5% for AGIs $75k-100k, 2.5% for AGIs $100k-200k, 2.2% for AGIs over 200k)
Taxable individual retirement arrangement distribution: $16,900 (reported on 11.3% of returns)
91750:
$16,900
California:
$19,557
(% of AGI for various income ranges: 3.6% for AGIs below $25k, 3.2% for AGIs $25k-50k, 3.1% for AGIs $50k-75k, 3.2% for AGIs $75k-100k, 2.4% for AGIs $100k-200k, 1.7% for AGIs over 200k)
Self-employment retirement plans: $18,715 (reported on 0.8% of returns)
91750:
$18,715
California:
$24,530
(% of AGI for various income ranges: 0.2% for AGIs $50k-75k, 0.2% for AGIs $100k-200k, 0.4% for AGIs over 200k)
Total itemized deductions: $33,731 (26% of AGI, reported on 47.4% of returns)
Here:
$33,731
State:
$34,004
Here:
26.3% of AGI
State:
22.7% of AGI
(% of AGI for various income ranges: 13.4% for AGIs below $25k, 16.1% for AGIs $25k-50k, 20.9% for AGIs $50k-75k, 21.8% for AGIs $75k-100k, 22.0% for AGIs $100k-200k, 21.8% for AGIs over 200k)
Charity contributions: $4,084 (reported on 42.6% of returns)
Here:
$4,084
State:
$4,659
(% of AGI for various income ranges: 1.0% for AGIs below $25k, 1.6% for AGIs $25k-50k, 2.5% for AGIs $50k-75k, 2.5% for AGIs $75k-100k, 2.6% for AGIs $100k-200k, 2.2% for AGIs over 200k)
Taxes paid: $11,600 (reported on 47.2% of returns)
91750:
$11,600
State:
$14,448
(% of AGI for various income ranges: 2.4% for AGIs below $25k, 3.4% for AGIs $25k-50k, 5.3% for AGIs $50k-75k, 6.7% for AGIs $75k-100k, 8.0% for AGIs $100k-200k, 8.9% for AGIs over 200k)
Earned income credit: $1,869 (reported on 11.4% of returns)
Here:
$1,869
State:
$2,286
(% of AGI for various income ranges: 4.1% for AGIs below $25k, 0.8% for AGIs $25k-50k)
Percentage of individuals using paid preparers for their 2012 taxes: 67.0%
Here:
67%
State:
64%
(% for various income ranges: 58.6% for AGIs below $25k, 65.3% for AGIs $25k-50k, 69.8% for AGIs $50k-75k, 72.0% for AGIs $75k-100k, 74.3% for AGIs $100k-200k, 81.5% for AGIs over 200k)
Averages for the 2004 tax year for zip code 91750, filed in 2005:
Average Adjusted Gross Income (AGI) in 2004: $61,739 (Individual Income Tax Returns)
Here:
$61,739
State:
$58,600
Salary/wage: $56,511 (reported on 81.8% of returns)
Here:
$56,511
State:
$49,455
(% of AGI for various income ranges: 139.2% for AGIs below $10k, 70.2% for AGIs $10k-25k, 76.0% for AGIs $25k-50k, 76.1% for AGIs $50k-75k, 80.7% for AGIs $75k-100k, 72.2% for AGIs over 100k)
Taxable interest for individuals: $1,628 (reported on 55.6% of returns)
This zip code:
$1,628
California:
$2,365
(% of AGI for various income ranges: 8.0% for AGIs below $10k, 3.2% for AGIs $10k-25k, 1.7% for AGIs $25k-50k, 1.4% for AGIs $50k-75k, 1.2% for AGIs $75k-100k, 1.2% for AGIs over 100k)
Taxable dividends: $2,986 (reported on 26.7% of returns)
Here:
$2,986
State:
$4,746
(% of AGI for various income ranges: 6.4% for AGIs below $10k, 1.6% for AGIs $10k-25k, 1.0% for AGIs $25k-50k, 1.0% for AGIs $50k-75k, 0.8% for AGIs $75k-100k, 1.5% for AGIs over 100k)
Net capital gain/loss: +$9,234 (reported on 22.5% of returns)
Here:
+$9,234
State:
+$23,418
(% of AGI for various income ranges: -3.7% for AGIs below $10k, -0.1% for AGIs $10k-25k, 0.5% for AGIs $25k-50k, 0.5% for AGIs $50k-75k, 1.2% for AGIs $75k-100k, 5.9% for AGIs over 100k)
Profit/loss from business: +$15,115 (reported on 17.5% of returns)
Here:
+$15,115
State:
+$16,826
(% of AGI for various income ranges: 10.2% for AGIs below $10k, 7.5% for AGIs $10k-25k, 6.0% for AGIs $25k-50k, 3.9% for AGIs $50k-75k, 3.4% for AGIs $75k-100k, 3.8% for AGIs over 100k)
Profit/loss from farming: +$4,500 (reported on 0.1% of returns)
Here:
+$4,500
State:
-$7,562
IRA payment deduction: $3,503 (reported on 3.2% of returns)
91750:
$3,503
California:
$3,192
(% of AGI for various income ranges: 0.7% for AGIs below $10k, 0.2% for AGIs $10k-25k, 0.3% for AGIs $25k-50k, 0.2% for AGIs $50k-75k, 0.2% for AGIs $75k-100k, 0.1% for AGIs over 100k)
Self-employed pension: $12,731 (reported on 1.2% of returns)
Here:
$12,731
California:
$17,688
(% of AGI for various income ranges: 0.1% for AGIs $25k-50k, 0.1% for AGIs $50k-75k, 0.1% for AGIs $75k-100k, 0.4% for AGIs over 100k)
Total itemized deductions: $27,564 (27% of AGI, reported on 48.7% of returns)
Here:
$27,564
State:
$28,113
Here:
26.9% of AGI
State:
25.3% of AGI
(% of AGI for various income ranges: 26.7% for AGIs below $10k, 15.0% for AGIs $10k-25k, 19.4% for AGIs $25k-50k, 24.5% for AGIs $50k-75k, 25.0% for AGIs $75k-100k, 21.3% for AGIs over 100k)
Charity contributions deductions: $3,837 (4% of AGI, reported on 45.6% of returns)
Here:
$3,837
State:
$3,923
Here:
3.6% of AGI
State:
3.3% of AGI
(% of AGI for various income ranges: 1.3% for AGIs below $10k, 1.5% for AGIs $10k-25k, 2.1% for AGIs $25k-50k, 3.0% for AGIs $50k-75k, 3.2% for AGIs $75k-100k, 3.0% for AGIs over 100k)
Total tax: $9,761 (reported on 79.9% of returns)
91750:
$9,761
State:
$10,761
(% of AGI for various income ranges: 5.0% for AGIs below $10k, 4.7% for AGIs $10k-25k, 7.1% for AGIs $25k-50k, 8.5% for AGIs $50k-75k, 9.3% for AGIs $75k-100k, 16.9% for AGIs over 100k)
Earned income credit: $1,491 (reported on 9.1% of returns)
Here:
$1,491
State:
$1,763
Percentage of individuals using paid preparers for their 2004 taxes: 69.5%
Here:
70%
State:
66%
(% for various income ranges: 58.3% for AGIs below $10k, 64.6% for AGIs $10k-25k, 69.9% for AGIs $25k-50k, 75.1% for AGIs $50k-75k, 75.0% for AGIs $75k-100k, 78.2% for AGIs over 100k)
Likely homosexual households (counted as self-reported same-sex unmarried-partner households)
Lesbian couples: 0.3% of all households
Gay men: 0.2% of all households
Household received Food Stamps/SNAP in the past 12 months: 935 Household did not receive Food Stamps/SNAP in the past 12 months: 11,456
Women who had a birth in the past 12 months: 184 (95 now married, 89 unmarried) Women who did not have a birth in the past 12 months: 6,585 (2,723 now married, 3,857 unmarried)
Housing units in zip code 91750 with a mortgage: 5,407 (604 second mortgage, 562 both second mortgage and home equity loan) Houses without a mortgage: 40
Median monthly owner costs for units with a mortgage: $2,969 Median monthly owner costs for units without a mortgage: $845
Residents with income below the poverty level in 2022:
This zip code:
8.2%
Whole state:
12.2%
Residents with income below 50% of the poverty level in 2022:
This zip code:
4.2%
Whole state:
6.2%
Median number of rooms in houses and condos:
Here:
6.4
State:
6.0
Median number of rooms in apartments:
Here:
4.2
State:
3.9
Notable locations in this zip code not listed on our city pages
Notable locations in zip code 91750: San Dimas Station (A), Mountain Meadows Country Club (B), Flintham Memorial Forest Plantation (C), Weymouth Filtration Plant (D), Sierra La Verne Golf Course (E), Marshall Canyon Golf Course (F), Veterans Hall (G), La Verne Community Center (H), La Verne City Hall (I), La Verne Branch County of Los Angeles Public Library (J), Le Roy Boys Home (K), La Verne Fire Department Station 2 (L), La Verne Fire Department Station 1 Headquarters (M). Display/hide their locations on the map
Churches in zip code 91750 include: Calvary Baptist Church of La Verne (A), Church of Christ (B), Church of the Brethren (C), First Baptist Church of La Verne (D), First Foursquare Gospel Church of La Verne (E), Grace Brethren Church (F), House of Praise (G), La Verne Heights Presbyterian Church (H), Love and Faith World Outreach Church (I). Display/hide their locations on the map
Parks in zip code 91750 include: Marshall Canyon Regional Park (1), Spartan Stadium (2), Kuns Park (3), Emerald Park (4), Heritage Park (5), La Verne Recreation Park (6), Las Flores Park (7), Lincoln Mini Park (8), Los Encinos Park (9). Display/hide their locations on the map
4,275 married couples with children.
1,559 single-parent households (556 men, 1,003 women).
75.7% of residents of 91750 zip code speak English at home.
12.0% of residents speak Spanish at home (76% very well, 14% well, 8% not well, 2% not at all).
3.4% of residents speak other Indo-European language at home (85% very well, 11% well, 4% not well).
7.3% of residents speak Asian or Pacific Island language at home (49% very well, 19% well, 28% not well, 3% not at all).
1.8% of residents speak other language at home (75% very well, 16% well, 9% not well).
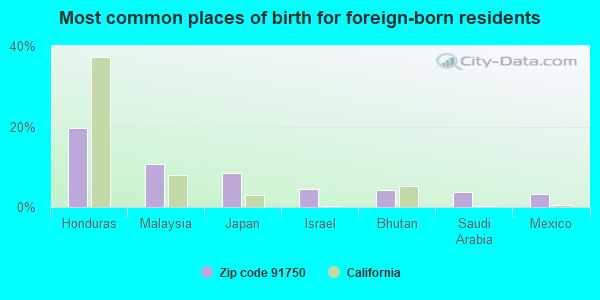
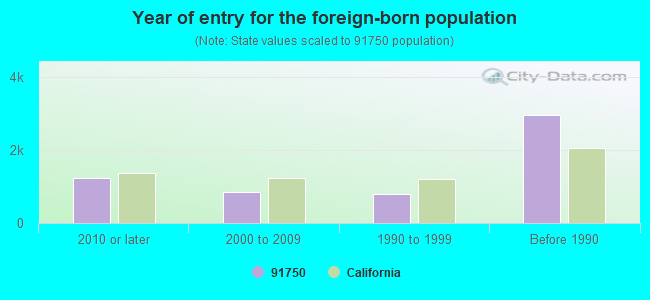
Foreign born population: 5,634 (17.0%) (72.0% of them are naturalized citizens)
This zip code:
17.0%
Whole state:
26.7%
20%Honduras
11%Malaysia
9%Japan
4%Israel
4%Bhutan
4%Saudi Arabia
3%Mexico
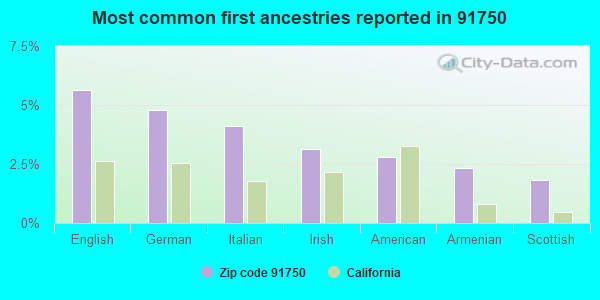
6%English
5%German
4%Italian
3%Irish
3%American
2%Armenian
2%Scottish
Year of entry for the foreign-born population
1,2442010 or later
8632000 to 2009
8061990 to 1999
2,962Before 1990
Major facilities with environmental interests located in this zip code:
GAINEY CERAMICS INCORPORATED (1200 ARROW HWY in LA VERNE, CA)
AIR MAJOR (AIRS/AFS) STATE MASTER (California - Hazardous Waste Tracking) - HAZARDOU WASTE PROGRAM CRITERIA AND HAZARDOUS AIR POLLUTANT INVENTORY (Inventory of air pollution sources) Small Quantity Generators, between 100 kg and 1000 kg of hazardous waste/month (Resource Conservation and Recovery Act (tracking hazardous waste)) - notification TRI REPORTER (Tracking of toxic chemicals releasing facilities) Business SIC classification: POTTERY PRODUCTS Business NAICS classification: VITREOUS CHINA, FINE EARTHENWARE, AND OTHER POTTERY PRODUCT MANUFACTURING. Organizations: JOHN GAINEY (CONTACT/OWNER)
LOAD CENTER (1510 WHITE in LA VERNE, CA)
STATE MASTER (California - Hazardous Waste Tracking) - HAZARDOU WASTE PROGRAM Small Quantity Generators, between 100 kg and 1000 kg of hazardous waste/month (Resource Conservation and Recovery Act (tracking hazardous waste)) Small Quantity Generators, between 100 kg and 1000 kg of hazardous waste/month (Resource Conservation and Recovery Act (tracking hazardous waste)) - notification Organizations: CARL P ATTMAN (CONTACT/OWNER)
CAL WEST ENVIRONMENTAL SERVICES INC (2386 1ST ST in LA VERNE, CA)
STATE MASTER (California - Hazardous Waste Tracking) - HAZARDOU WASTE PROGRAM COMPLIANCE ACTIVITY (Tracking inspections of insecticide, fungicide, and rodenticide, and toxic substances) TRANSPORTER (Resource Conservation and Recovery Act (tracking hazardous waste)) USED OIL PROGRAM (Resource Conservation and Recovery Act (tracking hazardous waste)) Organizations: PAUL WILLIAMS (CONTACT/OWNER)
Alternative names: CAL WEST ENVIORNMENTAL SERVICES
EMERALD CLEANERS (3836 N EMERALD in LA VERNE, CA)
STATE MASTER (California - Hazardous Waste Tracking) - HAZARDOU WASTE PROGRAM TRANSPORTER (Resource Conservation and Recovery Act (tracking hazardous waste)) - notification Organizations: JOHN R HOUSTON (CONTACT/OWNER)
LA VERNE METAL PRODUCTS (900 PALOMARES in LA VERNE, CA)
STATE MASTER (California - Hazardous Waste Tracking) - HAZARDOU WASTE PROGRAM Small Quantity Generators, between 100 kg and 1000 kg of hazardous waste/month (Resource Conservation and Recovery Act (tracking hazardous waste)) TRI REPORTER (Tracking of toxic chemicals releasing facilities) Business SIC classification: FABRICATED METAL PRODUCTS Business NAICS classification: METAL STAMPING. Alternative names: PACIFIC PRECISION METALS LA VERNE, PACIFIC PRECISION METALS LA VERNE METAL PRODS.
ANGELO J MARTINEZ DBA AMARTZ (2664 LAS COLIMAS in LA VERNE, CA)
STATE MASTER (California - Hazardous Waste Tracking) - HAZARDOU WASTE PROGRAM TRANSPORTER (Resource Conservation and Recovery Act (tracking hazardous waste))
EQUILON ENTERPRISES (1090 FOOTHILL in LA VERNE, CA) . Federal Facility
STATE MASTER (California - Hazardous Waste Tracking) - HAZARDOU WASTE PROGRAM Small Quantity Generators, between 100 kg and 1000 kg of hazardous waste/month (Resource Conservation and Recovery Act (tracking hazardous waste)) - notification Organizations: EQUILON ENTERPRISES, LLC (CONTACT/OWNER)
Alternative names: SHELL OIL CO
F. E. WEYMOUTH WATER TREATMENT PLANT (700 NORTH MORENO AVE in LA VERNE, CA)
HAZARDOUS WASTE BIENNIAL REPORTER (Resource Conservation and Recovery Act (tracking hazardous waste)) Large Quantity Generators, more that 1000 kg of hazardous waste/month (Resource Conservation and Recovery Act (tracking hazardous waste)) Organizations: JAIME PAZ (CONTACT/OPERATOR)
, METROPOLITAN WATER DIST. OF SO. CALIF. (CONTACT/OWNER)
Alternative names: F E WEYMOUTH FILTRATION PLANT, LA VERNE FACILITY
HILLCREST (2609 PARK AVE in LA VERNE, CA)
Large Quantity Generators, more that 1000 kg of hazardous waste/month (Resource Conservation and Recovery Act (tracking hazardous waste)) TRANSPORTER (Resource Conservation and Recovery Act (tracking hazardous waste)) Organizations: CHARLES E CABLE (CONTACT/OPERATOR)
ACME CLEANERS (1445 FOOTHILL BLVD in LA VERNE, CA)
Small Quantity Generators, between 100 kg and 1000 kg of hazardous waste/month (Resource Conservation and Recovery Act (tracking hazardous waste)) - notification Organizations: CHOI PYO JA (CONTACT/OWNER)
AEROFIX (1522 PUDDINGSTONE DRIVE K-5 in LA VERNE, CA)
Small Quantity Generators, between 100 kg and 1000 kg of hazardous waste/month (Resource Conservation and Recovery Act (tracking hazardous waste)) - notification Organizations: LEE CONNER (CONTACT/OWNER)
KILO INTERNATIONAL (2118 D STREET in LA VERNE, CA)
Small Quantity Generators, between 100 kg and 1000 kg of hazardous waste/month (Resource Conservation and Recovery Act (tracking hazardous waste)) - notification Organizations: KILO ENGINEERING INC (CONTACT/OWNER)
LA VERNE TOWNE CENTER CLNRS (2320 FOOTHILL BLVD #8 in LA VERNE, CA)
Small Quantity Generators, between 100 kg and 1000 kg of hazardous waste/month (Resource Conservation and Recovery Act (tracking hazardous waste)) Organizations: BARKUZAN ABDEEN (CONTACT/OWNER)
Housing units lacking complete plumbing facilities: 0.9% Housing units lacking complete kitchen facilities: 1.7%
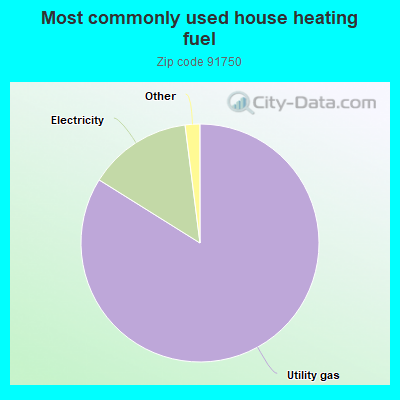
83.9%Utility gas
14.1%Electricity
0.8%Bottled, tank, or LP gas
0.7%No fuel used
Population in 1990: 33,621. Population change in the 1990s: +1,891 (+5.6%).
Place of birth for U.S.-born residents:
This state: 22,131
Northeast: 1,285
Midwest: 1,601
South: 1,380
West: 817
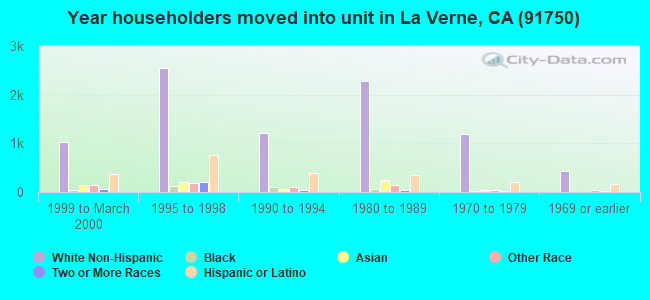
58% of the 91750 zip code residents lived in the same house 5 years ago. Out of people who lived in different houses, 78% lived in this county. Out of people who lived in different counties, 50% lived in California.
93% of the 91750 zip code residents lived in the same house 1 year ago. Out of people who lived in different houses, 65% moved from this county. Out of people who lived in different houses, 27% moved from different county within same state. Out of people who lived in different houses, 6% moved from different state. Out of people who lived in different houses, 4% moved from abroad.
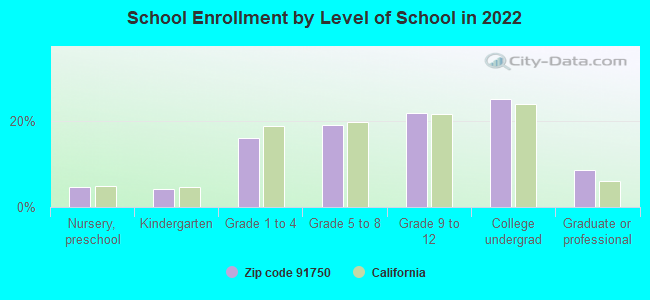
Private vs. public school enrollment:
Students in private schools in grades 1 to 8 (elementary and middle school): 415
Here:
13.7%
California:
10.5%
Students in private schools in grades 9 to 12 (high school): 175
Here:
9.3%
California:
8.5%
Students in private undergraduate colleges: 731
Here:
33.4%
California:
15.9%
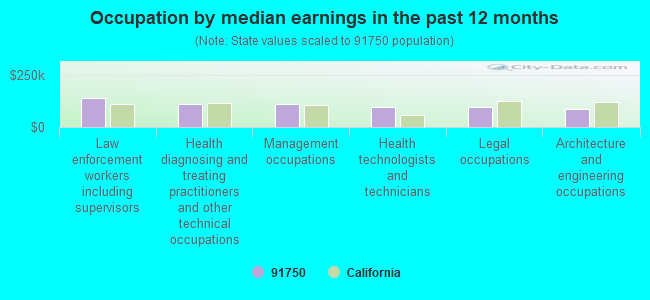
Occupation by median earnings in the past 12 months ($)
139,998Law enforcement workers including supervisors
109,242Health diagnosing and treating practitioners and other technical occupations
108,089Management occupations
94,722Health technologists and technicians
94,465Legal occupations
85,496Architecture and engineering occupations
Companies with biggest federal contracts located in this zip code (LA VERNE, CA):
ACE ENGINEERING, INC (1880 WRIGHT AVE; small business) : $150,201,955 in 1160 contractsfrom 1999 to 2006
Contracts for Maintenance, Repair or Alteration of Real Property -- Electronic and Communications Facilities, Construction of Structures and Facilities -- Other Conservation and Development Facilities, Maintenance, Repair or Alteration of Real Property -- Other Non-Building Facilities, Maintenance, Repair or Alteration of Real Property -- Miscellaneous Buildings, and moreby Air Force, U.S. Army Corps of Engineers - civil program financing only, Navy, Army, and others Signed by year:2000: $21,145,835; 2001: $24,752,217; 2002: $18,714,645; 2003: $32,349,752; 2004: $17,445,302; 2005: $28,545,892; 2006: $4,815,207.
Biggest contracts:
$4,498,053 with Air Force for Maintenance, Repair or Alteration of Real Property -- Electronic and Communications Facilities. Signed on 2005-09-24. Completion date: 2008-01-18.
$4,150,000 with U.S. Army Corps of Engineers - civil program financing only for Construction of Structures and Facilities -- Other Conservation and Development Facilities. Taking place in NV. Signed on 2002-03-07. Completion date: 2002-05-09.
$3,199,986 with Navy for Maintenance, Repair or Alteration of Real Property -- Other Non-Building Facilities. Signed on 2001-09-24. Completion date: 2002-06-06.
$2,998,992 with Air Force for Maintenance, Repair or Alteration of Real Property -- Miscellaneous Buildings. Signed on 2000-01-28. Completion date: 2000-12-30.
CHANG INDUSTRY, INC (1925 MCKINLEY AVENUE; small business) : $50,164,191 in 51 contractsfrom 1999 to 2006
Contracts for Services -- Applied Research and Exploratory Development (R&D), Services -- Engineering Development (R&D), Engineering and Technical Services, Defense Electronics and Communication Equipment -- Operational Systems Development (R&D), and moreby Army, Department of Defense Signed by year:2000: $1,523,996; 2001: $5,150,066; 2002: $7,632,613; 2003: $6,895,942; 2004: $10,817,701; 2005: $7,710,000; 2006: $10,364,000.
Biggest contracts:
$6,594,000 with Army for Services -- Applied Research and Exploratory Development (R&D). Signed on 2006-04-10. Completion date: 2009-06-02.
$3,739,914 with Army for Services -- Engineering Development (R&D). Taking place in OH. Signed on 2002-10-15. Completion date: 2003-07-25.
$3,351,692 with Army for Engineering and Technical Services. Signed on 2004-03-04. Completion date: 2004-09-30.
$3,351,692, same as above.Signed on 2004-04-22. Completion date: 2005-03-31.
ADVANCED PROJECTS RESEARCH, IN (1925 MCKINLEY AVE STE B; small business) : $16,632,469 in 39 contractsfrom 1999 to 2006
Contracts for Defense Aircraft -- Advanced Development (R&D), Defense Aircraft -- Applied Research and Exploratory Development (R&D), Other Defense -- Management and Support (R&D), Defense Missile and Space Systems -- Basic Research (R&D), and moreby Air Force, Department of Defense, NASA, Army, and others Signed by year:2000: $481,340; 2001: $3,751,126; 2002: $3,174,210; 2003: $2,953,498; 2004: $3,586,210; 2005: $2,441,085; 2006: $100,000.
Biggest contracts:
$3,000,000 with Air Force for Defense Aircraft -- Advanced Development (R&D). Signed on 2001-09-06. Completion date: 2007-08-22.
$2,505,219 with Air Force for Defense Aircraft -- Applied Research and Exploratory Development (R&D). Signed on 2002-07-10. Completion date: 2004-11-17.
$2,383,498, same as above.Signed on 2003-03-31. Completion date: 2006-07-05.
$1,375,000, same as above.Signed on 2004-04-30. Completion date: 2007-08-22.
DANIEL BAUGHN (2079 WRIGHT ST STE B4; small business) : $824,609 in 10 contractsfrom 2002 to 2005
Contracts for Miscellaneous Special Industry Machinery, Miscellaneous Prefabricated Structures, Bars and Rods, Materials Feeders, and moreby Navy, Air Force, NASA Signed by year:2000: $0; 2001: $0; 2002: $391,523; 2003: $158,477; 2004: $113,909; 2005: $160,700; 2006: $0.
Biggest contracts:
$391,523 with Navy for Miscellaneous Special Industry Machinery. Signed on 2002-01-02. Completion date: 2002-07-16.
$155,800 with Air Force for Miscellaneous Prefabricated Structures. Signed on 2005-08-10. Completion date: 2006-02-16.
$69,867 with Navy for Bars and Rods. Taking place in WA. Signed on 2003-12-30. Completion date: 2004-04-07.
$54,056 with Navy for Materials Feeders. Signed on 2004-09-30. Completion date: 2004-11-30.
LOS ANGELES AIR CONDITIONING, (1714 LINDBERGH CT) : $324,727 in 6 contractsfrom 1999 to 2001
Contracts for Maintenance, Repair or Alteration of Real Property -- Miscellaneous Buildings, Maintenance, Repair or Alteration of Real Property -- Schools by Navy Signed by year:2000: $313,464; 2001: $1,544; 2002: $0; 2003: $0; 2004: $0; 2005: $0; 2006: $0.
Biggest contracts:
$277,820 with Navy for Maintenance, Repair or Alteration of Real Property -- Miscellaneous Buildings. Signed on 2000-05-18. Completion date: 2000-10-30.
$19,065, same as above.Signed on 2000-12-20. Completion date: 2000-10-30.
$11,579, same as above.Signed on 2000-12-05. Completion date: 2000-10-30.
$9,719 with Navy for Maintenance, Repair or Alteration of Real Property -- Schools. Signed on 1999-12-15. Completion date: 1999-12-08.
SUNRISE ELECTRONICS INC (2079 WRIGHT AVE STE B3; small business) : $228,942 in 4 contractsfrom 2000 to 2005
$117,135 with Navy for Miscellaneous Aircraft Accessories and Components. Signed on 2005-03-31. Completion date: 2005-07-21.
$79,117 with Air Force for Electrical Control Equipment. Signed on 2001-02-09. Completion date: 2001-09-28.
$31,190 with Army for Miscellaneous Electrical and Electronic Components. Signed on 2000-04-03. Completion date: 2000-07-03.
$1,500 with Army for Maintenance, Repair and Rebuilding of Equipment -- Electrical and Electronic Equipment Components. Signed on 2002-10-29. Completion date: 2003-01-31.
TANGO DOWN LLC (1588 ARROW HWY UNIT F; small business) : $115,852 in 3 contractsfrom 2004 to 2006
$61,992 with Navy for Guns, through 30 mm. Signed on 2004-09-25. Completion date: 2004-09-30.
$48,759, same as above.Signed on 2006-05-15. Completion date: 2006-06-28.
$5,101, same as above.Signed on 2005-08-12. Completion date: 2005-08-30.
UNIVERSITY OF LA VERNE (1950 3RD ST) : $99,732 in 5 contractsfrom 2003 to 2005
Contracts for Educational Services by Army Signed by year:2000: $0; 2001: $0; 2002: $0; 2003: $34,288; 2004: $34,000; 2005: $31,444; 2006: $0.
Biggest contracts:
$31,444 with Army for Educational Services. Signed on 2005-08-17. Completion date: 2005-08-17.
$25,788, same as above.Signed on 2003-07-30. Completion date: 2003-07-30.
$17,000, same as above.Signed on 2004-04-01. Completion date: 2004-04-01.
$17,000, same as above.Signed on 2004-07-12. Completion date: 2004-07-12.
PLASTIFAB INC (1425 PALOMARES AVE; small business) : $27,201 in 7 contractsfrom 2004 to 2006
Contracts for Pipe, Tube and Rigid Tubing, Electrical Hardware and Supplies, Electrical and Electronic assemblies, Boards, Cards, and Associated Hardware, Refrigeration and Air Conditioning Components by Defense Logistics Agency Signed by year:2000: $0; 2001: $0; 2002: $0; 2003: $0; 2004: $12,501; 2005: $6,392; 2006: $8,308.
Biggest contracts:
$9,951 with Defense Logistics Agency for Pipe, Tube and Rigid Tubing. Signed on 2004-10-08. Completion date: 2005-01-14.
$4,180, same as above.Signed on 2006-02-06. Completion date: 2006-04-24.
$4,128, same as above.Signed on 2006-04-28. Completion date: 2006-08-28.
$3,842 with Defense Logistics Agency for Electrical Hardware and Supplies. Signed on 2005-05-04. Completion date: 2005-07-09.
ARREDONDO ENTERPRISES INC (2984 1ST ST STE F; small business)
$11,784 with Navy for Ammunition, through 30 mm. Signed on 2006-04-24. Completion date: 2006-05-08.
Top industries in this zip code by the number of employees in 2005:
Educational Services: Colleges, Universities, and Professional Schools (over 1000 employees: 1 establishment)
Administrative and Support and Waste Management and Remediation Services: Employment Placement Agencies (500-999: 1, 1-4: 2)
2002 - 2018 National Fire Incident Reporting System (NFIRS) incidents
According to the data from the years 2002 - 2018 the average number of fires per year is 48. The highest number of fires - 74 took place in 2006, and the least - 0 in 2003. The data has an increasing trend.
When looking into fire subcategories, the most incidents belonged to: Outside Fires (38.9%), and Structure Fires (30.9%).
Fire incident types reported to NFIRS in Zip Code 91750


+$4,500
-$7,562
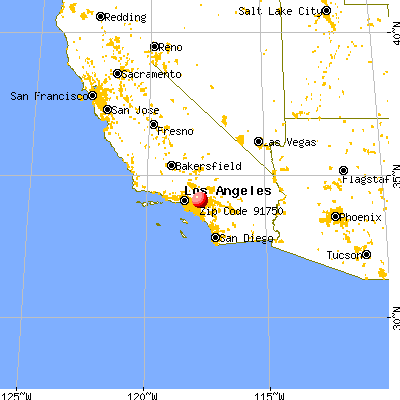
 Nearest zip codes: 91741, 91773, 91711, 91740, 91767, 91759.


 According to the data from the years 2002 - 2018 the average number of fires per year is 48. The highest number of fires - 74 took place in 2006, and the least - 0 in 2003. The data has an increasing trend.
 When looking into fire subcategories, the most incidents belonged to: Outside Fires (38.9%), and Structure Fires (30.9%).