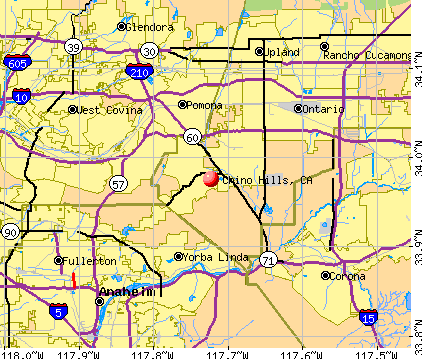
Chino Hills, California
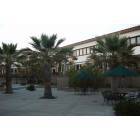
Chino Hills: parklake CHINO HILLS, Ca
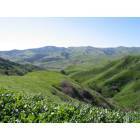
Chino Hills: Chino Hills State Park
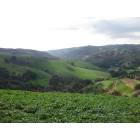
Chino Hills: Some of the rolling hills in my city
Chino Hills: Woodview Drive, Chino Hills.
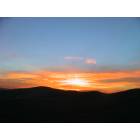
Chino Hills: Sunset in Chino Hills
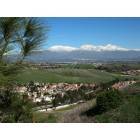
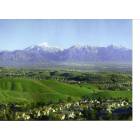
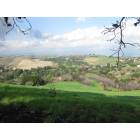
Chino Hills: Valley View From Summit Ranch
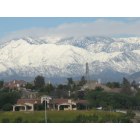
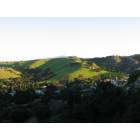
Chino Hills: Taken from Rancho Hills Dr. area
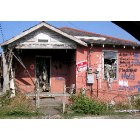
Chino Hills: House in Chino Hills on Chino Hills Pkwy near Payton Drive
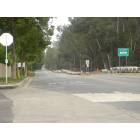
Chino Hills: Carbon Canyon
Chino Hills: Quiet spring evening.
Chino Hills: Carbon Canyon
- see
30
more - add
your
Submit your own pictures of this city and show them to the world
- OSM Map
- General Map
- Google Map
- MSN Map
Population change since 2000: +16.7%
 |
| Males: 37,144 | |
| Females: 40,805 |
| Median resident age: | 40.1 years |
| California median age: | 37.9 years |
Zip codes: 91709.
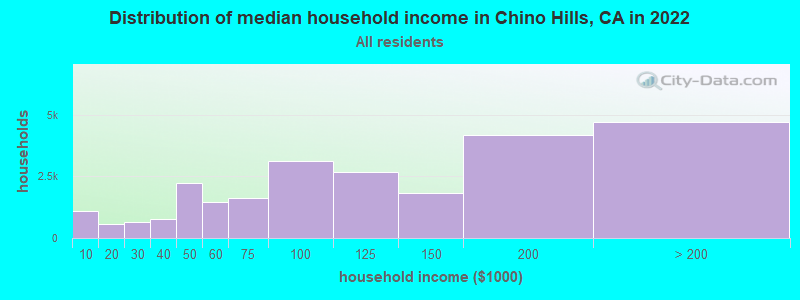
| Chino Hills: | $105,978 |
| CA: | $91,551 |
Estimated per capita income in 2022: $44,129 (it was $26,182 in 2000)
Chino Hills city income, earnings, and wages data
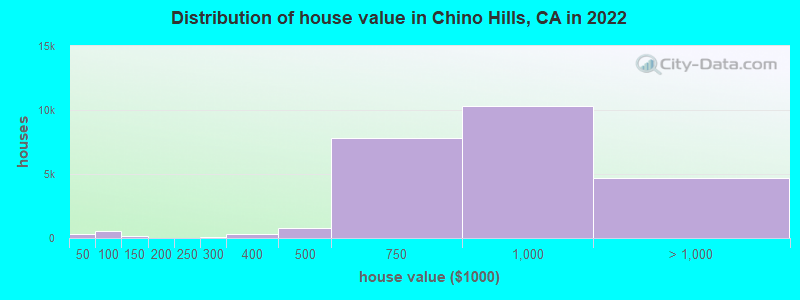
Estimated median house or condo value in 2022: $821,300 (it was $236,300 in 2000)
| Chino Hills: | $821,300 |
| CA: | $715,900 |
Median gross rent in 2022: $2,474.
(5.6% for White Non-Hispanic residents, 8.2% for Black residents, 7.3% for Hispanic or Latino residents, 13.1% for American Indian residents, 10.9% for other race residents, 5.5% for two or more races residents)
Detailed information about poverty and poor residents in Chino Hills, CA


Compare current foreclosures in Chino Hills, CA:
| Photo | Address | Area | Beds / Baths | Price | Details |
|---|---|---|---|---|---|

|
#1
Sunny Brook Ln
Chino Hills, CA 91709
|
1,833 sq. feet
|
2 baths 4 beds |
show details | |

|
#2
Hunter Rd
Chino Hills, CA 91709
|
2,360 sq. feet
|
2 baths 3 beds |
show details | |

|
#3
South Trail Drive
Chino Hills, CA 91709
|
1,419 sq. feet
|
2 baths 3 beds |
show details | |

|
#4
Pheasant St
Chino Hills, CA 91709
|
825 sq. feet
|
1 baths 3 beds |
show details | |

|
#5
Torrey Pines Dr
Chino Hills, CA 91709
|
2,854 sq. feet
|
3 baths 4 beds |
show details | |

|
#6
Lariat Dr
Chino Hills, CA 91709
|
1,171 sq. feet
|
2 baths 2 beds |
show details | |

|
#7
Diamond Valley Ln
Chino Hills, CA 91709
|
3,066 sq. feet
|
3 baths 4 beds |
show details | |

|
#8
Fresno Ave
Chino Hills, CA 91709
|
1,485 sq. feet
|
1 baths 2 beds |
show details | |

|
#9
Steeple Chase Dr
Chino Hills, CA 91709
|
1,808 sq. feet
|
2 baths 3 beds |
show details | |

|
#10
Quail St
Chino Hills, CA 91709
|
825 sq. feet
|
1 baths 2 beds |
show details |
| Photo | Address | Area | Beds / Baths | Price | Details |
|---|---|---|---|---|---|

|
#11
Ficus St
Chino Hills, CA 91709
|
1,758 sq. feet
|
2 baths 3 beds |
show details | |

|
#12
Sunscape Ct
Chino Hills, CA 91709
|
1,923 sq. feet
|
2 baths 3 beds |
show details | |

|
#13
Valle Vista Dr
Chino Hills, CA 91709
|
1,287 sq. feet
|
2 baths 3 beds |
show details | |

|
#14
Glen Ct Unit 13
Chino Hills, CA 91709
|
1,243 sq. feet
|
2 baths 2 beds |
show details | |

|
#15
Shady Hollow Ln
Chino Hills, CA 91709
|
2,588 sq. feet
|
3 baths 4 beds |
show details | |

|
#16
El Molino Blvd
Chino Hills, CA 91709
|
1,247 sq. feet
|
1 baths 3 beds |
show details | |

|
#17
Sonrisa Dr
Chino Hills, CA 91709
|
1,002 sq. feet
|
1 baths 2 beds |
show details | |

|
#18
Monte Vista Ave Spc 234
Chino Hills, CA 91709
|
1,456 sq. feet
|
2 baths 3 beds |
show details | |

|
#19
Eastview Dr
Chino Hills, CA 91709
|
2,488 sq. feet
|
3 baths 5 beds |
show details | |

|
#20
Bainbridge Way
Chino Hills, CA 91709
|
2,198 sq. feet
|
3 baths 3 beds |
show details |
| Photo | Address | Area | Beds / Baths | Price | Details |
|---|---|---|---|---|---|

|
#21
Copper Rd
Chino Hills, CA 91709
|
1,718 sq. feet
|
2 baths 3 beds |
show details | |

|
#22
Sorrel Hills Ave
Chino Hills, CA 91709
|
2,485 sq. feet
|
3 baths 3 beds |
show details | |

|
#23
Sagebrush St
Chino Hills, CA 91709
|
3,180 sq. feet
|
3 baths 5 beds |
show details | |

|
#24
Canterbury Dr Unit 202
Chino Hills, CA 91709
|
1,146 sq. feet
|
2 baths 2 beds |
show details | |

|
#25
Woodsorrel Dr
Chino Hills, CA 91709
|
1,333 sq. feet
|
2 baths 3 beds |
show details | |

|
#26
Homeridge Ln
Chino Hills, CA 91709
|
- sq. feet
|
- baths - beds |
show details | |

|
#27
Hunter Rd
Chino Hills, CA 91709
|
- sq. feet
|
- baths - beds |
show details | |

|
#28
Scenic Ridge Dr
Chino Hills, CA 91709
|
- sq. feet
|
- baths - beds |
show details | |

|
#29
High Knoll Dr Unit 268
Chino Hills, CA 91709
|
- sq. feet
|
- baths - beds |
show details | |

|
#30
Torrey Pines Dr
Chino Hills, CA 91709
|
- sq. feet
|
- baths - beds |
show details |
| Photo | Address | Area | Beds / Baths | Price | Details |
|---|---|---|---|---|---|

|
#31
Peyton Dr Ste C
Chino Hills, CA 91709
|
- sq. feet
|
- baths - beds |
show details | |

|
#32
Rancho Hills Dr
Chino Hills, CA 91709
|
- sq. feet
|
- baths - beds |
show details | |

|
#33
Rancho Hills Dr
Chino Hills, CA 91709
|
- sq. feet
|
- baths - beds |
show details | |

|
#34
Fairfield Ranch Rd, Unit 8101
Chino Hills, CA 91709
|
- sq. feet
|
- baths - beds |
show details | |

|
#35
Lynoak Drive
Chino Hills, CA 91709
|
- sq. feet
|
- baths - beds |
show details | |

|
#36
Moon Crest Ln Unit A
Chino Hills, CA 91709
|
- sq. feet
|
- baths - beds |
show details | |

|
#37
Cardinal Ridge Rd Unit E
Chino Hills, CA 91709
|
- sq. feet
|
- baths - beds |
show details | |

|
#38
Chino Hills Pkwy Unit 935
Chino Hills, CA 91709
|
- sq. feet
|
- baths - beds |
show details | |

|
#39
Frost Ave Apt 68
Chino Hills, CA 91709
|
- sq. feet
|
- baths - beds |
show details | |

|
#40
Mesa Blvd Unit D
Chino Hills, CA 91709
|
- sq. feet
|
- baths - beds |
show details |
| Photo | Address | Area | Beds / Baths | Price | Details |
|---|---|---|---|---|---|

|
#41
Village Dr Apt D
Chino Hills, CA 91709
|
- sq. feet
|
- baths - beds |
show details | |

|
#42
Canyon Oaks Xing
Chino Hills, CA 91709
|
- sq. feet
|
- baths - beds |
show details | |

|
Check over 1 million property listings on Foreclosure.com!
|
browse all offers | |||


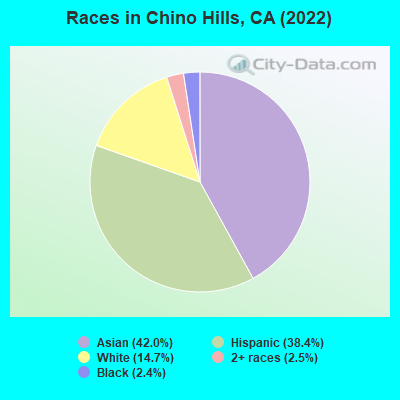
- 32,71642.0%Asian alone
- 29,88638.4%Hispanic
- 11,46214.7%White alone
- 1,9102.5%Two or more races
- 1,8782.4%Black alone
- 710.09%Other race alone
According to our research of California and other state lists, there were 30 registered sex offenders living in Chino Hills, California as of April 27, 2024.
The ratio of all residents to sex offenders in Chino Hills is 2,627 to 1.
The ratio of registered sex offenders to all residents in this city is much lower than the state average.
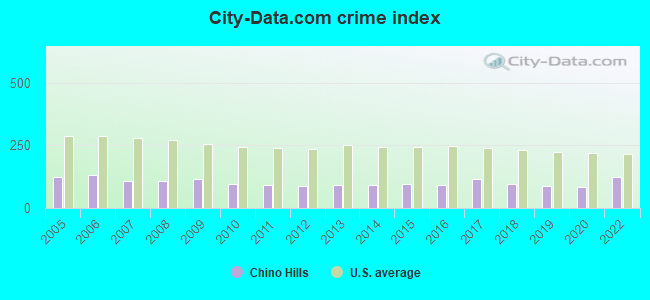
The City-Data.com crime index weighs serious crimes and violent crimes more heavily. Higher means more crime, U.S. average is 246.1. It adjusts for the number of visitors and daily workers commuting into cities.
- means the value is smaller than the state average.- means the value is about the same as the state average.
- means the value is bigger than the state average.
Crime rate in Chino Hills detailed stats: murders, rapes, robberies, assaults, burglaries, thefts, arson
Full-time law enforcement employees in 2015, including police officers: 1 (1 officers - 1 male; 0 female).
| Officers per 1,000 residents here: | 0.01 |
| California average: | 1.98 |
 Recent articles from our blog. Our writers, many of them Ph.D. graduates or candidates, create easy-to-read articles on a wide variety of topics.

 | Quality and Cost of Living in Chino Hills vs. OC (8 replies) |
| Chino Hills & RC have gotten way too expensive for what it's worth (14 replies) |
| Covina area vs Chino hills area (0 replies) |
| Best apartment complexes in Chino and or Chino Hills (0 replies) |
| African American Family Moving To Chino Hills and need info (9 replies) |
| Chino Hills (2 replies) |
Latest news from Chino Hills, CA collected exclusively by city-data.com from local newspapers, TV, and radio stations
Ancestries: German (2.6%), Irish (1.8%), English (1.8%), American (1.8%), European (1.4%).
Current Local Time: PST time zone
Elevation: 1200 feet
Land area: 44.8 square miles.
Population density: 1,740 people per square mile (low).
25,317 residents are foreign born (25.5% Asia, 4.9% Latin America).
| This city: | 32.2% |
| California: | 26.5% |
Median real estate property taxes paid for housing units with mortgages in 2022: $6,022 (0.7%)
Median real estate property taxes paid for housing units with no mortgage in 2022: $4,615 (0.6%)
Nearest city with pop. 200,000+: East San Gabriel Valley, CA  (10.4 miles , pop. 933,557).
Nearest city with pop. 1,000,000+: Los Angeles, CA (38.2 miles , pop. 3,694,820).
Nearest cities:
), )Latitude: 33.98 N, Longitude: 117.72 W
Daytime population change due to commuting: -15,129 (-19.4%)
Workers who live and work in this city: 9,701 (25.4%)
Area code commonly used in this area: 909
Property values in Chino Hills, CA
Chino Hills, California accommodation & food services, waste management - Economy and Business Data
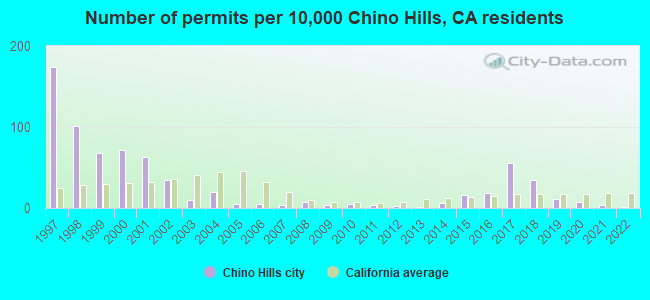
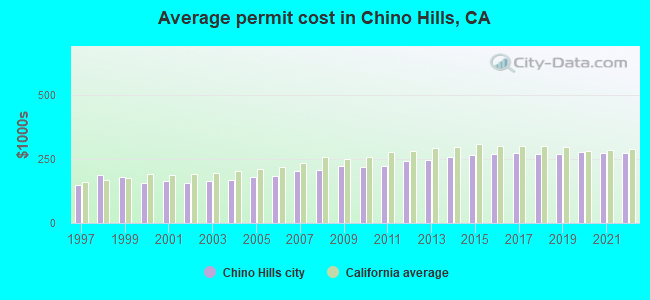
Single-family new house construction building permits:
- 2022: 7 buildings, average cost: $275,900
- 2021: 30 buildings, average cost: $274,300
- 2020: 44 buildings, average cost: $277,700
- 2019: 76 buildings, average cost: $272,100
- 2018: 231 buildings, average cost: $271,400
- 2017: 377 buildings, average cost: $274,000
- 2016: 119 buildings, average cost: $272,200
- 2015: 107 buildings, average cost: $266,700
- 2014: 40 buildings, average cost: $258,000
- 2013: 6 buildings, average cost: $245,900
- 2012: 22 buildings, average cost: $243,800
- 2011: 24 buildings, average cost: $223,800
- 2010: 36 buildings, average cost: $218,800
- 2009: 25 buildings, average cost: $225,400
- 2008: 44 buildings, average cost: $209,200
- 2007: 26 buildings, average cost: $202,500
- 2006: 32 buildings, average cost: $184,700
- 2005: 33 buildings, average cost: $179,600
- 2004: 135 buildings, average cost: $167,800
- 2003: 68 buildings, average cost: $166,000
- 2002: 230 buildings, average cost: $158,000
- 2001: 421 buildings, average cost: $166,000
- 2000: 473 buildings, average cost: $155,500
- 1999: 455 buildings, average cost: $182,200
- 1998: 674 buildings, average cost: $186,900
- 1997: 1160 buildings, average cost: $147,500
| Here: | 3.3% |
| California: | 5.1% |
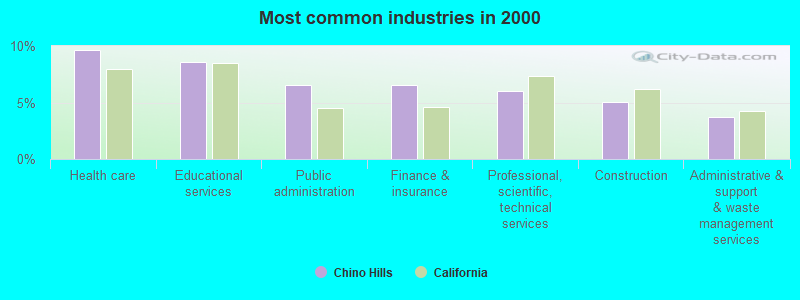
- Health care (9.7%)
- Educational services (8.6%)
- Public administration (6.6%)
- Finance & insurance (6.6%)
- Professional, scientific, technical services (6.0%)
- Construction (5.0%)
- Administrative & support & waste management services (3.7%)
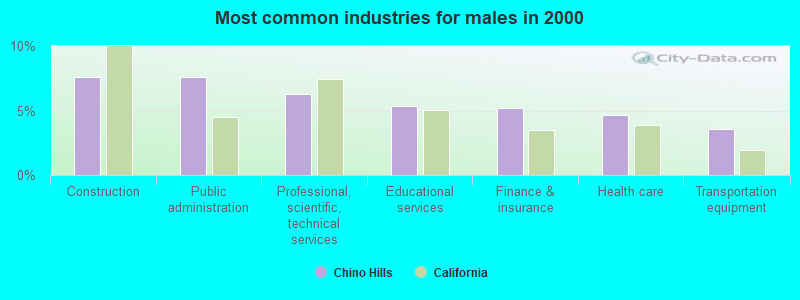
- Construction (7.6%)
- Public administration (7.6%)
- Professional, scientific, technical services (6.3%)
- Educational services (5.4%)
- Finance & insurance (5.2%)
- Health care (4.6%)
- Transportation equipment (3.5%)
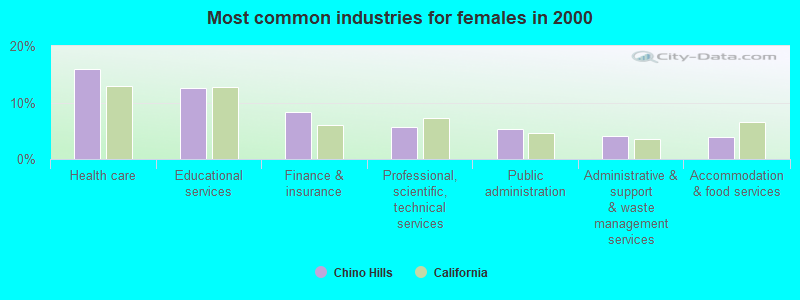
- Health care (16.0%)
- Educational services (12.6%)
- Finance & insurance (8.3%)
- Professional, scientific, technical services (5.6%)
- Public administration (5.3%)
- Administrative & support & waste management services (4.0%)
- Accommodation & food services (3.8%)
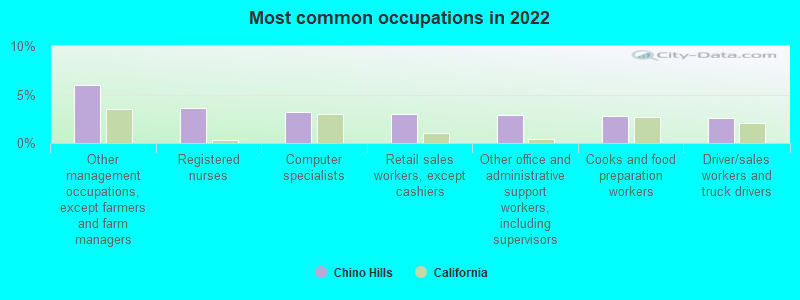
- Other management occupations, except farmers and farm managers (6.0%)
- Registered nurses (3.6%)
- Computer specialists (3.2%)
- Retail sales workers, except cashiers (2.9%)
- Other office and administrative support workers, including supervisors (2.9%)
- Cooks and food preparation workers (2.7%)
- Driver/sales workers and truck drivers (2.6%)
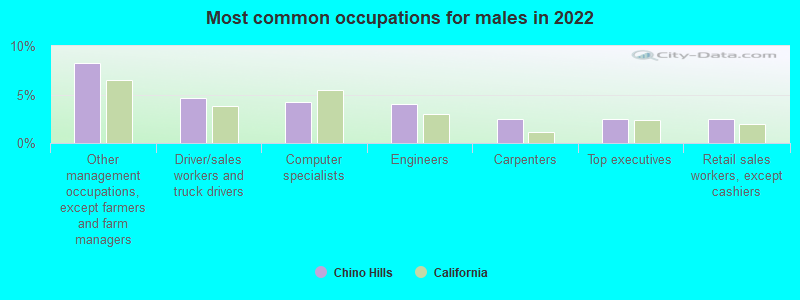
- Other management occupations, except farmers and farm managers (8.2%)
- Driver/sales workers and truck drivers (4.6%)
- Computer specialists (4.2%)
- Engineers (4.0%)
- Carpenters (2.5%)
- Top executives (2.5%)
- Retail sales workers, except cashiers (2.4%)
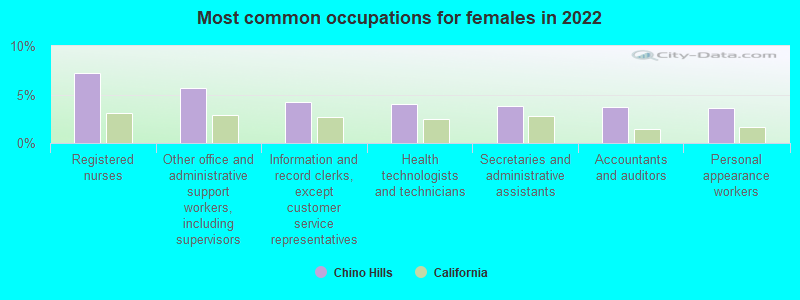
- Registered nurses (7.2%)
- Other office and administrative support workers, including supervisors (5.6%)
- Information and record clerks, except customer service representatives (4.3%)
- Health technologists and technicians (4.0%)
- Secretaries and administrative assistants (3.8%)
- Accountants and auditors (3.7%)
- Personal appearance workers (3.6%)
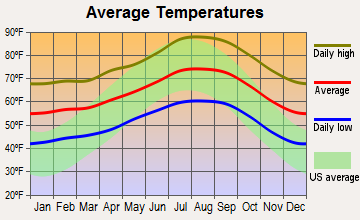
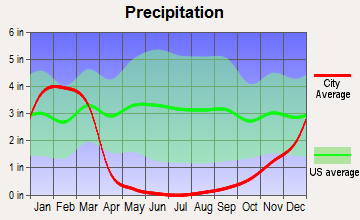
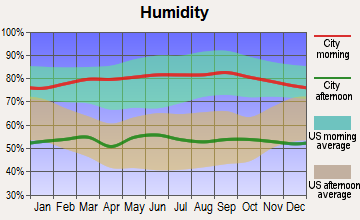
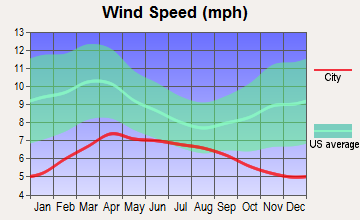
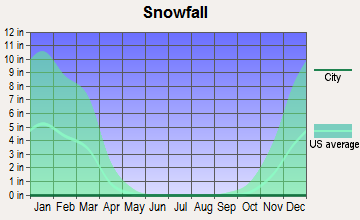
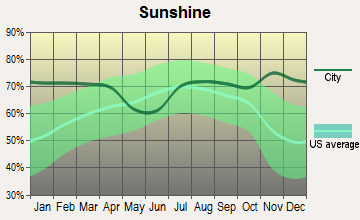
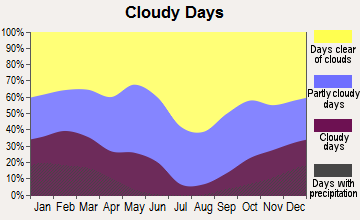
Average climate in Chino Hills, California
Based on data reported by over 4,000 weather stations
(lower is better)
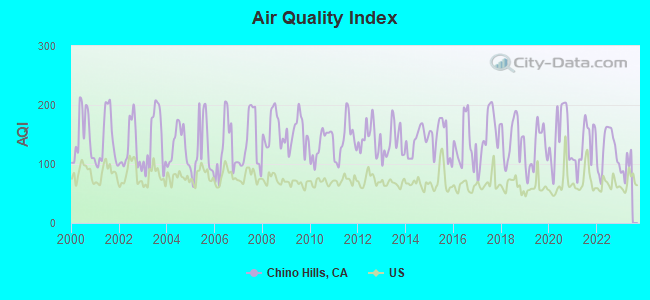
Air Quality Index (AQI) level in 2022 was 124. This is significantly worse than average.
| City: | 124 |
| U.S.: | 73 |
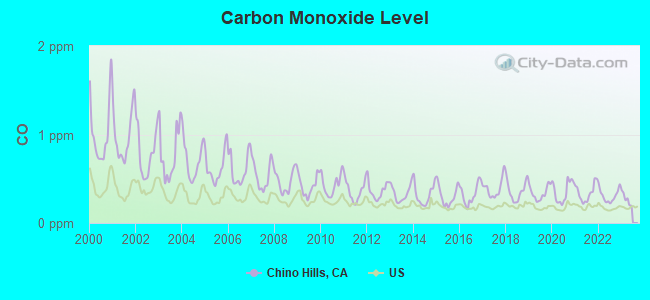
Carbon Monoxide (CO) [ppm] level in 2022 was 0.311. This is worse than average. Closest monitor was 3.3 miles away from the city center.
| City: | 0.311 |
| U.S.: | 0.251 |
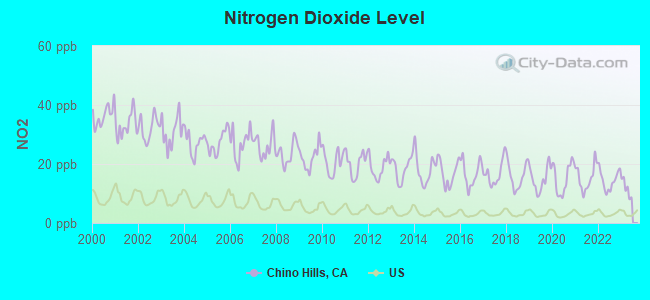
Nitrogen Dioxide (NO2) [ppb] level in 2022 was 14.5. This is significantly worse than average. Closest monitor was 3.3 miles away from the city center.
| City: | 14.5 |
| U.S.: | 5.1 |
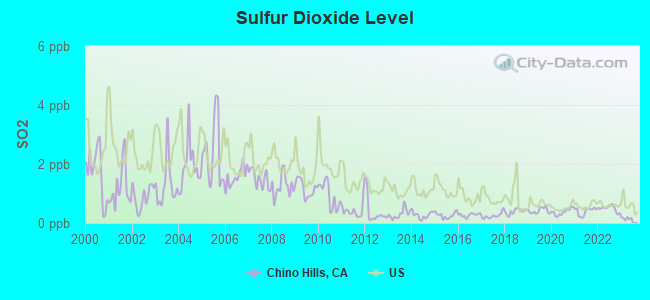
Sulfur Dioxide (SO2) [ppb] level in 2022 was 0.492. This is significantly better than average. Closest monitor was 6.6 miles away from the city center.
| City: | 0.492 |
| U.S.: | 1.515 |
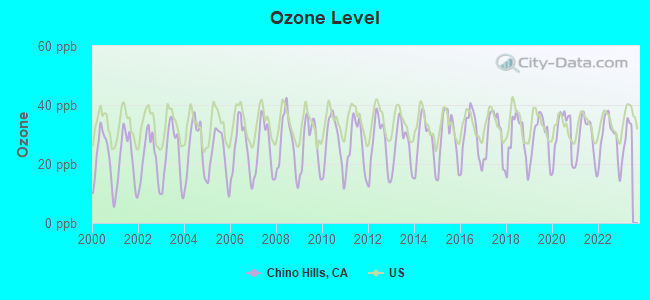
Ozone [ppb] level in 2022 was 28.8. This is about average. Closest monitor was 3.3 miles away from the city center.
| City: | 28.8 |
| U.S.: | 33.3 |
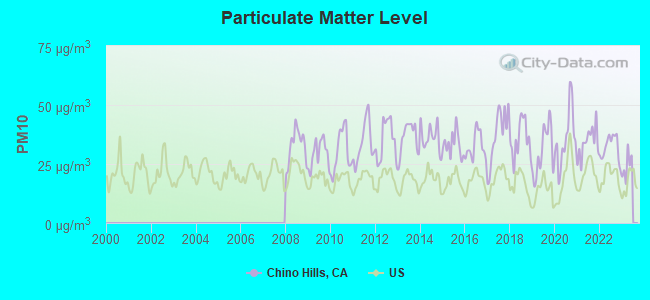
Particulate Matter (PM10) [µg/m3] level in 2022 was 32.0. This is significantly worse than average. Closest monitor was 4.7 miles away from the city center.
| City: | 32.0 |
| U.S.: | 19.2 |
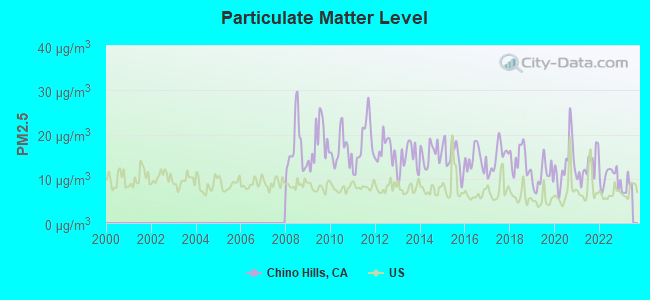
Particulate Matter (PM2.5) [µg/m3] level in 2022 was 10.3. This is worse than average. Closest monitor was 4.7 miles away from the city center.
| City: | 10.3 |
| U.S.: | 8.1 |
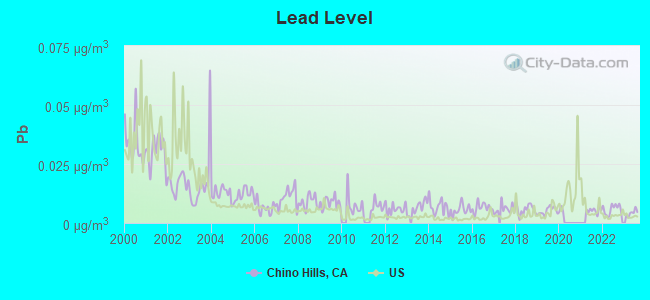
Lead (Pb) [µg/m3] level in 2023 was 0.00426. This is significantly better than average. Closest monitor was 3.3 miles away from the city center.
| City: | 0.00426 |
| U.S.: | 0.00931 |
Earthquake activity:
Chino Hills-area historical earthquake activity is significantly above California state average. It is 7155% greater than the overall U.S. average.On 6/28/1992 at 11:57:34, a magnitude 7.6 (6.2 MB, 7.6 MS, 7.3 MW, Depth: 0.7 mi, Class: Major, Intensity: VIII - XII) earthquake occurred 69.7 miles away from the city center, causing 3 deaths (1 shaking deaths, 2 other deaths) and 400 injuries, causing $100,000,000 total damage and $40,000,000 insured losses
On 7/21/1952 at 11:52:14, a magnitude 7.7 (7.7 UK) earthquake occurred 101.6 miles away from Chino Hills center, causing $50,000,000 total damage
On 10/16/1999 at 09:46:44, a magnitude 7.4 (6.3 MB, 7.4 MS, 7.2 MW, 7.3 ML) earthquake occurred 82.6 miles away from the city center
On 4/21/1918 at 22:32:30, a magnitude 6.8 (6.8 UK, Class: Strong, Intensity: VII - IX) earthquake occurred 19.8 miles away from Chino Hills center
On 11/4/1927 at 13:51:53, a magnitude 7.5 (7.5 UK) earthquake occurred 199.6 miles away from the city center
On 5/19/1940 at 04:36:40, a magnitude 7.2 (7.2 UK) earthquake occurred 127.8 miles away from Chino Hills center, causing $33,000,000 total damage
Magnitude types: body-wave magnitude (MB), local magnitude (ML), surface-wave magnitude (MS), moment magnitude (MW)
Natural disasters:
The number of natural disasters in San Bernardino County (46) is a lot greater than the US average (15).Major Disasters (Presidential) Declared: 27
Emergencies Declared: 2
Causes of natural disasters: Fires: 24, Floods: 18, Storms: 9, Winter Storms: 6, Landslides: 5, Mudslides: 4, Heavy Rains: 2, Earthquake: 1, Flash Flood: 1, Freeze: 1, Hurricane: 1, Snow: 1, Tornado: 1, Tropical Storm: 1, Wind: 1, Other: 1 (Note: some incidents may be assigned to more than one category).
Hospitals and medical centers near Chino Hills:
- BRIO HOME HEALTH SERVICES, INC (Home Health Center, about 1 miles away; CHINO, CA)
- CARDINAL HOME HEALTH CARE (Home Health Center, about 2 miles away; CHINO, CA)
- DELTA HOSPICE CARE OF CA (Hospital, about 2 miles away; CHINO, CA)
- BENEFRANCE HOME HEALTH SERVICES INC (Home Health Center, about 2 miles away; CHINO, CA)
- A'S HOME HEALTH CARE, INC (Home Health Center, about 3 miles away; CHINO, CA)
- ROBERT AND MARIAN KUSTER HOUSE (Hospital, about 3 miles away; DESERT HOT SPRINGS, CA)
- CANYON RIDGE HOSPITAL (Hospital, about 4 miles away; CHINO, CA)
Amtrak stations near Chino Hills:
- 7 miles: POMONA (156 W. COMMERCIAL ST.) . Services: partially wheelchair accessible, public payphones, free short-term parking, free long-term parking, call for taxi service, public transit connection.
- 8 miles: ONTARIO (228 S. PLUM ST.) . Services: fully wheelchair accessible, public payphones, vending machines, free short-term parking, call for taxi service.
- 9 miles: CLAREMONT (200 W. 1ST ST.) - Bus Station . Services: fully wheelchair accessible, public payphones, full-service food facilities, free short-term parking, free long-term parking, call for car rental service, call for taxi service, public transit connection.
Colleges/universities with over 2000 students nearest to Chino Hills:
- DeVry University-California (about 8 miles; Pomona, CA; Full-time enrollment: 10,875)
- California State Polytechnic University-Pomona (about 8 miles; Pomona, CA; FT enrollment: 18,141)
- Mt San Antonio College (about 9 miles; Walnut, CA; FT enrollment: 19,891)
- University of La Verne (about 10 miles; La Verne, CA; FT enrollment: 6,983)
- Norco College (about 10 miles; Norco, CA; FT enrollment: 4,916)
- Universal Technical Institute of California Inc (about 12 miles; Rancho Cucamonga, CA; FT enrollment: 4,158)
- California State University-Fullerton (about 12 miles; Fullerton, CA; FT enrollment: 28,947)
Public high schools in Chino Hills:
- CHINO HILLS HIGH (Students: 2,064, Location: 16150 POMONA RINCON RD., Grades: 9-12)
- BOYS REPUBLIC HIGH (Location: 3493 GRAND AVE., Grades: 9-12)
- RUBEN S. AYALA HIGH (Location: 14255 PEYTON AVE., Grades: 9-12)
- CHINO VALLEY LEARNING ACADEMY (Location: 15650 PIPELINE AVE., Grades: 7-12)
Biggest public elementary/middle schools in Chino Hills:
- CANYON HILLS JUNIOR HIGH (Students: 1,173, Location: 2500 MADRUGADA DR., Grades: 7-8)
- CHAPARRAL ELEMENTARY (Students: 459, Location: 4849 BIRD FARM RD., Grades: KG-6)
- COUNTRY SPRINGS ELEMENTARY (Location: 14145 VILLAGE CENTER DR., Grades: KG-6)
- HIDDEN TRAILS ELEMENTARY (Location: 2250 RIDGEVIEW DR., Grades: KG-6)
- ROBERT O. TOWNSEND JUNIOR HIGH (Location: 15359 ILEX DR., Grades: 7-8)
- GERALD F. LITEL ELEMENTARY (Location: 3425 EUCALYPTUS AVE., Grades: KG-6)
- EAGLE CANYON ELEMENTARY (Location: 13435 EAGLE CANYON DR., Grades: KG-6)
- OAK RIDGE ELEMENTARY (Location: 15452 VALLE VISTA DR., Grades: KG-6)
- ROLLING RIDGE ELEMENTARY (Location: 13677 CALLE SAN MARCOS, Grades: KG-6)
- BUTTERFIELD RANCH ELEMENTARY (Location: 6350 MYSTIC CANYON DR., Grades: KG-6)
Private elementary/middle schools in Chino Hills:
Points of interest:
Notable locations in Chino Hills: McDermont Ranch (A), Rolling M Ranch (B), Payne Ranch Center (C), Western Hills Country Club (D), Chino Downs (E), Los Serranos Country Club (F), Chino Valley Independent Fire Protection District Training Facility (G), Chino Valley Independent Fire Protection District Station 64 (H), Chino Valley Independent Fire Protection District Station 66 (I), Chino Valley Independent Fire Protection District Station 62 (J). Display/hide their locations on the map
Shopping Centers: Chino Hills Marketplace Shopping Center (1), Canyon Hills Shopping Center (2). Display/hide their locations on the map
Reservoirs: Arnold Reservoir (A), Lake los Serranos (B). Display/hide their locations on the map
Park in Chino Hills: Chino Hills State Park (1). Display/hide its location on the map
Birthplace of: Charles Brown (offensive lineman) - Football player, Kevin Guppy - Soccer player, Mike Randolph - Soccer player, Alex Bengard - Soccer player, Kwame Watson-Siriboe - Soccer player, Chris Minardo - College basketball player (Cal State Fullerton Titans), Stephen Gilling - College basketball player (Colorado State Rams).
Drinking water stations with addresses in Chino Hills that have no violations reported:
- CHINO HILLS, CITY OF (Population served: 75,655, Primary Water Source Type: Purch surface water)
| This city: | 3.2 people |
| California: | 2.9 people |
| This city: | 84.2% |
| Whole state: | 68.7% |
| This city: | 4.3% |
| Whole state: | 7.2% |
Likely homosexual households (counted as self-reported same-sex unmarried-partner households)
- Lesbian couples: 0.4% of all households
- Gay men: 0.2% of all households
People in group quarters in Chino Hills in 2010:
- 145 people in residential treatment centers for juveniles (non-correctional)
- 8 people in group homes intended for adults
- 2 people in correctional residential facilities
Banks with most branches in Chino Hills (2011 data):
- Wells Fargo Bank, National Association: Chino Hills Parkway Branch, Soquel Canyon Branch, Chino Hills Branch. Info updated 2011/04/05: Bank assets: $1,161,490.0 mil, Deposits: $905,653.0 mil, headquarters in Sioux Falls, SD, positive income, 6395 total offices, Holding Company: Wells Fargo & Company
- JPMorgan Chase Bank, National Association: Chino Hills Banking Center, Chino Hills - Crossroads, Chino Hills Branch. Info updated 2011/11/10: Bank assets: $1,811,678.0 mil, Deposits: $1,190,738.0 mil, headquarters in Columbus, OH, positive income, International Specialization, 5577 total offices, Holding Company: Jpmorgan Chase & Co.
- Bank of America, National Association: Chino Hills Branch at 4100 Chino Hills Parkway, branch established on 1977/11/30; Gateway Village Branch at 3650 Grand Avenue, branch established on 2003/12/08. Info updated 2009/11/18: Bank assets: $1,451,969.3 mil, Deposits: $1,077,176.8 mil, headquarters in Charlotte, NC, positive income, 5782 total offices, Holding Company: Bank Of America Corporation
- U.S. Bank National Association: Chino Hills Albertson Branch at 15970 Los Serranos Country Club Dr, branch established on 2010/04/12; Chino Hills Marketplace Branch at 4200 Chino Hills Pkwy, Suite 915, branch established on 2006/09/20. Info updated 2012/01/30: Bank assets: $330,470.8 mil, Deposits: $236,091.5 mil, headquarters in Cincinnati, OH, positive income, 3121 total offices, Holding Company: U.S. Bancorp
- OneWest Bank, FSB: Chino Hills Branch at 3410 Grand Ave., Suite A, branch established on 2005/10/24. Info updated 2011/07/21: Bank assets: $26,181.3 mil, Deposits: $15,408.4 mil, headquarters in Pasadena, CA, positive income, 79 total offices
- East West Bank: 99 Chino Hills Branch at 2959 Chino Ave., branch established on 2007/07/06. Info updated 2010/06/14: Bank assets: $21,962.4 mil, Deposits: $17,501.8 mil, headquarters in Pasadena, CA, positive income, Commercial Lending Specialization, 131 total offices, Holding Company: East West Bancorp, Inc.
- Union Bank, National Association: Chino Hills Crossroads at 13225 Peyton Drive, branch established on 2005/01/31. Info updated 2011/09/01: Bank assets: $88,967.5 mil, Deposits: $65,286.4 mil, headquarters in San Francisco, CA, positive income, Commercial Lending Specialization, 403 total offices, Holding Company: Mitsubishi Ufj Financial Group, Inc.
- Citibank, National Association: Pipeline Ave Branch at 14808 Pipeline Ave, branch established on 1927/01/01. Info updated 2012/01/10: Bank assets: $1,288,658.0 mil, Deposits: $882,541.0 mil, headquarters in Sioux Falls, SD, positive income, International Specialization, 1048 total offices, Holding Company: Citigroup Inc.
- American Continental Bank: Chino Hills Branch at 2983 Chino Avenue, Suite A6, branch established on 2008/03/06. Info updated 2007/03/12: Bank assets: $129.1 mil, Deposits: $108.5 mil, headquarters in City Of Industry, CA, positive income, Commercial Lending Specialization, 3 total offices
For population 15 years and over in Chino Hills:
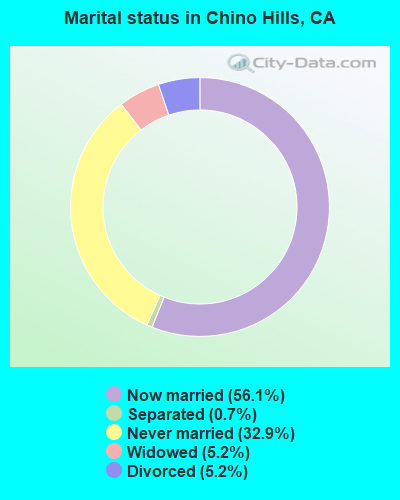
- Never married: 32.9%
- Now married: 56.1%
- Separated: 0.7%
- Widowed: 5.2%
- Divorced: 5.2%
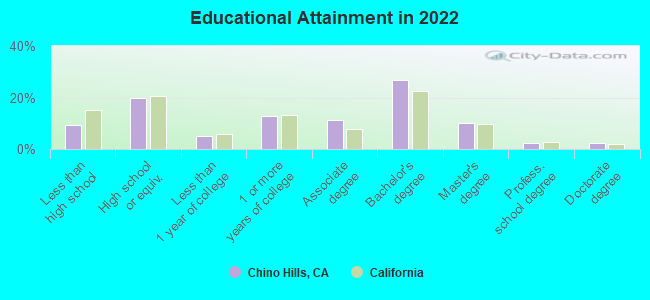
For population 25 years and over in Chino Hills:
- High school or higher: 90.5%
- Bachelor's degree or higher: 41.5%
- Graduate or professional degree: 14.7%
- Unemployed: 4.2%
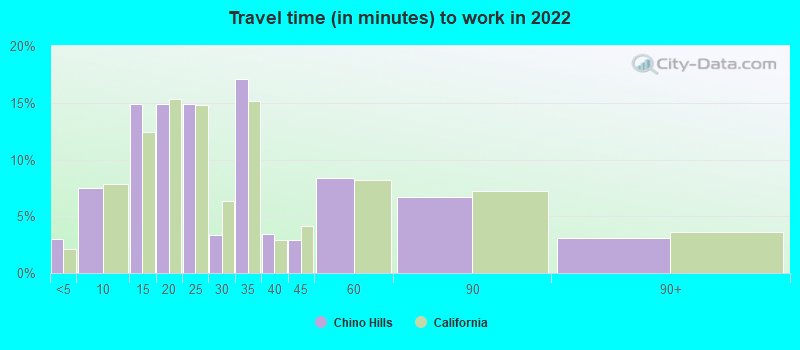
- Mean travel time to work (commute): 29.4 minutes
| Here: | 12.6 |
| California average: | 15.5 |
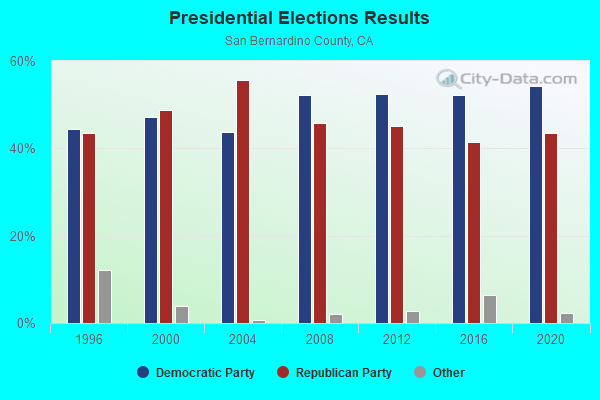
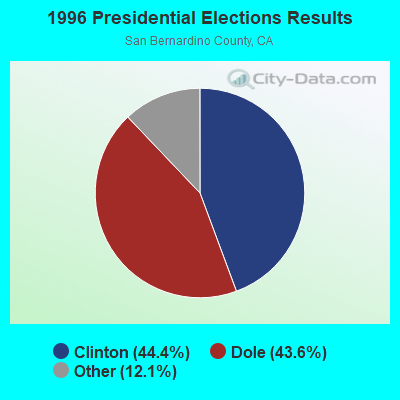
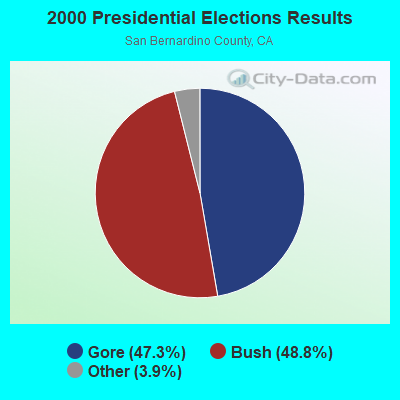
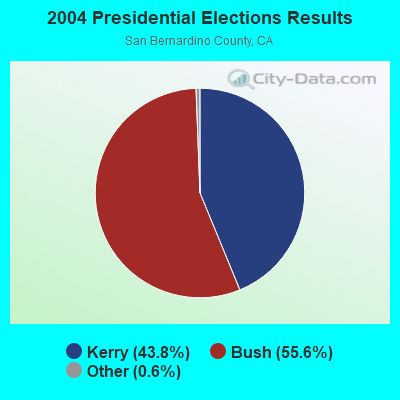
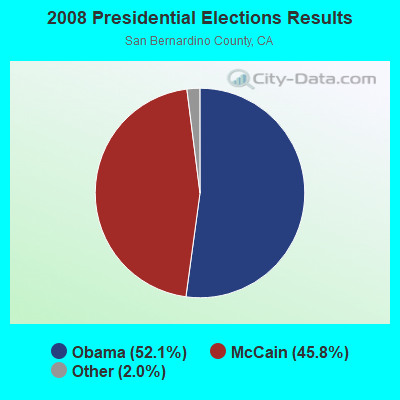
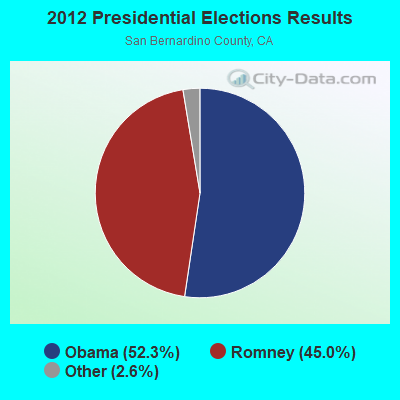
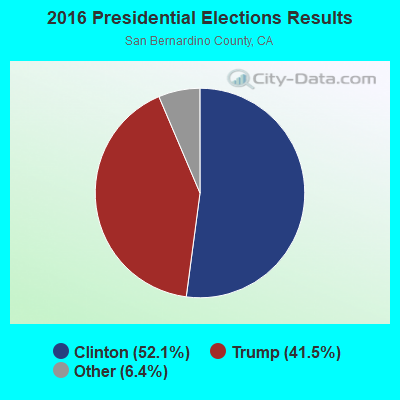
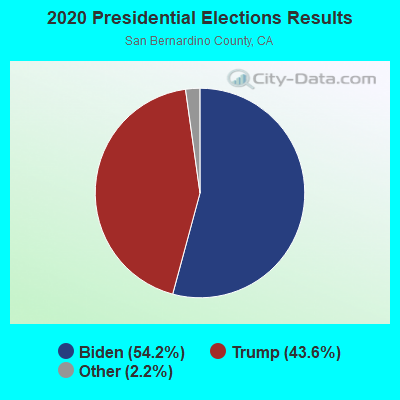
Graphs represent county-level data. Detailed 2008 Election Results
Religion statistics for Chino Hills, CA (based on San Bernardino County data)
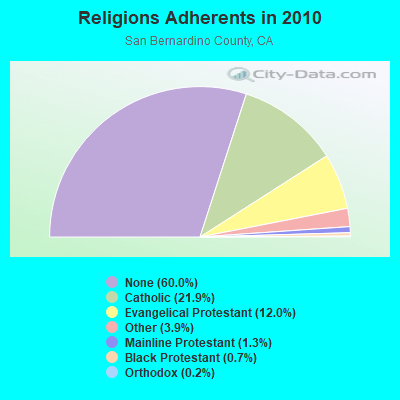
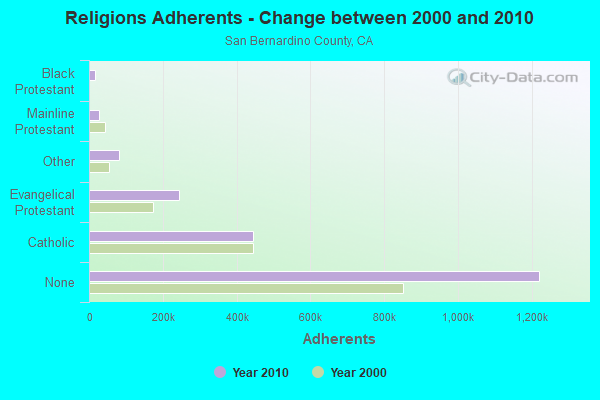
| Religion | Adherents | Congregations |
|---|---|---|
| Catholic | 445,334 | 55 |
| Evangelical Protestant | 243,524 | 832 |
| Other | 80,047 | 205 |
| Mainline Protestant | 26,062 | 135 |
| Black Protestant | 14,969 | 37 |
| Orthodox | 3,868 | 10 |
| None | 1,221,406 | - |
Food Environment Statistics:
| San Bernardino County: | 1.50 / 10,000 pop. |
| California: | 2.14 / 10,000 pop. |
| Here: | 0.05 / 10,000 pop. |
| California: | 0.04 / 10,000 pop. |
| San Bernardino County: | 0.57 / 10,000 pop. |
| California: | 0.62 / 10,000 pop. |
| San Bernardino County: | 1.60 / 10,000 pop. |
| California: | 1.49 / 10,000 pop. |
| This county: | 4.69 / 10,000 pop. |
| California: | 7.42 / 10,000 pop. |
| San Bernardino County: | 7.4% |
| California: | 7.3% |
| San Bernardino County: | 27.1% |
| California: | 21.3% |
| This county: | 16.2% |
| California: | 17.9% |
Health and Nutrition:
| Chino Hills: | 52.5% |
| California: | 49.4% |
| Chino Hills: | 51.9% |
| California: | 48.0% |
| Chino Hills: | 27.8 |
| California: | 28.1 |
| This city: | 18.0% |
| California: | 20.2% |
| Chino Hills: | 12.3% |
| California: | 11.2% |
| Here: | 6.8 |
| California: | 6.8 |
| Here: | 31.4% |
| State: | 31.5% |
| Chino Hills: | 59.5% |
| California: | 56.4% |
| Chino Hills: | 83.6% |
| California: | 80.9% |
More about Health and Nutrition of Chino Hills, CA Residents
| Local government employment and payroll (March 2022) | |||||
| Function | Full-time employees | Monthly full-time payroll | Average yearly full-time wage | Part-time employees | Monthly part-time payroll |
|---|---|---|---|---|---|
| Other Government Administration | 41 | $364,916 | $106,805 | 11 | $30,102 |
| Parks and Recreation | 25 | $201,757 | $96,843 | 52 | $89,850 |
| Water Supply | 21 | $154,633 | $88,362 | 1 | $1,791 |
| Financial Administration | 21 | $183,465 | $104,837 | 1 | $1,580 |
| Streets and Highways | 15 | $121,877 | $97,502 | 5 | $20,630 |
| Sewerage | 8 | $58,985 | $88,478 | 1 | $4,106 |
| Other and Unallocable | 7 | $52,851 | $90,602 | 1 | $1,790 |
| Natural Resources | 3 | $18,243 | $72,972 | 0 | $0 |
| Housing and Community Development (Local) | 3 | $24,309 | $97,236 | 0 | $0 |
| Totals for Government | 144 | $1,181,037 | $98,420 | 72 | $149,850 |
Chino Hills government finances - Expenditure in 2017 (per resident):
- Construction - Central Staff Services: $11,683,000 ($149.88)
Water Utilities: $611,000 ($7.84)
Protective Inspection and Regulation - Other: $503,000 ($6.45)
Regular Highways: $473,000 ($6.07)
Housing and Community Development: $177,000 ($2.27)
- Current Operations - Water Utilities: $20,130,000 ($258.25)
Central Staff Services: $16,593,000 ($212.87)
Regular Highways: $14,104,000 ($180.94)
Police Protection: $13,657,000 ($175.20)
Sewerage: $7,790,000 ($99.94)
Parks and Recreation: $6,095,000 ($78.19)
Solid Waste Management: $4,890,000 ($62.73)
Protective Inspection and Regulation - Other: $3,763,000 ($48.28)
Financial Administration: $2,190,000 ($28.10)
Housing and Community Development: $242,000 ($3.10)
General - Other: $208,000 ($2.67)
Health - Other: $165,000 ($2.12)
- General - Interest on Debt: $4,031,000 ($51.71)
- Intergovernmental to Local - Other - Police Protection: $12,909,000 ($165.61)
Other - Health - Other: $269,000 ($3.45)
Other - General - Other: $198,000 ($2.54)
Other - Local Fire Protection: $114,000 ($1.46)
Other - Solid Waste Management: $103,000 ($1.32)
- Other Capital Outlay - General Public Building: $2,440,000 ($31.30)
Water Utilities: $2,336,000 ($29.97)
Parks and Recreation: $1,362,000 ($17.47)
General - Other: $110,000 ($1.41)
Regular Highways: $24,000 ($0.31)
Central Staff Services: $5,000 ($0.06)
- Water Utilities - Interest on Debt: $1,123,000 ($14.41)
Chino Hills government finances - Revenue in 2017 (per resident):
- Charges - Other: $31,178,000 ($399.98)
Sewerage: $7,826,000 ($100.40)
Solid Waste Management: $4,890,000 ($62.73)
Parks and Recreation: $1,476,000 ($18.94)
- Federal Intergovernmental - Other: $1,430,000 ($18.35)
Housing and Community Development: $286,000 ($3.67)
- Local Intergovernmental - Other: $171,000 ($2.19)
- Miscellaneous - Sale of Property: $11,584,000 ($148.61)
General Revenue - Other: $7,317,000 ($93.87)
Donations From Private Sources: $1,466,000 ($18.81)
Rents: $567,000 ($7.27)
Fines and Forfeits: $430,000 ($5.52)
Interest Earnings: $402,000 ($5.16)
Special Assessments: $8,000 ($0.10)
- Revenue - Water Utilities: $25,671,000 ($329.33)
- State Intergovernmental - Highways: $1,498,000 ($19.22)
Other: $333,000 ($4.27)
General Local Government Support: $51,000 ($0.65)
- Tax - Other License: $19,587,000 ($251.28)
Property: $12,554,000 ($161.05)
General Sales and Gross Receipts: $11,123,000 ($142.70)
Public Utilities Sales: $2,208,000 ($28.33)
Other Selective Sales: $1,081,000 ($13.87)
Documentary and Stock Transfer: $416,000 ($5.34)
Other: $104,000 ($1.33)
Occupation and Business License - Other: $99,000 ($1.27)
Chino Hills government finances - Debt in 2017 (per resident):
- Long Term Debt - Beginning Outstanding - Unspecified Public Purpose: $128,846,000 ($1652.95)
Outstanding Unspecified Public Purpose: $115,081,000 ($1476.36)
Retired Unspecified Public Purpose: $13,765,000 ($176.59)
Chino Hills government finances - Cash and Securities in 2017 (per resident):
- Bond Funds - Cash and Securities: $5,705,000 ($73.19)
- Other Funds - Cash and Securities: $210,560,000 ($2701.25)
6.45% of this county's 2021 resident taxpayers lived in other counties in 2020 ($54,954 average adjusted gross income)
| Here: | 6.45% |
| California average: | 5.19% |
0.03% of residents moved from foreign countries ($259 average AGI)
San Bernardino County: 0.03% California average: 0.03%
Top counties from which taxpayers relocated into this county between 2020 and 2021:
| from Los Angeles County, CA | |
| from Riverside County, CA | |
| from Orange County, CA |
6.46% of this county's 2020 resident taxpayers moved to other counties in 2021 ($59,647 average adjusted gross income)
| Here: | 6.46% |
| California average: | 6.14% |
0.03% of residents moved to foreign countries ($253 average AGI)
San Bernardino County: 0.03% California average: 0.02%
Top counties to which taxpayers relocated from this county between 2020 and 2021:
| to Riverside County, CA | |
| to Los Angeles County, CA | |
| to Orange County, CA |
| Businesses in Chino Hills, CA | ||||
| Name | Count | Name | Count | |
|---|---|---|---|---|
| 24 Hour Fitness | 1 | Hilton | 1 | |
| 7-Eleven | 2 | Holiday Inn | 1 | |
| AT&T | 1 | Hollister Co. | 1 | |
| Aeropostale | 1 | Jamba Juice | 1 | |
| Albertsons | 2 | JoS. A. Bank | 1 | |
| American Eagle Outfitters | 1 | Johnny Rockets | 1 | |
| Ann Taylor | 1 | Just Tires | 1 | |
| AutoZone | 1 | Justice | 1 | |
| Baja Fresh Mexican Grill | 1 | KFC | 1 | |
| Banana Republic | 1 | Lane Bryant | 1 | |
| Barnes & Noble | 1 | LensCrafters | 1 | |
| Baskin-Robbins | 1 | Little Caesars Pizza | 1 | |
| Bath & Body Works | 1 | Lowe's | 2 | |
| Bed Bath & Beyond | 1 | McDonald's | 2 | |
| Blockbuster | 1 | New Balance | 2 | |
| Buffalo Wild Wings | 1 | New York & Co | 1 | |
| CVS | 2 | Nike | 6 | |
| Carl\s Jr. | 1 | Pac Sun | 1 | |
| Chick-Fil-A | 1 | Panda Express | 1 | |
| Chico's | 1 | Panera Bread | 1 | |
| Chipotle | 1 | PetSmart | 1 | |
| Circle K | 6 | Pizza Hut | 1 | |
| Cold Stone Creamery | 1 | Popeyes | 1 | |
| Coldwater Creek | 1 | Quiznos | 1 | |
| Costco | 1 | RadioShack | 2 | |
| Curves | 1 | Rite Aid | 2 | |
| DHL | 2 | Safeway | 1 | |
| Dairy Queen | 1 | Starbucks | 6 | |
| Dennys | 2 | Subway | 1 | |
| Discount Tire | 1 | T-Mobile | 4 | |
| Domino's Pizza | 1 | Taco Bell | 1 | |
| El Pollo Loco | 1 | Toys"R"Us | 1 | |
| FedEx | 4 | Trader Joe's | 1 | |
| Firestone Complete Auto Care | 1 | UPS | 4 | |
| Forever 21 | 1 | Vans | 2 | |
| GNC | 3 | Victoria's Secret | 1 | |
| Gymboree | 1 | Vons | 1 | |
| H&M | 1 | Walgreens | 1 | |
| H&R Block | 1 | Wendy's | 1 | |
Strongest AM radio stations in Chino Hills:
- KPLS (830 AM; 50 kW; ORANGE, CA; Owner: CRN LICENSES, LLC)
- KLAC (570 AM; 50 kW; LOS ANGELES, CA; Owner: AMFM RADIO LICENSES, L.L.C.)
- KFI (640 AM; 50 kW; LOS ANGELES, CA; Owner: CAPSTAR TX LIMITED PARTNERSHIP)
- KMNY (1600 AM; 5 kW; POMONA, CA; Owner: MULTICULTURAL RADIO BROADCASTING, INC.)
- KTNQ (1020 AM; 50 kW; LOS ANGELES, CA; Owner: KTNQ-AM LICENSE CORP.)
- KXTA (1150 AM; 50 kW; LOS ANGELES, CA; Owner: CITICASTERS LICENSES, L.P.)
- KDIS (1110 AM; 50 kW; PASADENA, CA; Owner: ABC,INC.)
- KFWB (980 AM; 50 kW; LOS ANGELES, CA; Owner: INFINITY BROADCASTING OPERATIONS, INC.)
- KSPA (1510 AM; 10 kW; ONTARIO, CA; Owner: ONTARIO BROADCASTING, LLC)
- KMPC (1540 AM; 50 kW; LOS ANGELES, CA; Owner: ROSE CITY RADIO CORPORATION)
- KALI (900 AM; 6 kW; WEST COVINA, CA; Owner: MULTICULTURAL RADIO BROADCASTING, INC.)
- KSPN (710 AM; 50 kW; LOS ANGELES, CA; Owner: KABC-AM RADIO, INC.)
- KNX (1070 AM; 50 kW; LOS ANGELES, CA; Owner: INFINITY BROADCASTING OPERATIONS, INC.)
Strongest FM radio stations in Chino Hills:
- K264AF (100.7 FM; GUASTI, CA; Owner: EDUCATIONAL MEDIA FOUNDATION)
- KCBS-FM (93.1 FM; LOS ANGELES, CA; Owner: INFINITY BROADCASTING OPERATIONS, INC.)
- KSCA (101.9 FM; GLENDALE, CA; Owner: HBC LICENSE CORPORATION)
- KLOS (95.5 FM; LOS ANGELES, CA; Owner: KLOS-FM RADIO, INC.)
- KOST (103.5 FM; LOS ANGELES, CA; Owner: CAPSTAR TX LIMITED PARTNERSHIP)
- K212FA (90.3 FM; TEMPLE CITY, CA; Owner: EDUCATIONAL MEDIA FOUNDATION)
- KIIS-FM (102.7 FM; LOS ANGELES, CA; Owner: CITICASTERS LICENSES, L.P.)
- KLVE (107.5 FM; LOS ANGELES, CA; Owner: KLVE-FM LICENSE CORP.)
- KPCC (89.3 FM; PASADENA, CA; Owner: PASADENA AREA COMMUNITY COLLEGE DISTRICT)
- KHHT (92.3 FM; LOS ANGELES, CA; Owner: AMFM RADIO LICENSES, L.L.C.)
- KBIG-FM (104.3 FM; LOS ANGELES, CA; Owner: AMFM RADIO LICENSES, L.L.C.)
- KTWV (94.7 FM; LOS ANGELES, CA; Owner: INFINITY BROADCASTING OPERATIONS, INC.)
- KMZT-FM (105.1 FM; LOS ANGELES, CA; Owner: MOUNT WILSON FM BROADCASTERS, INC.)
- KPFK (90.7 FM; LOS ANGELES, CA; Owner: PACIFICA FOUNDATION, INC)
- K216EM (91.1 FM; ARCADIA, CA; Owner: LIFE ON THE WAY COMMUNICATIONS, INC.)
- KZLA-FM (93.9 FM; LOS ANGELES, CA; Owner: EMMIS RADIO LICENSE CORPORATION)
- KPWR (105.9 FM; LOS ANGELES, CA; Owner: EMMIS RADIO LICENSE CORPORATION)
- KRCV (98.3 FM; WEST COVINA, CA; Owner: HBC LICENSE CORPORATION)
- KLSX (97.1 FM; LOS ANGELES, CA; Owner: INFINITY BROADCASTING OPERATIONS, INC.)
- KUSC (91.5 FM; LOS ANGELES, CA; Owner: UNIVERSITY OF SOUTHERN CALIFORNIA)
TV broadcast stations around Chino Hills:
- KTRO-LP (Channel 50; LANCASTER, CA; Owner: ROBERT D. ADELMAN)
- KCBS-TV (Channel 2; LOS ANGELES, CA; Owner: CBS BROADCASTING INC.)
- KHIZ (Channel 64; BARSTOW, CA; Owner: SUNBELT TELEVISION, INC.)
- KTLA-TV (Channel 5; LOS ANGELES, CA; Owner: KTLA INC.)
- KABC-TV (Channel 7; LOS ANGELES, CA; Owner: ABC HOLDING COMPANY, INC.)
- KCAL-TV (Channel 9; LOS ANGELES, CA; Owner: VIACOM TELEVISION STATIONS GROUP OF LOS ANGELES LLC)
- KNBC (Channel 4; LOS ANGELES, CA; Owner: NBC SUBSIDIARY (KNBC-TV), INC.)
- KRCA (Channel 62; RIVERSIDE, CA; Owner: KRCA LICENSE CORP.)
- KMEX-TV (Channel 34; LOS ANGELES, CA; Owner: KMEX LICENSE PARTNERSHIP, G.P.)
- KAZA-TV (Channel 54; AVALON, CA; Owner: PAPPAS SOUTHERN CALIFORNIA LICENSE LLC)
- KPXN (Channel 30; SAN BERNARDINO, CA; Owner: PAXSON LOS ANGELES LICENSE, INC.)
- KDOC-TV (Channel 56; ANAHEIM, CA; Owner: GOLDEN ORANGE BROADCASTING CO., INC.)
- KOCE-TV (Channel 50; HUNTINGTON BEACH, CA; Owner: BD. OF TRUSTEES, COAST COMMUNITY COLLEGE DIST.)
- KSCI (Channel 18; LONG BEACH, CA; Owner: KSLS, INC.)
- National Bridge Inventory (NBI) Statistics
- 42Number of bridges
- 633ft / 193mTotal length
- 1,554,001Total average daily traffic
- 146,452Total average daily truck traffic
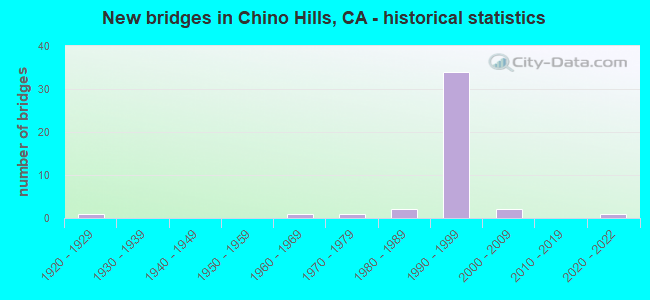
- New bridges - historical statistics
- 11920-1929
- 11960-1969
- 11970-1979
- 21980-1989
- 341990-1999
- 22000-2009
- 12020-2022
FCC Registered Commercial Land Mobile Towers: 2 (See the full list of FCC Registered Commercial Land Mobile Towers in Chino Hills, CA)
FCC Registered Broadcast Land Mobile Towers: 26 (See the full list of FCC Registered Broadcast Land Mobile Towers)
FCC Registered Microwave Towers: 29 (See the full list of FCC Registered Microwave Towers in this town)
FCC Registered Amateur Radio Licenses: 394 (See the full list of FCC Registered Amateur Radio Licenses in Chino Hills)
FAA Registered Aircraft Manufacturers and Dealers: 3 (See the full list of FAA Registered Manufacturers and Dealers in Chino Hills)
FAA Registered Aircraft: 53 (See the full list of FAA Registered Aircraft)
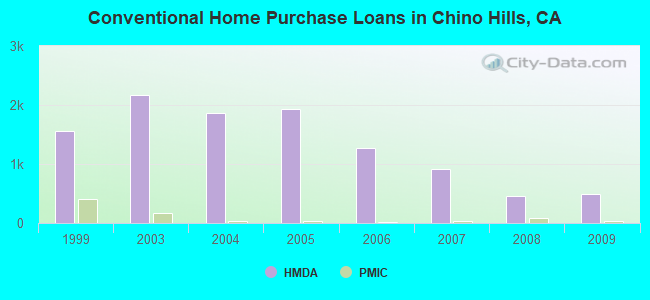
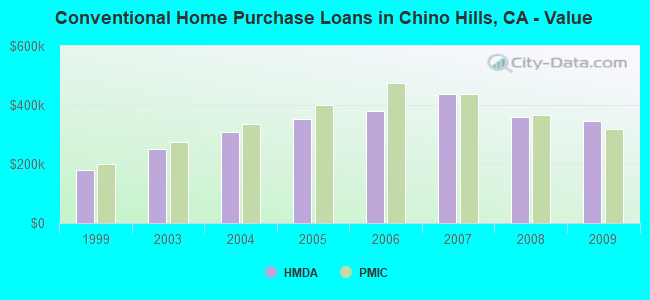
| Home Mortgage Disclosure Act Aggregated Statistics For Year 2009 (Based on 7 full and 3 partial tracts) | ||||||||||||||
| A) FHA, FSA/RHS & VA Home Purchase Loans | B) Conventional Home Purchase Loans | C) Refinancings | D) Home Improvement Loans | E) Loans on Dwellings For 5+ Families | F) Non-occupant Loans on < 5 Family Dwellings (A B C & D) | G) Loans On Manufactured Home Dwelling (A B C & D) | ||||||||
|---|---|---|---|---|---|---|---|---|---|---|---|---|---|---|
| Number | Average Value | Number | Average Value | Number | Average Value | Number | Average Value | Number | Average Value | Number | Average Value | Number | Average Value | |
| LOANS ORIGINATED | 161 | $307,860 | 488 | $344,468 | 1,866 | $300,127 | 94 | $241,297 | 2 | $12,898,185 | 66 | $266,429 | 5 | $37,732 |
| APPLICATIONS APPROVED, NOT ACCEPTED | 12 | $351,643 | 74 | $325,146 | 258 | $311,136 | 23 | $70,637 | 0 | $0 | 12 | $245,712 | 2 | $52,090 |
| APPLICATIONS DENIED | 25 | $283,432 | 101 | $372,669 | 612 | $340,139 | 33 | $76,503 | 0 | $0 | 43 | $241,211 | 4 | $48,338 |
| APPLICATIONS WITHDRAWN | 39 | $314,041 | 83 | $334,969 | 385 | $314,352 | 39 | $212,562 | 0 | $0 | 22 | $264,195 | 1 | $70,390 |
| FILES CLOSED FOR INCOMPLETENESS | 6 | $275,727 | 19 | $446,110 | 142 | $326,453 | 1 | $30,000 | 0 | $0 | 6 | $253,898 | 2 | $257,025 |
Detailed mortgage data for all 10 tracts in Chino Hills, CA
| Private Mortgage Insurance Companies Aggregated Statistics For Year 2009 (Based on 7 full and 3 partial tracts) | ||||
| A) Conventional Home Purchase Loans | B) Refinancings | |||
|---|---|---|---|---|
| Number | Average Value | Number | Average Value | |
| LOANS ORIGINATED | 35 | $319,483 | 11 | $348,513 |
| APPLICATIONS APPROVED, NOT ACCEPTED | 16 | $345,541 | 2 | $435,000 |
| APPLICATIONS DENIED | 8 | $373,964 | 5 | $391,110 |
| APPLICATIONS WITHDRAWN | 1 | $217,000 | 0 | $0 |
| FILES CLOSED FOR INCOMPLETENESS | 1 | $346,640 | 0 | $0 |
2005 - 2018 National Fire Incident Reporting System (NFIRS) incidents
- Fire incident types reported to NFIRS in Chino Hills, CA
- 7436.6%Outside Fires
- 7235.6%Structure Fires
- 5125.2%Mobile Property/Vehicle Fires
- 52.5%Other
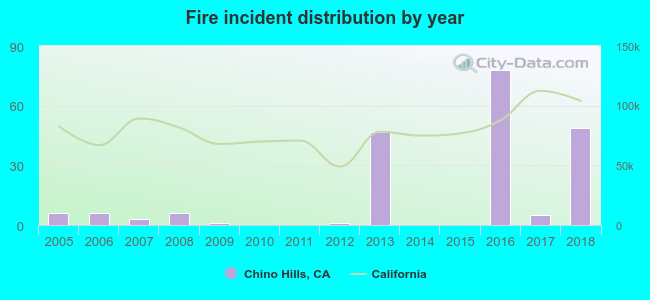 Based on the data from the years 2005 - 2018 the average number of fires per year is 14. The highest number of reported fire incidents - 78 took place in 2016, and the least - 0 in 2010. The data has a rising trend.
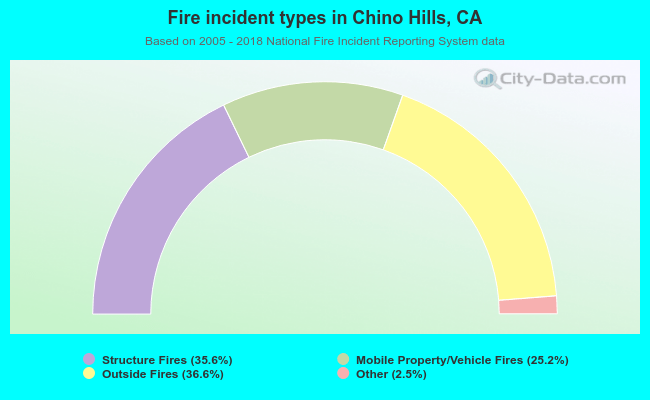 When looking into fire subcategories, the most reports belonged to: Outside Fires (36.6%), and Structure Fires (35.6%).
Fire-safe hotels and motels in Chino Hills, California:
- Hampton Inn And Suites Chino Hills / Palmetto Hospitality Of Chino Hills, 3150 Chino Ave, Chino Hills, California 91709 , Phone: (909) 591-2474, Fax: (909) 591-2476
- Ayres Hotel Chino Hills, 4785 Chino Hills Pkwy, Chino Hills, California 91709 , Phone: (909) 631-2922
- Hotel Chino Hills, 15433 Fairfield Ranch Rd, Chino Hills, California 91709 , Phone: (909) 606-5995, Fax: (909) 614-7291
| Most common first names in Chino Hills, CA among deceased individuals | ||
| Name | Count | Lived (average) |
|---|---|---|
| John | 49 | 71.7 years |
| Mary | 49 | 79.7 years |
| Robert | 41 | 71.2 years |
| William | 40 | 78.3 years |
| James | 38 | 69.9 years |
| Helen | 27 | 82.0 years |
| Edward | 23 | 75.3 years |
| Maria | 22 | 80.0 years |
| Margaret | 22 | 82.0 years |
| Dorothy | 19 | 79.2 years |
| Most common last names in Chino Hills, CA among deceased individuals | ||
| Last name | Count | Lived (average) |
|---|---|---|
| Smith | 17 | 75.4 years |
| Johnson | 15 | 72.7 years |
| Williams | 11 | 76.6 years |
| Martinez | 11 | 74.9 years |
| Lopez | 11 | 73.7 years |
| Gonzales | 11 | 71.2 years |
| Davis | 10 | 73.0 years |
| Kim | 8 | 74.1 years |
| Jones | 8 | 71.7 years |
| Garcia | 8 | 68.6 years |
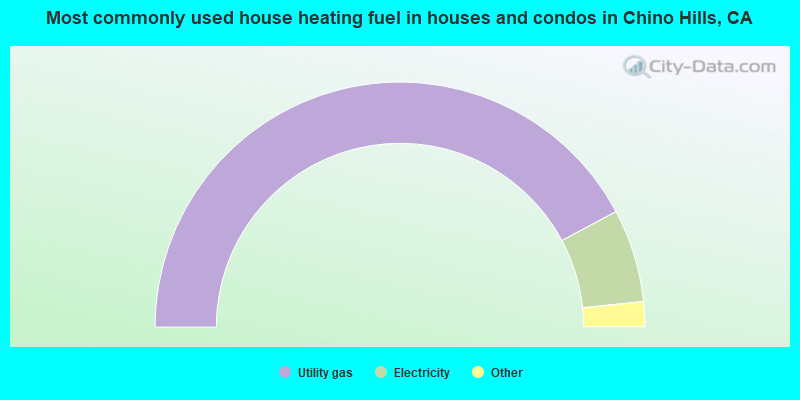
- 84.4%Utility gas
- 12.3%Electricity
- 1.9%Bottled, tank, or LP gas
- 0.9%Solar energy
- 0.3%No fuel used
- 0.1%Other fuel
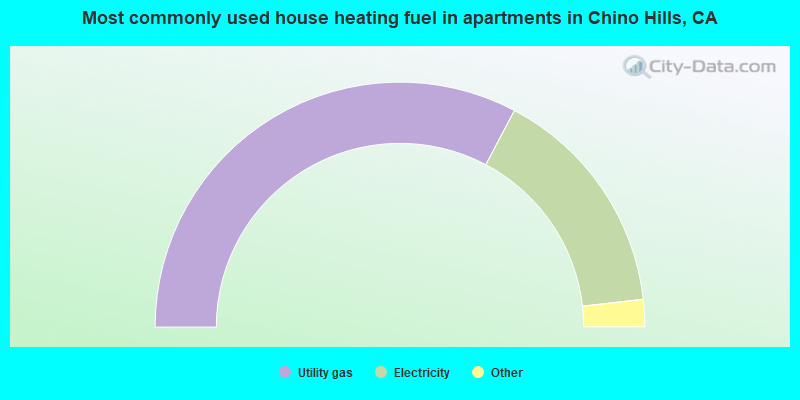
- 65.5%Utility gas
- 30.9%Electricity
- 3.3%Bottled, tank, or LP gas
- 0.3%No fuel used
Chino Hills compared to California state average:
- Unemployed percentage significantly below state average.
- Black race population percentage below state average.
- Median age above state average.
- Renting percentage below state average.
- Number of rooms per house above state average.
- House age below state average.
- Percentage of population with a bachelor's degree or higher above state average.
Chino Hills on our top lists:
- #1 on the list of "Top 101 cities with the least people below the poverty level (population 50,000+)"
- #4 on the list of "Top 101 cities that people commute from (largest negative percentage daily daytime population change due to commuting) (population 50,000+)"
- #6 on the list of "Top 101 cities with largest percentage of females in industries: utilities (population 50,000+)"
- #7 on the list of "Top 101 cities with the lowest number of thefts per 100,000 residents (population 50,000+)"
- #14 on the list of "Top 101 cities with the lowest number of rapes per 100,000 residents (population 50,000+)"
- #15 on the list of "Top 101 cities with largest percentage of females in occupations: health diagnosing and treating practitioners and other technical occupations (population 50,000+)"
- #20 on the list of "Top 101 cities with largest percentage of females in occupations: office and administrative support occupations (population 50,000+)"
- #23 on the list of "Top 101 cities with largest percentage of males in occupations: business and financial operations occupations (population 50,000+)"
- #23 on the list of "Top 101 cities with the lowest city-data.com crime index (population 50,000+)"
- #23 on the list of "Top 101 cities with largest percentage of females in industries: real estate and rental and leasing (population 50,000+)"
- #25 on the list of "Top 101 cities with the largest percentage of one, detached housing units in structures (20,000+ housing units)"
- #26 on the list of "Top 101 cities with largest percentage of males in industries: wholesale trade (population 50,000+)"
- #27 on the list of "Top 100 safest cities (lowest city-data.com crime index) (pop. 50,000+)"
- #28 on the list of "Top 101 cities with the most residents born in Taiwan (population 500+)"
- #35 on the list of "Top 101 cities with the smallest household incomes disparities (population 50,000+)"
- #38 on the list of "Top 100 cities with longest commuting times (pop. 50,000+)"
- #43 on the list of "Top 101 cities with largest percentage of females in industries: finance and insurance (population 50,000+)"
- #44 on the list of "Top 101 cities with largest percentage of females in industries: wholesale trade (population 50,000+)"
- #47 on the list of "Top 101 cities with the lowest number of murders per 100,000 residents (population 50,000+)"
- #50 on the list of "Top 101 cities with the lowest percentage of single-parent households, population 50,000+"
- #5 on the list of "Top 101 counties with the highest Nitrogen Dioxide air pollution readings in 2012 (ppm)"
- #5 on the list of "Top 101 counties with the highest ground withdrawal of fresh water for public supply"
- #10 on the list of "Top 101 counties with the most Evangelical Protestant congregations"
- #14 on the list of "Top 101 counties with the highest total withdrawal of fresh water for public supply"
- #15 on the list of "Top 101 counties with the most Evangelical Protestant adherents (pop. 50,000+)"

|
|
Total of 625 patent applications in 2008-2024.