Estimated zip code population in 2022: 38,996 Zip code population in 2010: 38,976 Zip code population in 2000: 39,055
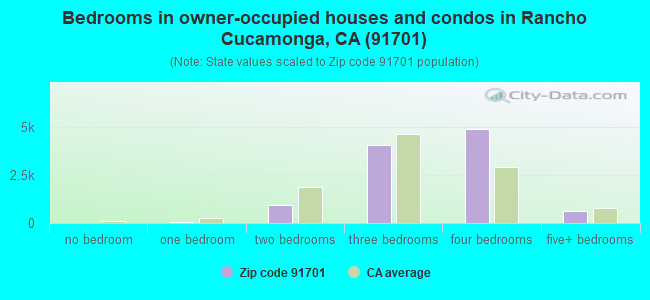
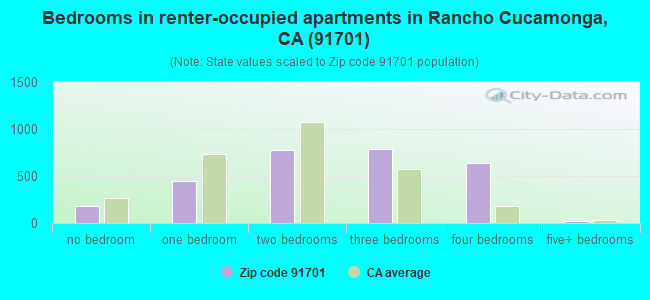
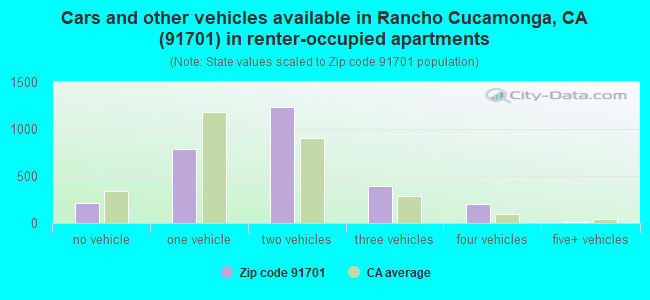
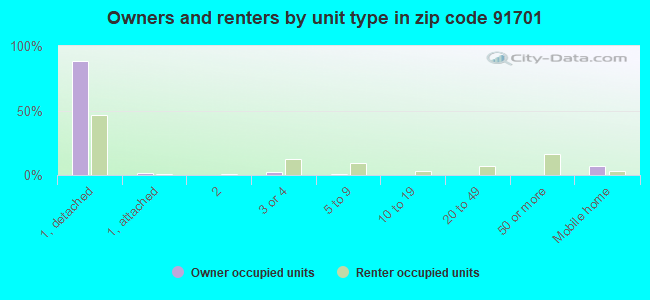
Houses and condos: 13,646 Renter-occupied apartments: 2,856
% of renters here:
21%
State:
44%
March 2022 cost of living index in zip code 91701: 82.9 (low, U.S. average is 100)
Land area: 7.3 sq. mi. Water area: 0.0 sq. mi.
Population density: 5,364 people per square mile
(average).
OSM Map
General Map
Google Map
MSN Map
OSM Map
General Map
Google Map
MSN Map
OSM Map
General Map
Google Map
MSN Map
OSM Map
General Map
Google Map
MSN Map
Please wait while loading the map...
Real estate property taxes paid for housing units in 2022:
This zip code:
0.6% ($4,459)
California:
0.7% ($4,831)
Median real estate property taxes paid for housing units with mortgages in 2022: $4,793 (0.7%) Median real estate property taxes paid for housing units with no mortgage in 2022: $3,789 (0.5%)
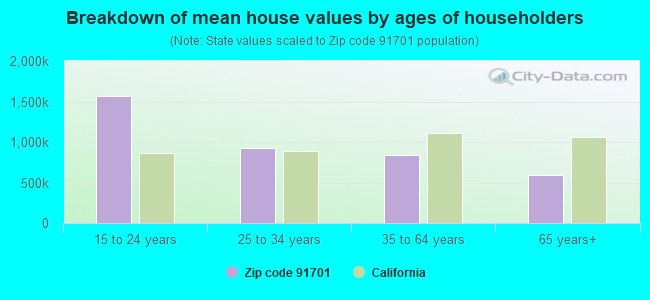
Estimated median house/condo value in 2022: $721,112
91701:
$721,112
California:
$715,900
According to our research of California and other state lists, there were 29 registered sex offenders living in 91701 zip code as of April 26, 2024. The ratio of all residents to sex offenders in zip code 91701 is 1,430 to 1. The ratio of registered sex offenders to all residents in this zip code is lower than the state average.
Median resident age:
This zip code:
42.9 years
California median age:
37.9 years
Average household size:
This zip code:
2.9 people
California:
2.8 people
Averages for the 2020 tax year for zip code 91701, filed in 2021:
Average Adjusted Gross Income (AGI) in 2020: $84,175 (Individual Income Tax Returns)
Here:
$84,175
State:
$95,910
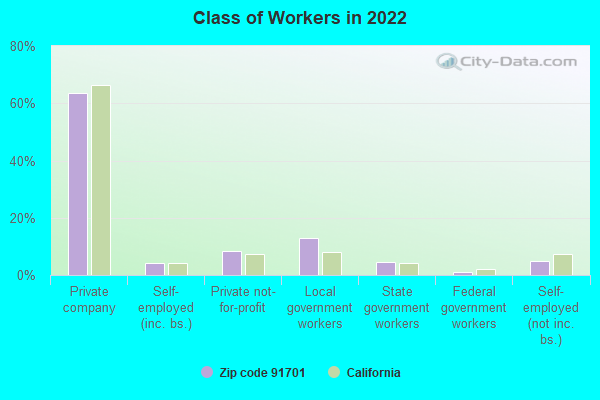
Salary/wage: $72,881 (reported on 78.5% of returns)
Here:
$72,881
State:
$77,331
(% of AGI for various income ranges: 1125.9% for AGIs below $25k, 3701.3% for AGIs $25k-50k, 7064.2% for AGIs $50k-75k, 10304.8% for AGIs $75k-100k, 20135.0% for AGIs $100k-200k, 66100.4% for AGIs over 200k)
Taxable interest for individuals: $898 (reported on 42.5% of returns)
This zip code:
$898
California:
$2,294
(% of AGI for various income ranges: 17.5% for AGIs below $25k, 26.0% for AGIs $25k-50k, 64.7% for AGIs $50k-75k, 60.7% for AGIs $75k-100k, 96.2% for AGIs $100k-200k, 493.3% for AGIs over 200k)
Ordinary dividends: $4,336 (reported on 18.3% of returns)
Here:
$4,336
State:
$10,949
(% of AGI for various income ranges: 18.1% for AGIs below $25k, 42.6% for AGIs $25k-50k, 60.6% for AGIs $50k-75k, 89.3% for AGIs $75k-100k, 189.4% for AGIs $100k-200k, 1668.7% for AGIs over 200k)
Net capital gain/loss in AGI: +$13,940 (reported on 18.3% of returns)
Here:
+$13,940
State:
+$49,306
(% of AGI for various income ranges: 11.5% for AGIs below $25k, 27.6% for AGIs $25k-50k, 80.2% for AGIs $50k-75k, 114.4% for AGIs $75k-100k, 391.3% for AGIs $100k-200k, 8309.3% for AGIs over 200k)
Profit/loss from business: +$11,257 (reported on 18.3% of returns)
Here:
+$11,257
State:
+$15,671
(% of AGI for various income ranges: 150.7% for AGIs below $25k, 265.4% for AGIs $25k-50k, 270.1% for AGIs $50k-75k, 311.0% for AGIs $75k-100k, 410.9% for AGIs $100k-200k, 2304.0% for AGIs over 200k)
Taxable individual retirement arrangement distribution: $20,309 (reported on 8.3% of returns)
91701:
$20,309
California:
$23,505
(% of AGI for various income ranges: 55.8% for AGIs below $25k, 116.2% for AGIs $25k-50k, 245.8% for AGIs $50k-75k, 351.2% for AGIs $75k-100k, 585.1% for AGIs $100k-200k, 1477.3% for AGIs over 200k)
Self-employed (Keogh) retirement plans: $25,000 (reported on 0.5% of returns)
91701:
$25,000
California:
$30,163
(% of AGI for various income ranges: 28.7% for AGIs $75k-100k, 419.6% for AGIs over 200k)
Total itemized deductions: $32,035 (reported on 21.9% of returns)
Here:
$32,035
State:
$39,517
(% of AGI for various income ranges: 104.2% for AGIs below $25k, 286.6% for AGIs $25k-50k, 768.2% for AGIs $50k-75k, 1322.6% for AGIs $75k-100k, 2790.0% for AGIs $100k-200k, 8010.9% for AGIs over 200k)
Charity contributions: $6,832 (reported on 19.2% of returns)
Here:
$6,832
State:
$12,598
(% of AGI for various income ranges: 6.4% for AGIs below $25k, 32.6% for AGIs $25k-50k, 101.3% for AGIs $50k-75k, 207.2% for AGIs $75k-100k, 503.5% for AGIs $100k-200k, 2078.4% for AGIs over 200k)
Taxes paid: $8,808 (reported on 21.8% of returns)
91701:
$8,808
State:
$8,807
(% of AGI for various income ranges: 22.2% for AGIs below $25k, 69.5% for AGIs $25k-50k, 197.8% for AGIs $50k-75k, 407.5% for AGIs $75k-100k, 838.6% for AGIs $100k-200k, 1874.0% for AGIs over 200k)
Earned income credit: $1,785 (reported on 11.0% of returns)
Here:
$1,785
State:
$2,074
(% of AGI for various income ranges: 65.4% for AGIs below $25k, 54.9% for AGIs $25k-50k, 1.0% for AGIs $50k-75k)
Percentage of individuals using paid preparers for their 2020 taxes: 92.7%
Here:
93%
State:
92%
(% for various income ranges: 91.6% for AGIs below $25k, 92.4% for AGIs $25k-50k, 92.7% for AGIs $50k-75k, 92.3% for AGIs $75k-100k, 94.2% for AGIs $100k-200k, 94.3% for AGIs over 200k)
Averages for the 2012 tax year for zip code 91701, filed in 2013:
Average Adjusted Gross Income (AGI) in 2012: $64,807 (Individual Income Tax Returns)
Here:
$64,807
State:
$72,726
Salary/wage: $59,599 (reported on 83.2% of returns)
Here:
$59,599
State:
$59,079
(% of AGI for various income ranges: 72.3% for AGIs below $25k, 76.1% for AGIs $25k-50k, 78.3% for AGIs $50k-75k, 79.4% for AGIs $75k-100k, 81.5% for AGIs $100k-200k, 61.7% for AGIs over 200k)
Taxable interest for individuals: $810 (reported on 43.2% of returns)
This zip code:
$810
California:
$2,146
(% of AGI for various income ranges: 1.0% for AGIs below $25k, 0.6% for AGIs $25k-50k, 0.7% for AGIs $50k-75k, 0.4% for AGIs $75k-100k, 0.3% for AGIs $100k-200k, 0.8% for AGIs over 200k)
Ordinary dividends: $2,963 (reported on 17.1% of returns)
Here:
$2,963
State:
$9,308
(% of AGI for various income ranges: 1.0% for AGIs below $25k, 0.8% for AGIs $25k-50k, 0.7% for AGIs $50k-75k, 0.5% for AGIs $75k-100k, 0.5% for AGIs $100k-200k, 1.7% for AGIs over 200k)
Net capital gain/loss in AGI: +$3,313 (reported on 14.5% of returns)
Here:
+$3,313
State:
+$30,460
(% of AGI for various income ranges: 0.3% for AGIs $25k-50k, 0.3% for AGIs $75k-100k, 0.3% for AGIs $100k-200k, 3.6% for AGIs over 200k)
Profit/loss from business: +$12,711 (reported on 17.5% of returns)
Here:
+$12,711
State:
+$17,064
(% of AGI for various income ranges: 10.8% for AGIs below $25k, 5.9% for AGIs $25k-50k, 2.8% for AGIs $50k-75k, 2.2% for AGIs $75k-100k, 2.4% for AGIs $100k-200k, 3.2% for AGIs over 200k)
Taxable individual retirement arrangement distribution: $17,205 (reported on 8.3% of returns)
91701:
$17,205
California:
$19,557
(% of AGI for various income ranges: 2.9% for AGIs below $25k, 2.5% for AGIs $25k-50k, 2.6% for AGIs $50k-75k, 2.0% for AGIs $75k-100k, 1.8% for AGIs $100k-200k, 2.6% for AGIs over 200k)
Self-employment retirement plans: $19,330 (reported on 0.5% of returns)
91701:
$19,330
California:
$24,530
(% of AGI for various income ranges: 0.2% for AGIs $50k-75k, 0.7% for AGIs over 200k)
Total itemized deductions: $27,696 (27% of AGI, reported on 48.6% of returns)
Here:
$27,696
State:
$34,004
Here:
26.9% of AGI
State:
22.7% of AGI
(% of AGI for various income ranges: 14.8% for AGIs below $25k, 17.6% for AGIs $25k-50k, 21.6% for AGIs $50k-75k, 23.0% for AGIs $75k-100k, 22.3% for AGIs $100k-200k, 18.5% for AGIs over 200k)
Charity contributions: $3,569 (reported on 42.9% of returns)
Here:
$3,569
State:
$4,659
(% of AGI for various income ranges: 0.9% for AGIs below $25k, 1.7% for AGIs $25k-50k, 2.3% for AGIs $50k-75k, 2.5% for AGIs $75k-100k, 2.7% for AGIs $100k-200k, 2.6% for AGIs over 200k)
Taxes paid: $8,891 (reported on 48.5% of returns)
91701:
$8,891
State:
$14,448
(% of AGI for various income ranges: 2.7% for AGIs below $25k, 3.9% for AGIs $25k-50k, 5.5% for AGIs $50k-75k, 6.6% for AGIs $75k-100k, 7.7% for AGIs $100k-200k, 8.6% for AGIs over 200k)
Earned income credit: $1,946 (reported on 13.2% of returns)
Here:
$1,946
State:
$2,286
(% of AGI for various income ranges: 4.8% for AGIs below $25k, 0.9% for AGIs $25k-50k)
Percentage of individuals using paid preparers for their 2012 taxes: 64.5%
Here:
65%
State:
64%
(% for various income ranges: 54.9% for AGIs below $25k, 65.0% for AGIs $25k-50k, 69.1% for AGIs $50k-75k, 70.7% for AGIs $75k-100k, 71.2% for AGIs $100k-200k, 80.0% for AGIs over 200k)
Averages for the 2004 tax year for zip code 91701, filed in 2005:
Average Adjusted Gross Income (AGI) in 2004: $58,010 (Individual Income Tax Returns)
Here:
$58,010
State:
$58,600
Salary/wage: $53,916 (reported on 86.1% of returns)
Here:
$53,916
State:
$49,455
(% of AGI for various income ranges: 128.9% for AGIs below $10k, 74.5% for AGIs $10k-25k, 80.2% for AGIs $25k-50k, 83.3% for AGIs $50k-75k, 87.5% for AGIs $75k-100k, 75.6% for AGIs over 100k)
Taxable interest for individuals: $1,002 (reported on 53.0% of returns)
This zip code:
$1,002
California:
$2,365
(% of AGI for various income ranges: 5.3% for AGIs below $10k, 1.7% for AGIs $10k-25k, 1.0% for AGIs $25k-50k, 0.8% for AGIs $50k-75k, 0.7% for AGIs $75k-100k, 0.8% for AGIs over 100k)
Taxable dividends: $1,561 (reported on 20.8% of returns)
Here:
$1,561
State:
$4,746
(% of AGI for various income ranges: 2.7% for AGIs below $10k, 1.1% for AGIs $10k-25k, 0.6% for AGIs $25k-50k, 0.4% for AGIs $50k-75k, 0.4% for AGIs $75k-100k, 0.6% for AGIs over 100k)
Net capital gain/loss: +$14,065 (reported on 17.1% of returns)
Here:
+$14,065
State:
+$23,418
(% of AGI for various income ranges: -0.7% for AGIs below $10k, 0.1% for AGIs $10k-25k, 0.5% for AGIs $25k-50k, 0.8% for AGIs $50k-75k, 0.7% for AGIs $75k-100k, 8.2% for AGIs over 100k)
Profit/loss from business: +$15,742 (reported on 18.1% of returns)
Here:
+$15,742
State:
+$16,826
(% of AGI for various income ranges: 5.5% for AGIs below $10k, 9.2% for AGIs $10k-25k, 6.7% for AGIs $25k-50k, 4.3% for AGIs $50k-75k, 3.4% for AGIs $75k-100k, 4.7% for AGIs over 100k)
IRA payment deduction: $3,430 (reported on 3.0% of returns)
91701:
$3,430
California:
$3,192
(% of AGI for various income ranges: 0.3% for AGIs below $10k, 0.2% for AGIs $10k-25k, 0.2% for AGIs $25k-50k, 0.2% for AGIs $50k-75k, 0.2% for AGIs $75k-100k, 0.1% for AGIs over 100k)
Self-employed pension: $15,872 (reported on 1.1% of returns)
Here:
$15,872
California:
$17,688
(% of AGI for various income ranges: 0.1% for AGIs $25k-50k, 0.2% for AGIs $50k-75k, 0.1% for AGIs $75k-100k, 0.5% for AGIs over 100k)
Total itemized deductions: $26,015 (29% of AGI, reported on 53.9% of returns)
Here:
$26,015
State:
$28,113
Here:
29.1% of AGI
State:
25.3% of AGI
(% of AGI for various income ranges: 24.9% for AGIs below $10k, 17.5% for AGIs $10k-25k, 24.2% for AGIs $25k-50k, 28.2% for AGIs $50k-75k, 27.6% for AGIs $75k-100k, 22.2% for AGIs over 100k)
Charity contributions deductions: $3,366 (4% of AGI, reported on 49.9% of returns)
Here:
$3,366
State:
$3,923
Here:
3.7% of AGI
State:
3.3% of AGI
(% of AGI for various income ranges: 1.0% for AGIs below $10k, 1.4% for AGIs $10k-25k, 2.4% for AGIs $25k-50k, 3.1% for AGIs $50k-75k, 3.2% for AGIs $75k-100k, 3.1% for AGIs over 100k)
Total tax: $7,814 (reported on 80.5% of returns)
91701:
$7,814
State:
$10,761
(% of AGI for various income ranges: 4.6% for AGIs below $10k, 5.0% for AGIs $10k-25k, 6.7% for AGIs $25k-50k, 7.6% for AGIs $50k-75k, 8.5% for AGIs $75k-100k, 14.8% for AGIs over 100k)
Earned income credit: $1,593 (reported on 9.6% of returns)
Here:
$1,593
State:
$1,763
Percentage of individuals using paid preparers for their 2004 taxes: 67.5%
Here:
67%
State:
66%
(% for various income ranges: 53.0% for AGIs below $10k, 63.5% for AGIs $10k-25k, 68.2% for AGIs $25k-50k, 73.1% for AGIs $50k-75k, 73.7% for AGIs $75k-100k, 76.1% for AGIs over 100k)
Likely homosexual households (counted as self-reported same-sex unmarried-partner households)
Lesbian couples: 0.1% of all households
Gay men: 0.0% of all households
Household received Food Stamps/SNAP in the past 12 months: 922 Household did not receive Food Stamps/SNAP in the past 12 months: 12,241
Women who had a birth in the past 12 months: 313 (250 now married, 62 unmarried) Women who did not have a birth in the past 12 months: 8,296 (3,855 now married, 4,417 unmarried)
Housing units in zip code 91701 with a mortgage: 7,178 (811 second mortgage, 796 both second mortgage and home equity loan) Houses without a mortgage: 73
Median monthly owner costs for units with a mortgage: $2,615 Median monthly owner costs for units without a mortgage: $763
Residents with income below the poverty level in 2022:
This zip code:
4.8%
Whole state:
12.2%
Residents with income below 50% of the poverty level in 2022:
This zip code:
2.5%
Whole state:
6.2%
Median number of rooms in houses and condos:
Here:
6.6
State:
6.0
Median number of rooms in apartments:
Here:
5.0
State:
3.9
Notable locations in this zip code not listed on our city pages
Shopping Centers: Vineyards Marketplace Shopping Center (1), Sunrise Shopping Center (2), Alta Loma Plaza Shopping Center (3), Alta Loma Square Shopping Center (4). Display/hide their locations on the map
Churches in zip code 91701 include: Community Baptist Church (A), Alta Loma Christian Church (B), The Lords House (C). Display/hide their locations on the map
Parks in zip code 91701 include: Victoria Groves Park (1), Hermosa Park (2), Heritage Community Park (3), Beryl Park East (4), Beryl Park West (5), Confluence Park (6), Rancho Cucamonga Central Park (7). Display/hide their locations on the map
In group quarters: 244 (-1 institutionalized population)
Size of family households: 4,183 2-persons, 2,217 3-persons, 2,839 4-persons, 1,141 5-persons, 175 6-persons, 130 7-or-more-persons
Size of nonfamily households: 2,140 1-person, 346 2-persons, 75 3-persons
5,796 married couples with children.
848 single-parent households (240 men, 608 women).
71.9% of residents of 91701 zip code speak English at home.
17.3% of residents speak Spanish at home (70% very well, 15% well, 12% not well, 3% not at all).
2.6% of residents speak other Indo-European language at home (68% very well, 27% well, 1% not well, 3% not at all).
7.0% of residents speak Asian or Pacific Island language at home (48% very well, 25% well, 26% not well, 1% not at all).
1.1% of residents speak other language at home (64% very well, 31% well, 3% not well, 2% not at all).
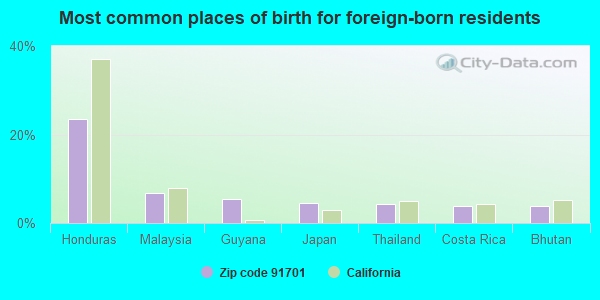
Foreign born population: 6,745 (17.3%) (73.6% of them are naturalized citizens)
This zip code:
17.3%
Whole state:
26.7%
23%Honduras
7%Malaysia
5%Guyana
5%Japan
4%Thailand
4%Costa Rica
4%Bhutan
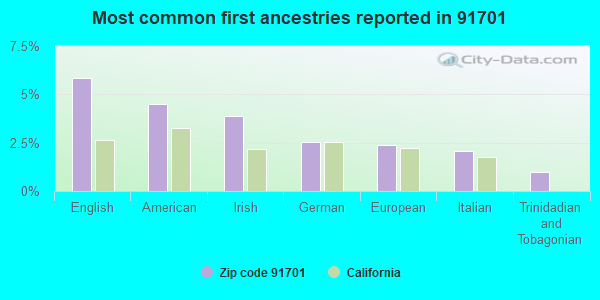
6%English
5%American
4%Irish
3%German
2%European
2%Italian
1%Trinidadian and Tobagonian
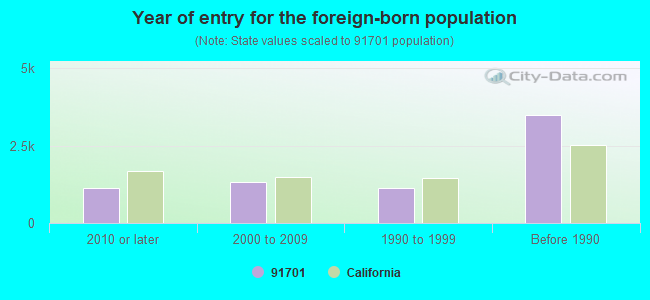
Year of entry for the foreign-born population
1,1472010 or later
1,3312000 to 2009
1,1431990 to 1999
3,493Before 1990
Major facilities with environmental interests located in this zip code:
ALTA LOMA JUNIOR HIGH SCHOOL (9000 LEMON AVE in ALTA LOMA, CA)
(Geographic Names Information System) (National Center for Education Statistics) - STATE ID-6035224 Organizations: ALTA LOMA ELEMENTARY (SCHOOL DISTRICT)
Alternative names: ALTA LOMA JR. HIGH
LONGS DRUGS STORE NO 273 (7207 HAVEN AVE in RANCHO CUCAMONGA, CA)
STATE MASTER (California - Hazardous Waste Tracking) - HAZARDOU WASTE PROGRAM Small Quantity Generators, between 100 kg and 1000 kg of hazardous waste/month (Resource Conservation and Recovery Act (tracking hazardous waste)) - notification Organizations: LONGS DRUG STORES CALIFORNIA INC (CONTACT/OWNER)
Alternative names: LONGS DRUGS #273
CHAFFEY JOINT UNION HIGH SCHOO (8880 BASELINE in ALTA LOMA, CA)
(National Center for Education Statistics) - STATE ID-3630225 CRITERIA AND HAZARDOUS AIR POLLUTANT INVENTORY (Inventory of air pollution sources) Business SIC classification: ELEMENTARY AND SECONDARY SCHOOLS
ALTA LOMA ELEMENTARY (7085 AMETHYST ST. in ALTA LOMA, CA)
(National Center for Education Statistics) - STATE ID-6035216
JASPER ELEMENTARY (6881 JASPER ST. in ALTA LOMA, CA)
(National Center for Education Statistics) - STATE ID-6094940 Organizations: ALTA LOMA ELEMENTARY (SCHOOL DISTRICT)
CARLETON P. LIGHTFOOT ELEMENTARY (6989 KENYON WAY in ALTA LOMA, CA)
(National Center for Education Statistics) - STATE ID-6112114 Organizations: ETIWANDA ELEMENTARY (SCHOOL DISTRICT)
CARNELIAN ELEMENTARY (7105 CARNELIAN ST. in ALTA LOMA, CA)
(National Center for Education Statistics) - STATE ID-6035232 Organizations: ALTA LOMA ELEMENTARY (SCHOOL DISTRICT)
EXXONMOBIL OIL CORP NO12009 (6539 MILLIKEN in RANCHO CUCAMONGA, CA)
HAZARDOUS WASTE BIENNIAL REPORTER (Resource Conservation and Recovery Act (tracking hazardous waste)) Large Quantity Generators, more that 1000 kg of hazardous waste/month (Resource Conservation and Recovery Act (tracking hazardous waste)) Organizations: EXXONMOBIL OIL CORPORATION (CONTACT/OPERATOR)
Alternative names: EXXON MOBIL OIL CORP
HOUSEHOLD HW COLLECTION CENTER (6625 AMETHYST in RANCHO CUCAMONGA, CA)
Small Quantity Generators, between 100 kg and 1000 kg of hazardous waste/month (Resource Conservation and Recovery Act (tracking hazardous waste)) - notification Organizations: SAN BERNARDINO CNTY (CONTACT/OWNER)
ETCH-CO INC (9426 ROBERDS ST in ALTA LOMA, CA)
Small Quantity Generators, between 100 kg and 1000 kg of hazardous waste/month (Resource Conservation and Recovery Act (tracking hazardous waste)) Business NAICS classification: OTHER ELECTRONIC COMPONENT MANUFACTURING.
JIM DANDY CLEANERS (6630 CARNELIAN ST in ALTA LOMA, CA)
Small Quantity Generators, between 100 kg and 1000 kg of hazardous waste/month (Resource Conservation and Recovery Act (tracking hazardous waste)) - notification Organizations: EMMANUEL BANZON (CONTACT/OWNER)
ETIWANDA POWER PLANT FACILITY (8248 ETIWANDA AVENUE in RANCHO CUCAMONGA, CA)
Small Quantity Generators, between 100 kg and 1000 kg of hazardous waste/month (Resource Conservation and Recovery Act (tracking hazardous waste))
LITTLE PEOPLE AND CO (P O BOX 485 in ALTA LOMA, CA)
COMPLIANCE ACTIVITY (Tracking inspections of insecticide, fungicide, and rodenticide, and toxic substances)
Housing units lacking complete plumbing facilities: 0.5% Housing units lacking complete kitchen facilities: 1.7%
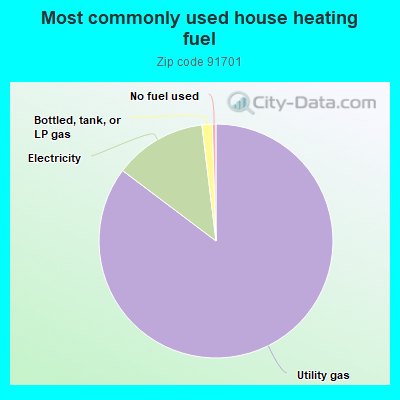
84.6%Utility gas
12.7%Electricity
1.4%Bottled, tank, or LP gas
0.5%No fuel used
Population in 1990: 31,633. Population change in the 1990s: +7,422 (+23.5%).
Place of birth for U.S.-born residents:
This state: 25,964
Northeast: 1,017
Midwest: 2,306
South: 1,537
West: 904
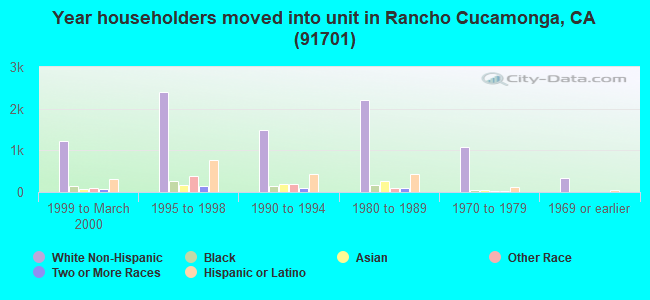
59% of the 91701 zip code residents lived in the same house 5 years ago. Out of people who lived in different houses, 67% lived in this county. Out of people who lived in different counties, 50% lived in California.
91% of the 91701 zip code residents lived in the same house 1 year ago. Out of people who lived in different houses, 63% moved from this county. Out of people who lived in different houses, 21% moved from different county within same state. Out of people who lived in different houses, 12% moved from different state. Out of people who lived in different houses, 4% moved from abroad.
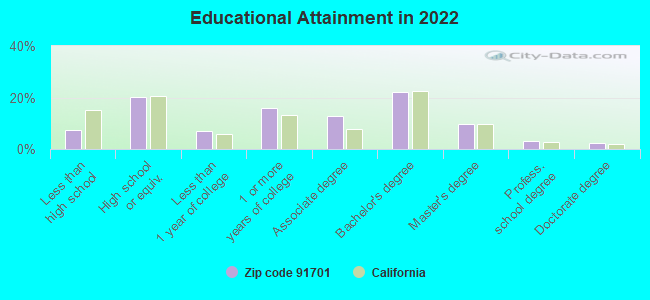
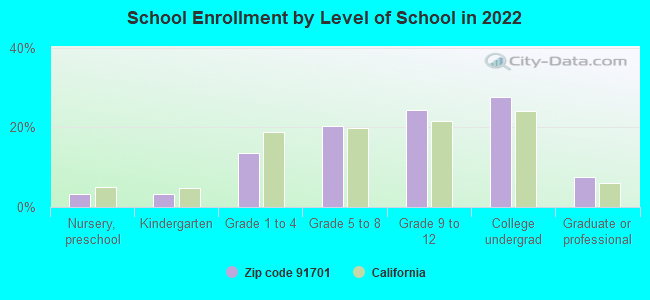
Private vs. public school enrollment:
Students in private schools in grades 1 to 8 (elementary and middle school): 176
Here:
5.5%
California:
10.5%
Students in private schools in grades 9 to 12 (high school): 146
Here:
6.3%
California:
8.5%
Students in private undergraduate colleges: 585
Here:
22.3%
California:
15.9%
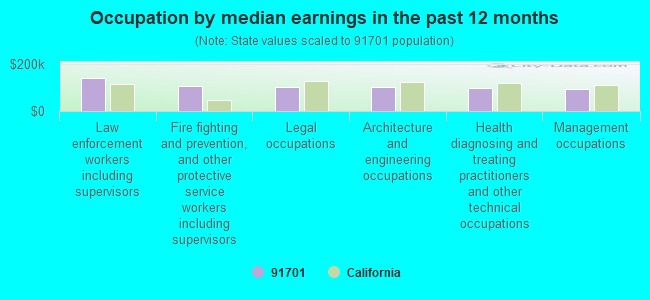
Occupation by median earnings in the past 12 months ($)
141,981Law enforcement workers including supervisors
107,130Fire fighting and prevention, and other protective service workers including supervisors
103,693Legal occupations
103,581Architecture and engineering occupations
96,272Health diagnosing and treating practitioners and other technical occupations
93,038Management occupations
Companies with federal contracts located in this zip code:
OLYMPUS TELEVISION, INC (9330 BASELINE ROAD in RANCHO CUCAMON, CA; small business) : $998,911 in 5 contractsfrom 2000 to 2004
Contracts for Miscellaneous Items by American Forces Information Service, Department of Defense Signed by year:2000: $111,375; 2001: $215,280; 2002: $219,648; 2003: $224,016; 2004: $228,592; 2005: $0; 2006: $0.
Biggest contracts:
$228,592 with American Forces Information Service for Miscellaneous Items. Signed on 2004-02-06. Completion date: 2005-01-05.
$224,016 with Department of Defense for Miscellaneous Items. Signed on 2003-01-14. Completion date: 2004-01-01.
$219,648, same as above.Signed on 2002-01-28. Completion date: 2003-02-01.
$215,280, same as above.Signed on 2001-01-04. Completion date: 2001-02-15.
PACIFIC FORTIS GROUP (7201 HAVEN AVE , STE 323 in ALTA LOMA, CA; small business) : $78,013 in 2 contractsfrom 2001 to 2002
$43,938 with Air Force for Radio and Television Communication Equipment, Except Airborne. Signed on 2001-09-07. Completion date: 2001-09-05.
$34,075 with Air Force for ADP Input/Output and Storage Devices. Signed on 2002-06-05. Completion date: 2002-06-06.
DOCUMENT IMAGING SUPPLY CO (6649 AMETHYST AVENUE in ALTA LOMA, CA; small business) : $15,615 in 4 contractsfrom 2004 to 2005
$4,750 with Army for ADP Support Equipment. Signed on 2005-09-02. Completion date: 2005-09-19.
$4,750 with U.S. Army Corps of Engineers - civil program financing only for ADP Support Equipment. Signed on 2005-09-02. Completion date: 2005-09-19.
$3,445 with Army for Printing, Duplicating, and Bookbinding Equipment. Signed on 2004-09-29. Completion date: 2004-10-29.
$2,670 with Consumer Product Safety Commission for Miscellaneous Office Machines. Taking place in MD. Signed on 2004-09-21. Effective on 2004-09-30. Completion date: 2004-09-30.
WILLIAMS, JOHN C (6847 PORTOFINO CT in RANCHO CUCAMON, CA; small business)
$1,258 with Army for Program Management/Support Services. Taking place in GA. Signed on 2002-10-31. Completion date: 2002-10-31.
Top industries in this zip code by the number of employees in 2005:
Administrative and Support and Waste Management and Remediation Services: Temporary Help Services (250-499 employees: 2 establishments, 1-4 employees: 1 establishment)
2005 - 2018 National Fire Incident Reporting System (NFIRS) incidents
Based on the data from the years 2005 - 2018 the average number of fire incidents per year is 34. The highest number of reported fires - 81 took place in 2010, and the least - 0 in 2007. The data has a rising trend.
When looking into fire subcategories, the most reports belonged to: Structure Fires (38.8%), and Outside Fires (37.5%).
Fire incident types reported to NFIRS in Zip Code 91701

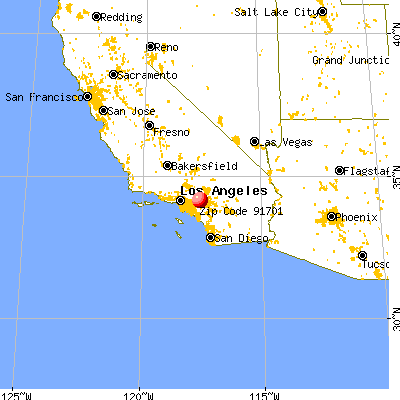


 Nearest zip codes: 91737, 91730, 91784, 91764, 91786, 91739.


 Based on the data from the years 2005 - 2018 the average number of fire incidents per year is 34. The highest number of reported fires - 81 took place in 2010, and the least - 0 in 2007. The data has a rising trend.
 When looking into fire subcategories, the most reports belonged to: Structure Fires (38.8%), and Outside Fires (37.5%).