Estimated zip code population in 2022: 34,051 Zip code population in 2010: 32,811 Zip code population in 2000: 32,509
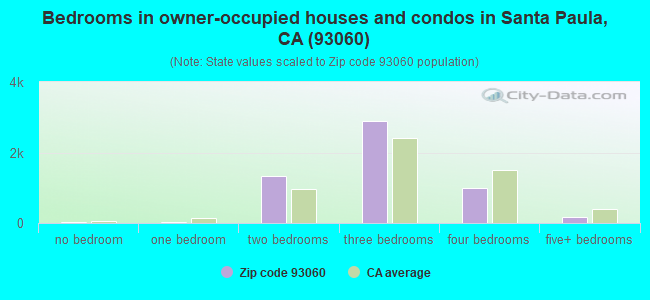
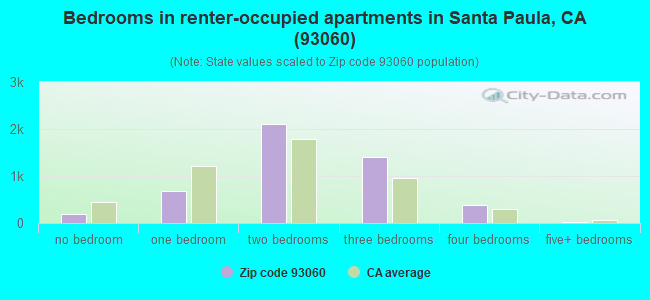
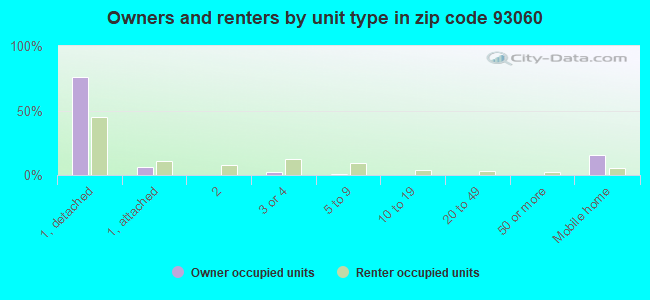
Houses and condos: 10,826 Renter-occupied apartments: 4,791
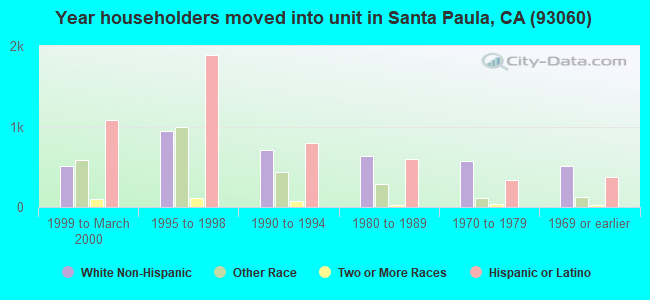
% of renters here:
47%
State:
44%
March 2022 cost of living index in zip code 93060: 92.5 (less than average, U.S. average is 100)
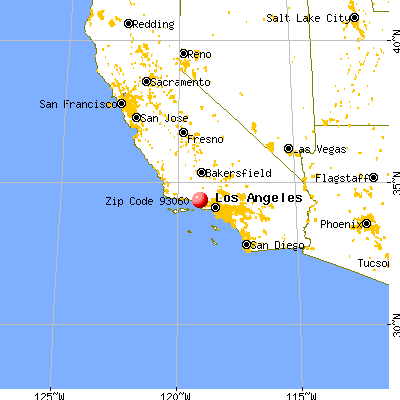
Land area: 119.0 sq. mi. Water area: 1.1 sq. mi.
Population density: 286 people per square mile
(very low).
OSM Map
General Map
Google Map
MSN Map
OSM Map
General Map
Google Map
MSN Map
OSM Map
General Map
Google Map
MSN Map
OSM Map
General Map
Google Map
MSN Map
Please wait while loading the map...
Real estate property taxes paid for housing units in 2022:
This zip code:
0.6% ($3,712)
California:
0.7% ($4,831)
Median real estate property taxes paid for housing units with mortgages in 2022: $4,493 (0.7%) Median real estate property taxes paid for housing units with no mortgage in 2022: $2,500 (0.5%)
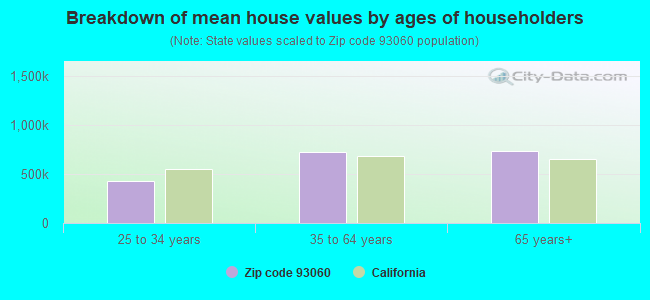
Estimated median house/condo value in 2022: $591,788
93060:
$591,788
California:
$715,900
According to our research of California and other state lists, there were 21 registered sex offenders living in 93060 zip code as of April 27, 2024. The ratio of all residents to sex offenders in zip code 93060 is 1,634 to 1. The ratio of registered sex offenders to all residents in this zip code is lower than the state average.
Median resident age:
This zip code:
35.6 years
California median age:
37.9 years
Average household size:
This zip code:
3.3 people
California:
2.8 people
Averages for the 2020 tax year for zip code 93060, filed in 2021:
Average Adjusted Gross Income (AGI) in 2020: $54,683 (Individual Income Tax Returns)
Here:
$54,683
State:
$95,910
Salary/wage: $46,999 (reported on 86.4% of returns)
Here:
$46,999
State:
$77,331
(% of AGI for various income ranges: 1564.9% for AGIs below $25k, 4651.1% for AGIs $25k-50k, 7792.7% for AGIs $50k-75k, 11319.2% for AGIs $75k-100k, 21151.0% for AGIs $100k-200k, 70450.0% for AGIs over 200k)
Taxable interest for individuals: $1,010 (reported on 24.1% of returns)
This zip code:
$1,010
California:
$2,294
(% of AGI for various income ranges: 6.9% for AGIs below $25k, 10.4% for AGIs $25k-50k, 25.1% for AGIs $50k-75k, 52.2% for AGIs $75k-100k, 106.3% for AGIs $100k-200k, 1841.1% for AGIs over 200k)
Ordinary dividends: $5,971 (reported on 8.6% of returns)
Here:
$5,971
State:
$10,949
(% of AGI for various income ranges: 13.8% for AGIs below $25k, 15.8% for AGIs $25k-50k, 41.3% for AGIs $50k-75k, 71.2% for AGIs $75k-100k, 239.6% for AGIs $100k-200k, 4585.6% for AGIs over 200k)
Net capital gain/loss in AGI: +$18,546 (reported on 8.3% of returns)
Here:
+$18,546
State:
+$49,306
(% of AGI for various income ranges: 6.1% for AGIs below $25k, 14.2% for AGIs $25k-50k, 27.2% for AGIs $50k-75k, 117.3% for AGIs $75k-100k, 499.6% for AGIs $100k-200k, 20591.1% for AGIs over 200k)
Profit/loss from business: +$11,200 (reported on 11.7% of returns)
Here:
+$11,200
State:
+$15,671
(% of AGI for various income ranges: 114.7% for AGIs below $25k, 123.5% for AGIs $25k-50k, 233.6% for AGIs $50k-75k, 225.8% for AGIs $75k-100k, 392.1% for AGIs $100k-200k, 5115.6% for AGIs over 200k)
Taxable individual retirement arrangement distribution: $20,084 (reported on 4.0% of returns)
93060:
$20,084
California:
$23,505
(% of AGI for various income ranges: 28.2% for AGIs below $25k, 26.5% for AGIs $25k-50k, 96.5% for AGIs $50k-75k, 214.7% for AGIs $75k-100k, 488.2% for AGIs $100k-200k, 4234.4% for AGIs over 200k)
Self-employed (Keogh) retirement plans: $14,367 (reported on 0.2% of returns)
93060:
$14,367
California:
$30,163
(% of AGI for various income ranges: 51.9% for AGIs $75k-100k)
Total itemized deductions: $30,326 (reported on 8.9% of returns)
Here:
$30,326
State:
$39,517
(% of AGI for various income ranges: 62.0% for AGIs below $25k, 113.5% for AGIs $25k-50k, 373.1% for AGIs $50k-75k, 821.9% for AGIs $75k-100k, 2191.5% for AGIs $100k-200k, 8228.9% for AGIs over 200k)
Charity contributions: $5,202 (reported on 7.2% of returns)
Here:
$5,202
State:
$12,598
(% of AGI for various income ranges: 3.2% for AGIs below $25k, 11.2% for AGIs $25k-50k, 34.5% for AGIs $50k-75k, 89.8% for AGIs $75k-100k, 333.6% for AGIs $100k-200k, 1758.9% for AGIs over 200k)
Taxes paid: $8,352 (reported on 8.9% of returns)
93060:
$8,352
State:
$8,807
(% of AGI for various income ranges: 10.1% for AGIs below $25k, 26.1% for AGIs $25k-50k, 97.6% for AGIs $50k-75k, 244.8% for AGIs $75k-100k, 650.3% for AGIs $100k-200k, 2216.7% for AGIs over 200k)
Earned income credit: $2,264 (reported on 17.5% of returns)
Here:
$2,264
State:
$2,074
(% of AGI for various income ranges: 104.8% for AGIs below $25k, 89.4% for AGIs $25k-50k, 2.0% for AGIs $50k-75k)
Percentage of individuals using paid preparers for their 2020 taxes: 94.2%
Here:
94%
State:
92%
(% for various income ranges: 92.7% for AGIs below $25k, 94.4% for AGIs $25k-50k, 95.5% for AGIs $50k-75k, 95.5% for AGIs $75k-100k, 95.0% for AGIs $100k-200k, 94.4% for AGIs over 200k)
Averages for the 2012 tax year for zip code 93060, filed in 2013:
Average Adjusted Gross Income (AGI) in 2012: $42,053 (Individual Income Tax Returns)
Here:
$42,053
State:
$72,726
Salary/wage: $36,076 (reported on 87.9% of returns)
Here:
$36,076
State:
$59,079
(% of AGI for various income ranges: 81.0% for AGIs below $25k, 84.8% for AGIs $25k-50k, 81.3% for AGIs $50k-75k, 78.5% for AGIs $75k-100k, 74.0% for AGIs $100k-200k, 43.1% for AGIs over 200k)
Taxable interest for individuals: $1,397 (reported on 23.5% of returns)
This zip code:
$1,397
California:
$2,146
(% of AGI for various income ranges: 0.5% for AGIs below $25k, 0.2% for AGIs $25k-50k, 0.5% for AGIs $50k-75k, 0.6% for AGIs $75k-100k, 0.6% for AGIs $100k-200k, 2.8% for AGIs over 200k)
Ordinary dividends: $5,933 (reported on 8.2% of returns)
Here:
$5,933
State:
$9,308
(% of AGI for various income ranges: 0.7% for AGIs below $25k, 0.3% for AGIs $25k-50k, 0.5% for AGIs $50k-75k, 0.8% for AGIs $75k-100k, 0.9% for AGIs $100k-200k, 4.8% for AGIs over 200k)
Net capital gain/loss in AGI: +$10,160 (reported on 6.5% of returns)
Here:
+$10,160
State:
+$30,460
(% of AGI for various income ranges: 0.1% for AGIs $25k-50k, 0.3% for AGIs $50k-75k, 0.3% for AGIs $75k-100k, 1.1% for AGIs $100k-200k, 9.7% for AGIs over 200k)
Profit/loss from business: +$12,146 (reported on 11.0% of returns)
Here:
+$12,146
State:
+$17,064
(% of AGI for various income ranges: 6.0% for AGIs below $25k, 2.5% for AGIs $25k-50k, 1.5% for AGIs $50k-75k, 2.3% for AGIs $75k-100k, 2.6% for AGIs $100k-200k, 4.9% for AGIs over 200k)
Taxable individual retirement arrangement distribution: $15,650 (reported on 4.8% of returns)
93060:
$15,650
California:
$19,557
(% of AGI for various income ranges: 0.8% for AGIs below $25k, 1.0% for AGIs $25k-50k, 1.6% for AGIs $50k-75k, 2.1% for AGIs $75k-100k, 2.7% for AGIs $100k-200k, 2.6% for AGIs over 200k)
Self-employment retirement plans: $13,250 (reported on 0.3% of returns)
93060:
$13,250
California:
$24,530
Total itemized deductions: $25,456 (28% of AGI, reported on 23.3% of returns)
Here:
$25,456
State:
$34,004
Here:
27.7% of AGI
State:
22.7% of AGI
(% of AGI for various income ranges: 6.1% for AGIs below $25k, 8.6% for AGIs $25k-50k, 15.2% for AGIs $50k-75k, 19.6% for AGIs $75k-100k, 20.4% for AGIs $100k-200k, 17.2% for AGIs over 200k)
Charity contributions: $2,887 (reported on 19.8% of returns)
Here:
$2,887
State:
$4,659
(% of AGI for various income ranges: 0.4% for AGIs below $25k, 0.7% for AGIs $25k-50k, 1.5% for AGIs $50k-75k, 1.8% for AGIs $75k-100k, 2.3% for AGIs $100k-200k, 1.5% for AGIs over 200k)
Taxes paid: $7,882 (reported on 22.9% of returns)
93060:
$7,882
State:
$14,448
(% of AGI for various income ranges: 1.1% for AGIs below $25k, 1.7% for AGIs $25k-50k, 3.9% for AGIs $50k-75k, 5.2% for AGIs $75k-100k, 6.7% for AGIs $100k-200k, 8.9% for AGIs over 200k)
Earned income credit: $2,311 (reported on 24.2% of returns)
Here:
$2,311
State:
$2,286
(% of AGI for various income ranges: 6.3% for AGIs below $25k, 1.7% for AGIs $25k-50k)
Percentage of individuals using paid preparers for their 2012 taxes: 68.8%
Here:
69%
State:
64%
(% for various income ranges: 61.8% for AGIs below $25k, 73.4% for AGIs $25k-50k, 76.2% for AGIs $50k-75k, 75.0% for AGIs $75k-100k, 75.3% for AGIs $100k-200k, 88.9% for AGIs over 200k)
Averages for the 2004 tax year for zip code 93060, filed in 2005:
Average Adjusted Gross Income (AGI) in 2004: $37,959 (Individual Income Tax Returns)
Here:
$37,959
State:
$58,600
Salary/wage: $33,523 (reported on 86.7% of returns)
Here:
$33,523
State:
$49,455
(% of AGI for various income ranges: 125.8% for AGIs below $10k, 82.5% for AGIs $10k-25k, 85.4% for AGIs $25k-50k, 82.4% for AGIs $50k-75k, 83.7% for AGIs $75k-100k, 53.6% for AGIs over 100k)
Taxable interest for individuals: $1,400 (reported on 34.6% of returns)
This zip code:
$1,400
California:
$2,365
(% of AGI for various income ranges: 4.8% for AGIs below $10k, 1.1% for AGIs $10k-25k, 0.9% for AGIs $25k-50k, 1.1% for AGIs $50k-75k, 1.0% for AGIs $75k-100k, 1.9% for AGIs over 100k)
Taxable dividends: $3,256 (reported on 12.5% of returns)
Here:
$3,256
State:
$4,746
(% of AGI for various income ranges: 3.3% for AGIs below $10k, 0.6% for AGIs $10k-25k, 0.5% for AGIs $25k-50k, 0.5% for AGIs $50k-75k, 0.7% for AGIs $75k-100k, 2.4% for AGIs over 100k)
Net capital gain/loss: +$14,557 (reported on 9.9% of returns)
Here:
+$14,557
State:
+$23,418
(% of AGI for various income ranges: 0.1% for AGIs below $10k, 0.0% for AGIs $10k-25k, 0.2% for AGIs $25k-50k, 0.4% for AGIs $50k-75k, 1.1% for AGIs $75k-100k, 13.6% for AGIs over 100k)
Profit/loss from business: +$12,216 (reported on 12.4% of returns)
Here:
+$12,216
State:
+$16,826
(% of AGI for various income ranges: 8.4% for AGIs below $10k, 4.3% for AGIs $10k-25k, 2.8% for AGIs $25k-50k, 3.6% for AGIs $50k-75k, 2.5% for AGIs $75k-100k, 5.8% for AGIs over 100k)
IRA payment deduction: $2,961 (reported on 1.7% of returns)
93060:
$2,961
California:
$3,192
(% of AGI for various income ranges: 0.1% for AGIs $10k-25k, 0.1% for AGIs $25k-50k, 0.2% for AGIs $50k-75k, 0.2% for AGIs $75k-100k, 0.1% for AGIs over 100k)
Self-employed pension: $10,657 (reported on 0.6% of returns)
Here:
$10,657
California:
$17,688
Total itemized deductions: $21,968 (30% of AGI, reported on 29.5% of returns)
Here:
$21,968
State:
$28,113
Here:
29.9% of AGI
State:
25.3% of AGI
(% of AGI for various income ranges: 15.8% for AGIs below $10k, 7.2% for AGIs $10k-25k, 15.1% for AGIs $25k-50k, 20.7% for AGIs $50k-75k, 22.8% for AGIs $75k-100k, 19.1% for AGIs over 100k)
Charity contributions deductions: $2,618 (3% of AGI, reported on 26.5% of returns)
Here:
$2,618
State:
$3,923
Here:
3.4% of AGI
State:
3.3% of AGI
(% of AGI for various income ranges: 0.7% for AGIs below $10k, 0.5% for AGIs $10k-25k, 1.4% for AGIs $25k-50k, 2.0% for AGIs $50k-75k, 2.4% for AGIs $75k-100k, 2.7% for AGIs over 100k)
Total tax: $5,195 (reported on 62.9% of returns)
93060:
$5,195
State:
$10,761
(% of AGI for various income ranges: 3.9% for AGIs below $10k, 2.8% for AGIs $10k-25k, 4.7% for AGIs $25k-50k, 7.3% for AGIs $50k-75k, 8.9% for AGIs $75k-100k, 16.9% for AGIs over 100k)
Earned income credit: $1,863 (reported on 22.9% of returns)
Here:
$1,863
State:
$1,763
Percentage of individuals using paid preparers for their 2004 taxes: 77.7%
Here:
78%
State:
66%
(% for various income ranges: 69.1% for AGIs below $10k, 81.1% for AGIs $10k-25k, 78.8% for AGIs $25k-50k, 78.2% for AGIs $50k-75k, 73.8% for AGIs $75k-100k, 83.1% for AGIs over 100k)
Likely homosexual households (counted as self-reported same-sex unmarried-partner households)
Lesbian couples: 0.0% of all households
Gay men: 0.1% of all households
Household received Food Stamps/SNAP in the past 12 months: 1,896 Household did not receive Food Stamps/SNAP in the past 12 months: 8,509
Women who had a birth in the past 12 months: 673 (428 now married, 245 unmarried) Women who did not have a birth in the past 12 months: 7,579 (2,903 now married, 4,680 unmarried)
Housing units in zip code 93060 with a mortgage: 3,216 (164 second mortgage, 61 home equity loan, 45 both second mortgage and home equity loan) Houses without a mortgage: 90
Median monthly owner costs for units with a mortgage: $2,403 Median monthly owner costs for units without a mortgage: $658
Residents with income below the poverty level in 2022:
This zip code:
15.9%
Whole state:
12.2%
Residents with income below 50% of the poverty level in 2022:
This zip code:
8.7%
Whole state:
6.2%
Median number of rooms in houses and condos:
Here:
5.8
State:
6.0
Median number of rooms in apartments:
Here:
4.3
State:
3.9
Notable locations in this zip code not listed on our city pages
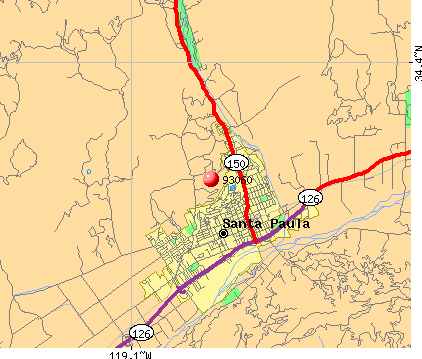
Notable locations in zip code 93060: Mountain View Golf Course (A), Santa Paula-Fillmore County Saintary Landfill (B), Ferndale Ranch (C), The Pines Camp Ground (D), Gridley Springs Camp (E), The Pine Campground (F), Stuart Canyon Picnic Ground (G), White Ledge Campground (H), Santa Paula City Hall (I), California Oil Museum (J), Blanchard Community Library (K), Ventura County Fire Protection District Station 26 Saticoy (L), Ventura County Fire Protection District Station 20 Summit (M), City of Santa Paula Fire Department Station 2 (N), City of Santa Paula Fire Department Station 81 (O). Display/hide their locations on the map
Churches in zip code 93060 include: Asamblea Apostolica (A), Bethel Baptist Church (B), Chapel of Praise Church of God (C), Church of Christ (D), The Church of Jesus Christ of Latter Day Saints (E), Church of the Nazarene (F), Citrus Valley Christian Center (G), First Baptist Church (H), First Christian Church (I). Display/hide their locations on the map
Parks in zip code 93060 include: Harding Park (1), Las Piedras Park (2), Veterans Memorial Park (3), Obregon Park (4), Ebell Park (5), Mill Park (6), Steckel Park (7). Display/hide their locations on the map
4,947 married couples with children.
2,583 single-parent households (553 men, 2,030 women).
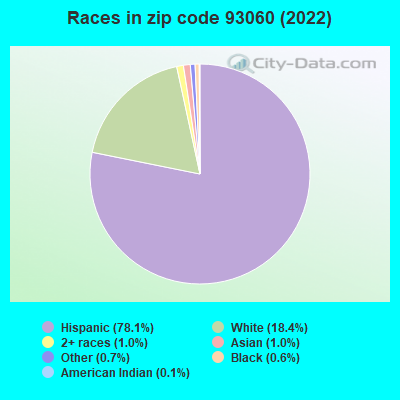
37.0% of residents of 93060 zip code speak English at home.
61.3% of residents speak Spanish at home (54% very well, 15% well, 17% not well, 13% not at all).
0.5% of residents speak other Indo-European language at home (60% very well, 34% well, 6% not well).
0.9% of residents speak Asian or Pacific Island language at home (54% very well, 36% well, 4% not well, 6% not at all).
0.1% of residents speak other language at home (100% not well).
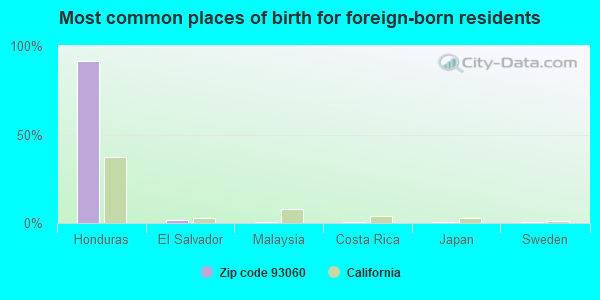
Foreign born population: 9,855 (28.9%) (34.5% of them are naturalized citizens)
This zip code:
28.9%
Whole state:
26.7%
92%Honduras
2%El Salvador
1%Malaysia
1%Costa Rica
0%Japan
0%Sweden
0%Grenada
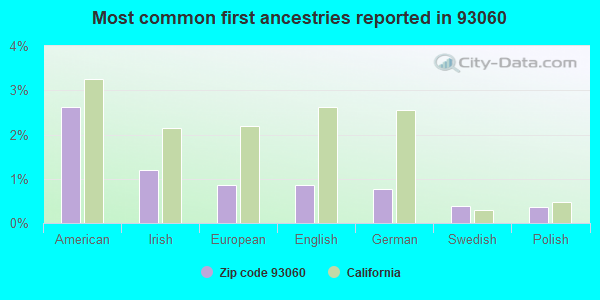
3%American
1%Irish
1%European
1%English
1%German
0%Swedish
0%Polish
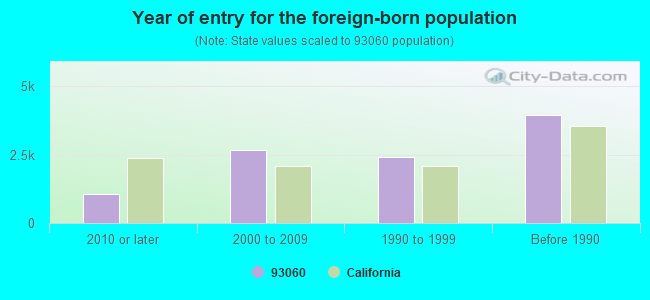
Year of entry for the foreign-born population
1,0422010 or later
2,6752000 to 2009
2,4191990 to 1999
3,944Before 1990
Major facilities with environmental interests located in this zip code:
M AND H REALTY (584 W MAIN ST in SANTA PAULA, CA)
STATE MASTER (California - Hazardous Waste Tracking) - HAZARDOU WASTE PROGRAM Large Quantity Generators, more that 1000 kg of hazardous waste/month (Resource Conservation and Recovery Act (tracking hazardous waste)) - notification Organizations: M AND H PARTNERS I I I L P (CONTACT/OWNER)
HARRYS CAR CARE INC (850 CORPORATION ST in SANTA PAULA, CA)
Small Quantity Generators, between 100 kg and 1000 kg of hazardous waste/month (Resource Conservation and Recovery Act (tracking hazardous waste)) STATE MASTER (California - Used Oil Recycling System ) - USED OIL RECYCLING Organizations: HARRY L K MALETTE (CONTACT/OWNER)
Alternative names: HARRY S CAR CARE
HAZ MED INC (245 QUAIL CT in SANTA PAULA, CA)
STATE MASTER (California - Hazardous Waste Tracking) - HAZARDOU WASTE PROGRAM TRANSPORTER (Resource Conservation and Recovery Act (tracking hazardous waste)) Organizations: JAMES SCHLEIMER (CONTACT/OWNER)
JAMES E CLARK II CORPORATION (18115 EAST TELEGRAPH ROAD in SANTA PAULA, CA)
CRITERIA AND HAZARDOUS AIR POLLUTANT INVENTORY (Inventory of air pollution sources) (Resource Conservation and Recovery Act (tracking hazardous waste)) Conditionally Exempt Small Quantity Generators, less than 100 kg/month of hazardous waste (Resource Conservation and Recovery Act (tracking hazardous waste)) - notification TRANSPORTER (Resource Conservation and Recovery Act (tracking hazardous waste)) - notification Business SIC classification: GASOLINE SERVICE STATIONS Organizations: THOMAS M SAWYER (CONTACT/OWNER)
, JE CLARK II PRES (CONTACT/OWNER)
Alternative names: J E CLARK II CORP, THOMAS SAWYER DBA CLARK OIL
CHEVRON STATION NO 99712 (566 W MAIN ST in SANTA PAULA, CA)
STATE MASTER (California - Hazardous Waste Tracking) - HAZARDOU WASTE PROGRAM CRITERIA AND HAZARDOUS AIR POLLUTANT INVENTORY (Inventory of air pollution sources) Small Quantity Generators, between 100 kg and 1000 kg of hazardous waste/month (Resource Conservation and Recovery Act (tracking hazardous waste)) - notification Business SIC classification: GASOLINE SERVICE STATIONS Organizations: CHEVRON PRODUCTS CO (CONTACT/OWNER)
HELIPOWER SVC (15500 TELEGRAPH RD C21 in SANTA PAULA, CA)
STATE MASTER (California - Hazardous Waste Tracking) - HAZARDOU WASTE PROGRAM Small Quantity Generators, between 100 kg and 1000 kg of hazardous waste/month (Resource Conservation and Recovery Act (tracking hazardous waste)) - notification Organizations: CALIFORNIA TURBINE SVC INC (CONTACT/OWNER)
LINDSEY EXCAVATING AND GRADING (1775 LEMONWOOD DR in SANTA PAULA, CA)
STATE MASTER (California - Hazardous Waste Tracking) - HAZARDOU WASTE PROGRAM TRANSPORTER (Resource Conservation and Recovery Act (tracking hazardous waste)) - notification Organizations: LUANA DUNE LINDSEY (CONTACT/OWNER)
ISBELL MIDDLE (221 S. FOURTH ST. in SANTA PAULA, CA)
(National Center for Education Statistics) - STATE ID-6055594 Organizations: SANTA PAULA ELEMENTARY (SCHOOL DISTRICT)
MUPU ELEMENTARY (4410 N. OJAI ROAD in SANTA PAULA, CA)
(National Center for Education Statistics) - STATE ID-6055156
GLEN CITY ELEMENTARY (141 STECKEL DR. in SANTA PAULA, CA)
(National Center for Education Statistics) - STATE ID-6055578 Organizations: SANTA PAULA ELEMENTARY (SCHOOL DISTRICT)
MCKEVETT ELEMENTARY (955 PLEASANT ST. in SANTA PAULA, CA)
(National Center for Education Statistics) - STATE ID-6055602 Organizations: SANTA PAULA ELEMENTARY (SCHOOL DISTRICT)
ANADIME ENERGY SERVICES, INC. (947 1/2 E MAIN ST in SANTA PAULA, CA)
(Integrated Compliance Information System) - ICIS-09-2001-0111, FORMAL ENFORCEMENT ACTION Business SIC classification: OIL AND GAS FIELD SERVICES
M & J AUTO BODY (142 N 11TH ST in SANTA PAULA, CA)
CRITERIA AND HAZARDOUS AIR POLLUTANT INVENTORY (Inventory of air pollution sources) (Resource Conservation and Recovery Act (tracking hazardous waste)) Business SIC classification: TOP, BODY, AND UPHOLSTERY REPAIR SHOPS AND PAINT SHOPS Organizations: M BRIDGE & J SALLIMOR (CONTACT/OWNER)
Housing units lacking complete plumbing facilities: 0.2% Housing units lacking complete kitchen facilities: 1.1%
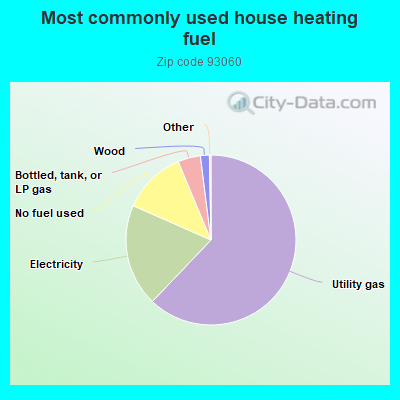
62.2%Utility gas
19.5%Electricity
12.1%No fuel used
4.3%Bottled, tank, or LP gas
1.7%Wood
Population in 1990: 28,319. Population change in the 1990s: +4,190 (+14.8%).
Place of birth for U.S.-born residents:
This state: 21,104
Northeast: 333
Midwest: 704
South: 861
West: 811
56% of the 93060 zip code residents lived in the same house 5 years ago. Out of people who lived in different houses, 77% lived in this county. Out of people who lived in different counties, 50% lived in California.
95% of the 93060 zip code residents lived in the same house 1 year ago. Out of people who lived in different houses, 74% moved from this county. Out of people who lived in different houses, 18% moved from different county within same state. Out of people who lived in different houses, 6% moved from different state. Out of people who lived in different houses, 6% moved from abroad.
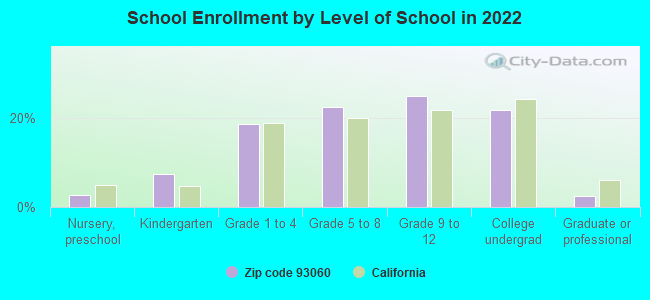
Private vs. public school enrollment:
Students in private schools in grades 1 to 8 (elementary and middle school): 333
Here:
8.6%
California:
10.5%
Students in private schools in grades 9 to 12 (high school): 199
Here:
8.4%
California:
8.5%
Students in private undergraduate colleges: 329
Here:
15.9%
California:
15.9%
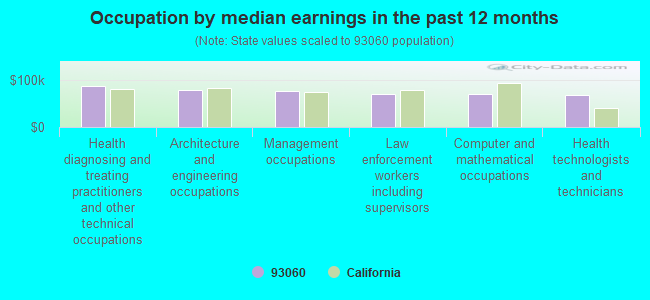
Occupation by median earnings in the past 12 months ($)
85,921Health diagnosing and treating practitioners and other technical occupations
77,057Architecture and engineering occupations
74,951Management occupations
70,135Law enforcement workers including supervisors
69,008Computer and mathematical occupations
68,188Health technologists and technicians
Companies with biggest federal contracts located in this zip code (SANTA PAULA, CA):
MARTA SYSTEMS INC (15500 W TELG RD STE A5; small business) : $945,820 in 32 contractsfrom 1999 to 2006
Contracts for ADP Support Equipment, ADP Systems Analysis Services, ADPE System Configuration, Miscellaneous Communication Equipment, and moreby Federal Technology Service, Navy, U.S. Army Corps of Engineers - civil program financing only, Army, and others Signed by year:2000: $479,300; 2001: $183,773; 2002: $3,275; 2003: $7,160; 2004: $50,725; 2005: $148,803; 2006: $11,784.
Biggest contracts:
$145,000 with Federal Technology Service for ADP Support Equipment. Signed on 2000-05-15. Completion date: 2000-06-15.
$121,000, same as above.Signed on 1999-11-15. Completion date: 1999-12-15.
$105,000, same as above.Signed on 2000-01-15. Completion date: 2000-02-15.
$87,000, same as above.Signed on 2000-07-15. Completion date: 2000-07-15.
TASK RESEARCH INCORPORATED (848 E SANTA MARIA ST; small business) : $531,552 in 2 contractsin 2003
$524,888 with Army for Aircraft Maintenance and Repair Shop Specialized Equipment. Taking place in OK. Signed on 2003-05-13. Completion date: 2003-08-30.
$6,664 with Army for Compressors and Vacuum Pumps. Taking place in OK. Signed on 2003-05-15. Completion date: 2003-08-30.
RAPID PROTOTYPES, LLC (15500 W TELEGRAPH RD STE B; small business) : $371,537 in 8 contractsfrom 2003 to 2006
Contracts for Electrical and Electronic assemblies, Boards, Cards, and Associated Hardware, Miscellaneous Electrical and Electronic Components, Launchers, Guided Missile, Specialized Semiconductor, Microcircuit, and Printed Circuit Board Manufacturing Machinery, and moreby Navy Signed by year:2000: $0; 2001: $0; 2002: $0; 2003: $191,366; 2004: $76,674; 2005: $86,497; 2006: $17,000.
Biggest contracts:
$96,604 with Navy for Electrical and Electronic assemblies, Boards, Cards, and Associated Hardware. Signed on 2003-09-23. Completion date: 2003-10-16.
$94,762 with Navy for Miscellaneous Electrical and Electronic Components. Signed on 2003-09-05. Completion date: 2003-09-19.
$76,674 with Navy for Launchers, Guided Missile. Signed on 2004-09-29. Completion date: 2004-11-12.
$53,457 with Navy for Electrical and Electronic assemblies, Boards, Cards, and Associated Hardware. Signed on 2005-08-31. Completion date: 2005-09-30.
FGL ENVIRONMENTAL (853 CORPORATION STREET; small business) : $331,958 in 83 contractsfrom 2000 to 2006
Contracts for Other Special Studies and Analyses, Hazardous Substance Analysis, Chemical and Pharmaceutical Products Manufacturing Machinery, Engineering and Technical Services, and moreby Navy, Army, U.S. Army Corps of Engineers - civil program financing only, National Park Service, and others Signed by year:2000: $34,848; 2001: $97,244; 2002: $71,017; 2003: $20,397; 2004: $80,316; 2005: $27,916; 2006: $220.
Biggest contracts:
$63,040 with Navy for Other Special Studies and Analyses. Signed on 2001-03-01. Completion date: 2001-09-30.
$34,848 with Navy for Hazardous Substance Analysis. Signed on 2000-09-21. Completion date: 2001-10-31.
$31,947 with Navy for Chemical and Pharmaceutical Products Manufacturing Machinery. Signed on 2004-05-11. Completion date: 2003-05-31.
$30,449, same as above.Signed on 2003-05-19. Completion date: 2003-05-31.
INTERNATIONAL ENGINE PARTS INC (111 NORTH MILL STREET; small business) : $100,455 in 7 contractsfrom 2002 to 2005
Contracts for Engine Fuel System Components, Aircraft and Missile Prime Movers, Airframe Structural Components, Miscellaneous Aircraft Accessories and Components, Miscellaneous Engine Accessories, Aircraft, and moreby Defense Logistics Agency, Navy, Air Force Signed by year:2000: $0; 2001: $0; 2002: $30,900; 2003: $0; 2004: $36,030; 2005: $33,525; 2006: $0.
Biggest contracts:
$31,500 with Defense Logistics Agency for Engine Fuel System Components, Aircraft and Missile Prime Movers. Signed on 2004-07-02. Completion date: 2004-08-01.
$30,900 with Defense Logistics Agency for Airframe Structural Components. Signed on 2002-06-21. Completion date: 2002-07-06.
$25,200 with Defense Logistics Agency for Miscellaneous Aircraft Accessories and Components. Signed on 2005-06-24. Completion date: 2005-10-22.
$4,530 with Navy for Miscellaneous Aircraft Accessories and Components. Signed on 2004-11-01. Completion date: 2004-11-05.
INNOVATIVE ENVIRONMENTAL SOLUT (18201 TELEGRAPH ROAD; small business)
$73,096 with Army for Other Environmental Services, Studies, and Analytical Support. Taking place in AZ. Signed on 2000-02-29. Completion date: 2001-04-30.
WESTERN ROTORCRAFT INC (667 SOUTHWICK ST; small business) 50 employees, $0 revenue.
$71,100 with Defense Logistics Agency for Engine Fuel System Components, Aircraft and Missile Prime Movers. Signed on 2001-11-09. Completion date: 2001-12-24.
WESTERN OILFIELDS SUPPLY CO (333 S 12TH ST) : $32,746 in 2 contractsfrom 2000 to 2006
$27,009 with Air Force for Maintenance, Repair and Rebuilding of Equipment -- Plumbing, Heating, and Waste Disposal Equipment. Signed on 2000-12-11. Completion date: 2001-01-12.
$5,737 with Army for Lease or Rental of Equipment -- Agricultural Machinery and Equipment. Signed on 2006-02-21. Completion date: 2006-03-19.
ABRISA INDUSTRIAL GLASS INC (200 HALLOCK DR; small business)
$26,212 with Air Force for Glass Fabricated Materials. Signed on 2005-07-06. Completion date: 2005-08-17.
LIBERTY SYSTEMS (585 RIDGECREST DR; small business)
$24,990 with Navy for Other Education and Training Services. Signed on 2005-06-17. Completion date: 2005-08-30.
Top industries in this zip code by the number of employees in 2005:
2005 - 2018 National Fire Incident Reporting System (NFIRS) incidents
Based on the data from the years 2005 - 2018 the average number of fires per year is 69. The highest number of fire incidents - 124 took place in 2016, and the least - 36 in 2012. The data has a growing trend.
When looking into fire subcategories, the most reports belonged to: Outside Fires (38.5%), and Structure Fires (30.9%).
Fire incident types reported to NFIRS in Zip Code 93060


 Nearest zip codes: 93066, 93004, 93003, 93010, 93036, 93015.


 Based on the data from the years 2005 - 2018 the average number of fires per year is 69. The highest number of fire incidents - 124 took place in 2016, and the least - 36 in 2012. The data has a growing trend.
 When looking into fire subcategories, the most reports belonged to: Outside Fires (38.5%), and Structure Fires (30.9%).