Estimated zip code population in 2022: 18,560 Zip code population in 2010: 17,334 Zip code population in 2000: 15,999
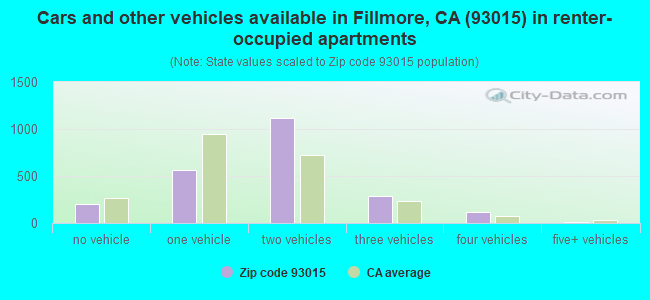
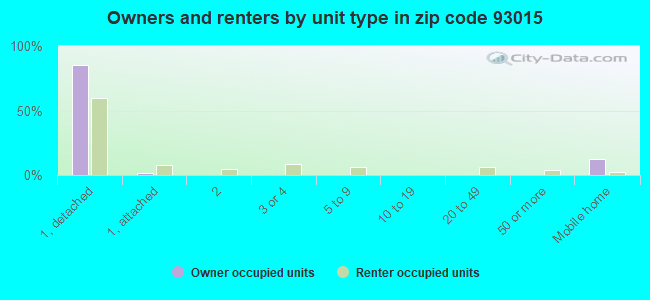
Houses and condos: 6,096 Renter-occupied apartments: 2,303
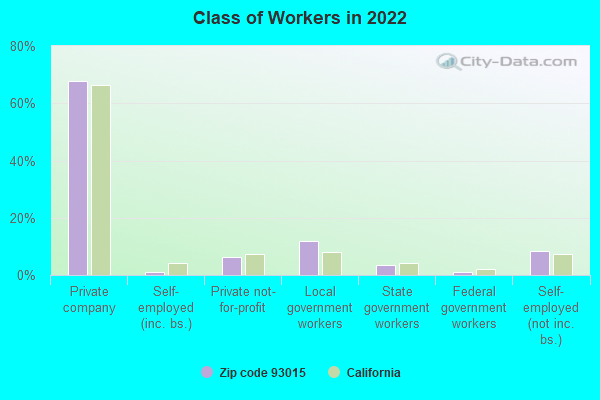
% of renters here:
40%
State:
44%
March 2022 cost of living index in zip code 93015: 92.0 (less than average, U.S. average is 100)
Land area: 76.6 sq. mi. Water area: 0.5 sq. mi.
Population density: 242 people per square mile
(very low).
OSM Map
General Map
Google Map
MSN Map
OSM Map
General Map
Google Map
MSN Map
OSM Map
General Map
Google Map
MSN Map
OSM Map
General Map
Google Map
MSN Map
Please wait while loading the map...
Real estate property taxes paid for housing units in 2022:
This zip code:
0.6% ($3,520)
California:
0.7% ($4,831)
Median real estate property taxes paid for housing units with mortgages in 2022: $3,942 (0.7%) Median real estate property taxes paid for housing units with no mortgage in 2022: $2,082 (0.3%)
Estimated median house/condo value in 2022: $570,722
93015:
$570,722
California:
$715,900
According to our research of California and other state lists, there were 26 registered sex offenders living in 93015 zip code as of April 27, 2024. The ratio of all residents to sex offenders in zip code 93015 is 682 to 1. The ratio of registered sex offenders to all residents in this zip code is near the state average.
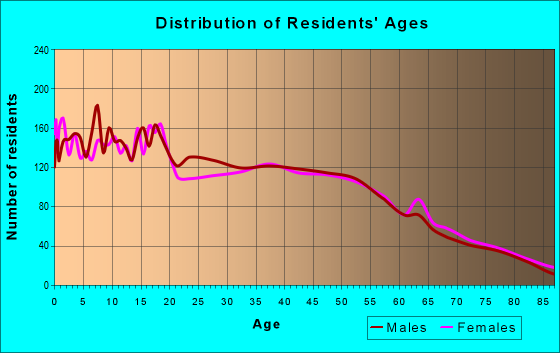
Median resident age:
This zip code:
35.4 years
California median age:
37.9 years
Average household size:
This zip code:
3.2 people
California:
2.8 people
Averages for the 2020 tax year for zip code 93015, filed in 2021:
Average Adjusted Gross Income (AGI) in 2020: $59,090 (Individual Income Tax Returns)
Here:
$59,090
State:
$95,910
Salary/wage: $53,271 (reported on 87.1% of returns)
Here:
$53,271
State:
$77,331
(% of AGI for various income ranges: 1512.6% for AGIs below $25k, 4380.6% for AGIs $25k-50k, 7872.9% for AGIs $50k-75k, 11144.0% for AGIs $75k-100k, 21124.9% for AGIs $100k-200k, 62170.0% for AGIs over 200k)
Taxable interest for individuals: $423 (reported on 27.6% of returns)
This zip code:
$423
California:
$2,294
(% of AGI for various income ranges: 7.7% for AGIs below $25k, 6.7% for AGIs $25k-50k, 14.2% for AGIs $50k-75k, 18.1% for AGIs $75k-100k, 51.5% for AGIs $100k-200k, 307.5% for AGIs over 200k)
Ordinary dividends: $2,867 (reported on 8.1% of returns)
Here:
$2,867
State:
$10,949
(% of AGI for various income ranges: 11.1% for AGIs below $25k, 9.1% for AGIs $25k-50k, 43.8% for AGIs $50k-75k, 61.5% for AGIs $75k-100k, 76.3% for AGIs $100k-200k, 645.0% for AGIs over 200k)
Net capital gain/loss in AGI: +$13,127 (reported on 8.2% of returns)
Here:
+$13,127
State:
+$49,306
(% of AGI for various income ranges: 1.8% for AGIs below $25k, 6.4% for AGIs $25k-50k, 34.6% for AGIs $50k-75k, 74.0% for AGIs $75k-100k, 269.3% for AGIs $100k-200k, 8637.5% for AGIs over 200k)
Profit/loss from business: +$10,686 (reported on 12.8% of returns)
Here:
+$10,686
State:
+$15,671
(% of AGI for various income ranges: 117.9% for AGIs below $25k, 105.3% for AGIs $25k-50k, 226.9% for AGIs $50k-75k, 276.5% for AGIs $75k-100k, 502.4% for AGIs $100k-200k, 2066.2% for AGIs over 200k)
Taxable individual retirement arrangement distribution: $18,064 (reported on 3.8% of returns)
93015:
$18,064
California:
$23,505
(% of AGI for various income ranges: 26.5% for AGIs below $25k, 26.9% for AGIs $25k-50k, 110.8% for AGIs $50k-75k, 175.6% for AGIs $75k-100k, 539.2% for AGIs $100k-200k)
Self-employed (Keogh) retirement plans: $25,700 (reported on 0.2% of returns)
93015:
$25,700
California:
$30,163
(% of AGI for various income ranges: 98.8% for AGIs $75k-100k)
Total itemized deductions: $31,280 (reported on 12.9% of returns)
Here:
$31,280
State:
$39,517
(% of AGI for various income ranges: 58.8% for AGIs below $25k, 171.3% for AGIs $25k-50k, 536.2% for AGIs $50k-75k, 1080.0% for AGIs $75k-100k, 2213.7% for AGIs $100k-200k, 9727.5% for AGIs over 200k)
Charity contributions: $4,864 (reported on 10.5% of returns)
Here:
$4,864
State:
$12,598
(% of AGI for various income ranges: 2.4% for AGIs below $25k, 18.8% for AGIs $25k-50k, 48.6% for AGIs $50k-75k, 115.8% for AGIs $75k-100k, 260.7% for AGIs $100k-200k, 1876.2% for AGIs over 200k)
Taxes paid: $8,588 (reported on 13.0% of returns)
93015:
$8,588
State:
$8,807
(% of AGI for various income ranges: 15.8% for AGIs below $25k, 43.5% for AGIs $25k-50k, 162.0% for AGIs $50k-75k, 333.5% for AGIs $75k-100k, 696.8% for AGIs $100k-200k, 1812.5% for AGIs over 200k)
Earned income credit: $2,159 (reported on 16.9% of returns)
Here:
$2,159
State:
$2,074
(% of AGI for various income ranges: 98.4% for AGIs below $25k, 83.3% for AGIs $25k-50k)
Percentage of individuals using paid preparers for their 2020 taxes: 93.5%
Here:
94%
State:
92%
(% for various income ranges: 92.8% for AGIs below $25k, 93.8% for AGIs $25k-50k, 93.0% for AGIs $50k-75k, 93.8% for AGIs $75k-100k, 94.7% for AGIs $100k-200k, 96.2% for AGIs over 200k)
Averages for the 2012 tax year for zip code 93015, filed in 2013:
Average Adjusted Gross Income (AGI) in 2012: $45,846 (Individual Income Tax Returns)
Here:
$45,846
State:
$72,726
Salary/wage: $41,441 (reported on 88.2% of returns)
Here:
$41,441
State:
$59,079
(% of AGI for various income ranges: 81.2% for AGIs below $25k, 85.1% for AGIs $25k-50k, 80.4% for AGIs $50k-75k, 80.4% for AGIs $75k-100k, 82.0% for AGIs $100k-200k, 53.9% for AGIs over 200k)
Taxable interest for individuals: $649 (reported on 25.5% of returns)
This zip code:
$649
California:
$2,146
(% of AGI for various income ranges: 0.4% for AGIs below $25k, 0.3% for AGIs $25k-50k, 0.6% for AGIs $50k-75k, 0.3% for AGIs $75k-100k, 0.3% for AGIs $100k-200k, 0.2% for AGIs over 200k)
Ordinary dividends: $2,868 (reported on 8.3% of returns)
Here:
$2,868
State:
$9,308
(% of AGI for various income ranges: 0.5% for AGIs below $25k, 0.5% for AGIs $25k-50k, 0.4% for AGIs $50k-75k, 0.5% for AGIs $75k-100k, 0.6% for AGIs $100k-200k, 0.8% for AGIs over 200k)
Net capital gain/loss in AGI: +$1,442 (reported on 7.1% of returns)
Here:
+$1,442
State:
+$30,460
(% of AGI for various income ranges: 0.1% for AGIs $50k-75k, 0.2% for AGIs $100k-200k, 2.1% for AGIs over 200k)
Profit/loss from business: +$10,750 (reported on 12.4% of returns)
Here:
+$10,750
State:
+$17,064
(% of AGI for various income ranges: 5.8% for AGIs below $25k, 2.1% for AGIs $25k-50k, 3.5% for AGIs $50k-75k, 2.3% for AGIs $75k-100k, 3.0% for AGIs $100k-200k)
Taxable individual retirement arrangement distribution: $15,835 (reported on 5.2% of returns)
93015:
$15,835
California:
$19,557
(% of AGI for various income ranges: 1.2% for AGIs below $25k, 1.3% for AGIs $25k-50k, 1.1% for AGIs $50k-75k, 2.6% for AGIs $75k-100k, 3.0% for AGIs $100k-200k)
Total itemized deductions: $25,042 (28% of AGI, reported on 29.5% of returns)
Here:
$25,042
State:
$34,004
Here:
28.3% of AGI
State:
22.7% of AGI
(% of AGI for various income ranges: 7.4% for AGIs below $25k, 10.3% for AGIs $25k-50k, 16.6% for AGIs $50k-75k, 19.9% for AGIs $75k-100k, 21.3% for AGIs $100k-200k, 18.9% for AGIs over 200k)
Charity contributions: $2,741 (reported on 25.5% of returns)
Here:
$2,741
State:
$4,659
(% of AGI for various income ranges: 0.6% for AGIs below $25k, 0.7% for AGIs $25k-50k, 1.4% for AGIs $50k-75k, 1.7% for AGIs $75k-100k, 2.1% for AGIs $100k-200k, 2.8% for AGIs over 200k)
Taxes paid: $7,663 (reported on 29.3% of returns)
93015:
$7,663
State:
$14,448
(% of AGI for various income ranges: 1.2% for AGIs below $25k, 2.3% for AGIs $25k-50k, 4.3% for AGIs $50k-75k, 6.5% for AGIs $75k-100k, 7.1% for AGIs $100k-200k, 8.0% for AGIs over 200k)
Earned income credit: $2,303 (reported on 22.0% of returns)
Here:
$2,303
State:
$2,286
(% of AGI for various income ranges: 6.2% for AGIs below $25k, 1.5% for AGIs $25k-50k)
Percentage of individuals using paid preparers for their 2012 taxes: 73.1%
Here:
73%
State:
64%
(% for various income ranges: 70.0% for AGIs below $25k, 75.7% for AGIs $25k-50k, 74.7% for AGIs $50k-75k, 74.6% for AGIs $75k-100k, 74.6% for AGIs $100k-200k, 87.5% for AGIs over 200k)
Averages for the 2004 tax year for zip code 93015, filed in 2005:
Average Adjusted Gross Income (AGI) in 2004: $40,234 (Individual Income Tax Returns)
Here:
$40,234
State:
$58,600
Salary/wage: $37,770 (reported on 88.1% of returns)
Here:
$37,770
State:
$49,455
(% of AGI for various income ranges: 179.0% for AGIs below $10k, 83.4% for AGIs $10k-25k, 86.4% for AGIs $25k-50k, 84.9% for AGIs $50k-75k, 87.4% for AGIs $75k-100k, 68.7% for AGIs over 100k)
Taxable interest for individuals: $1,172 (reported on 34.6% of returns)
This zip code:
$1,172
California:
$2,365
(% of AGI for various income ranges: 6.2% for AGIs below $10k, 1.2% for AGIs $10k-25k, 0.6% for AGIs $25k-50k, 0.9% for AGIs $50k-75k, 0.6% for AGIs $75k-100k, 1.4% for AGIs over 100k)
Taxable dividends: $2,200 (reported on 13.4% of returns)
Here:
$2,200
State:
$4,746
(% of AGI for various income ranges: 5.8% for AGIs below $10k, 0.7% for AGIs $10k-25k, 0.5% for AGIs $25k-50k, 0.6% for AGIs $50k-75k, 0.5% for AGIs $75k-100k, 1.0% for AGIs over 100k)
Net capital gain/loss: +$10,223 (reported on 10.8% of returns)
Here:
+$10,223
State:
+$23,418
(% of AGI for various income ranges: -2.6% for AGIs below $10k, -0.2% for AGIs $10k-25k, 0.2% for AGIs $25k-50k, 0.4% for AGIs $50k-75k, 0.6% for AGIs $75k-100k, 10.6% for AGIs over 100k)
Profit/loss from business: +$10,070 (reported on 12.8% of returns)
Here:
+$10,070
State:
+$16,826
(% of AGI for various income ranges: 0.7% for AGIs below $10k, 4.3% for AGIs $10k-25k, 2.8% for AGIs $25k-50k, 3.1% for AGIs $50k-75k, 2.0% for AGIs $75k-100k, 4.2% for AGIs over 100k)
IRA payment deduction: $2,822 (reported on 1.7% of returns)
93015:
$2,822
California:
$3,192
(% of AGI for various income ranges: 0.1% for AGIs $10k-25k, 0.1% for AGIs $25k-50k, 0.1% for AGIs $50k-75k, 0.1% for AGIs $75k-100k, 0.1% for AGIs over 100k)
Self-employed pension: $7,192 (reported on 0.4% of returns)
Here:
$7,192
California:
$17,688
Total itemized deductions: $22,602 (32% of AGI, reported on 36.2% of returns)
Here:
$22,602
State:
$28,113
Here:
31.9% of AGI
State:
25.3% of AGI
(% of AGI for various income ranges: 26.1% for AGIs below $10k, 9.3% for AGIs $10k-25k, 17.0% for AGIs $25k-50k, 24.1% for AGIs $50k-75k, 24.8% for AGIs $75k-100k, 22.3% for AGIs over 100k)
Charity contributions deductions: $2,534 (3% of AGI, reported on 32.6% of returns)
Here:
$2,534
State:
$3,923
Here:
3.5% of AGI
State:
3.3% of AGI
(% of AGI for various income ranges: 1.4% for AGIs below $10k, 0.6% for AGIs $10k-25k, 1.6% for AGIs $25k-50k, 2.4% for AGIs $50k-75k, 2.3% for AGIs $75k-100k, 2.8% for AGIs over 100k)
Total tax: $4,631 (reported on 66.3% of returns)
93015:
$4,631
State:
$10,761
(% of AGI for various income ranges: 4.2% for AGIs below $10k, 3.0% for AGIs $10k-25k, 4.9% for AGIs $25k-50k, 6.5% for AGIs $50k-75k, 8.1% for AGIs $75k-100k, 13.5% for AGIs over 100k)
Earned income credit: $1,943 (reported on 20.5% of returns)
Here:
$1,943
State:
$1,763
Percentage of individuals using paid preparers for their 2004 taxes: 77.9%
Here:
78%
State:
66%
(% for various income ranges: 68.6% for AGIs below $10k, 79.9% for AGIs $10k-25k, 81.1% for AGIs $25k-50k, 78.3% for AGIs $50k-75k, 75.4% for AGIs $75k-100k, 80.9% for AGIs over 100k)
Household received Food Stamps/SNAP in the past 12 months: 1,173 Household did not receive Food Stamps/SNAP in the past 12 months: 4,678
Women who had a birth in the past 12 months: 278 (271 now married, 5 unmarried) Women who did not have a birth in the past 12 months: 4,788 (2,047 now married, 2,734 unmarried)
Housing units in zip code 93015 with a mortgage: 2,147 (112 second mortgage, 102 both second mortgage and home equity loan) Houses without a mortgage: 17
Median monthly owner costs for units with a mortgage: $2,487 Median monthly owner costs for units without a mortgage: $701
Residents with income below the poverty level in 2022:
This zip code:
7.5%
Whole state:
12.2%
Residents with income below 50% of the poverty level in 2022:
This zip code:
4.4%
Whole state:
6.2%
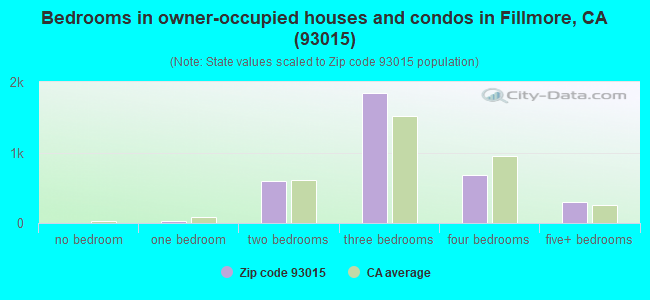
Median number of rooms in houses and condos:
Here:
6.4
State:
6.0
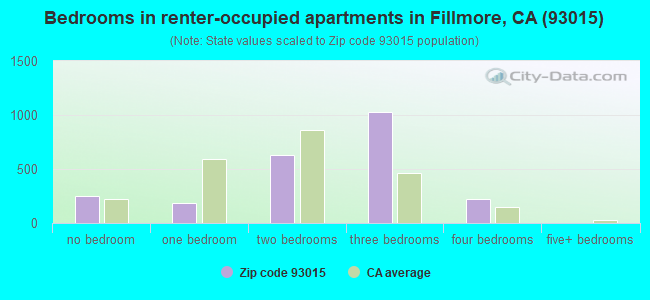
Median number of rooms in apartments:
Here:
4.8
State:
3.9
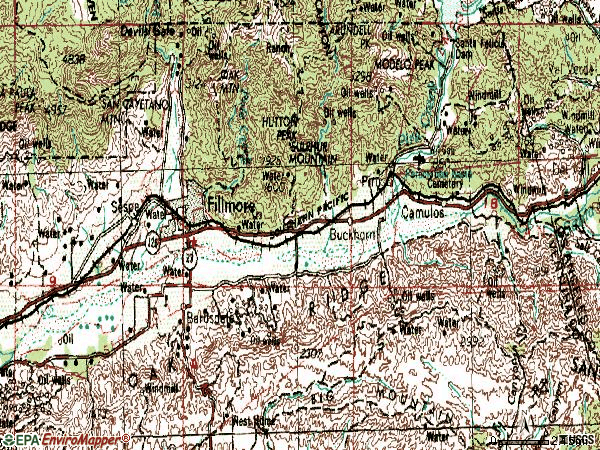
Notable locations in this zip code not listed on our city pages
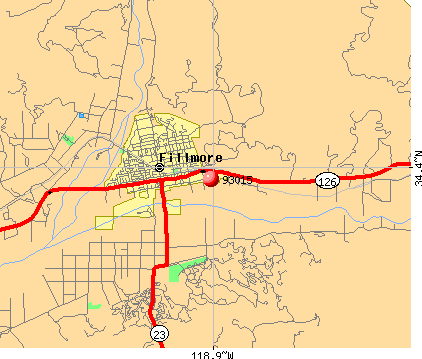
Notable locations in zip code 93015: Hopper Ranch (A), Elkins Ranch Golf Course (B), Fillmore State Fish Hatchery (C), Fillmore School Farm (D), Van Tries Ranch (E), Berrington Ranch (F), San Cayetano Pumping Station (G), Oak Flat Station (H), Fillmore Historical Museum (I), Fillmore City Hall (J), Fillmore Chamber of Commerce (K), Fillmore Branch Ventura County Library (L), Ventura County Fire Protection District Station 27 Fillmore (M), Fillmore Fire Department (N). Display/hide their locations on the map
Churches in zip code 93015 include: Christian Praise Assembly Church (A), The Church of Jesus Christ of Latter Day Saints (B), Church of the Nazarene (C), Citrus Valley Christian Center (D), Faith Miracle Revival Center (E), Fillmore Bible Church (F), Fillmore Lutheran Church (G), Fillmore Religious Science Church (H), First Assembly of God Church (I). Display/hide their locations on the map
Streams, rivers, and creeks: Fourfork Creek (A), Centennial Creek (B), Boulder Creek (C), Bear Creek (D), Sespe Creek (E), Real Wash (F), Pole Creek (G). Display/hide their locations on the map
Parks in zip code 93015 include: Central Park (1), Kenney Grove Park (2), Main Street Park (3), Sespe Park (4), Hopper Mountain Wildlife Refuge (5). Display/hide their locations on the map
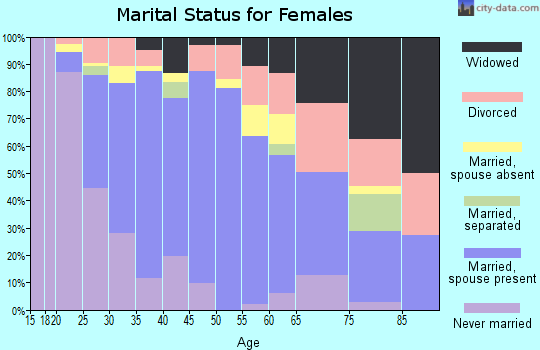
2,736 married couples with children.
1,092 single-parent households (272 men, 820 women).
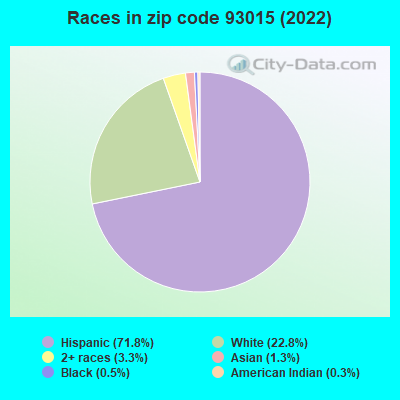
47.2% of residents of 93015 zip code speak English at home.
51.2% of residents speak Spanish at home (69% very well, 11% well, 13% not well, 7% not at all).
0.3% of residents speak other Indo-European language at home (37% very well, 63% well).
0.8% of residents speak Asian or Pacific Island language at home (53% very well, 32% well, 16% not at all).
0.4% of residents speak other language at home (59% very well, 41% well).
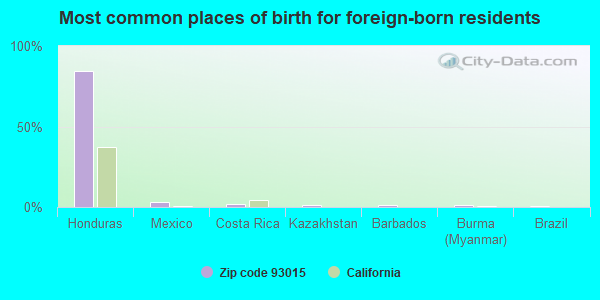
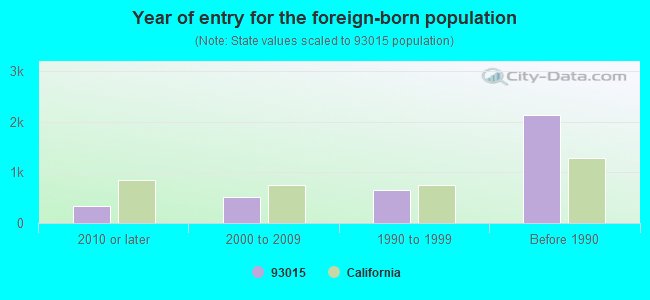
Foreign born population: 3,610 (19.5%) (51.1% of them are naturalized citizens)
This zip code:
19.5%
Whole state:
26.7%
84%Honduras
3%Mexico
2%Costa Rica
1%Kazakhstan
1%Barbados
1%Burma (Myanmar)
1%Brazil
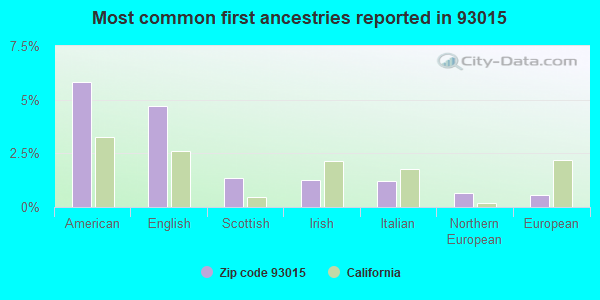
6%American
5%English
1%Scottish
1%Irish
1%Italian
1%Northern European
1%European
Year of entry for the foreign-born population
3382010 or later
5162000 to 2009
6531990 to 1999
2,129Before 1990
Major facilities with environmental interests located in this zip code:
AMERON INTERNATIONAL/POLE PRODUCTS DIV (1020 B STREET in FILLMORE, CA) . Federal Facility
STATE MASTER (California - Hazardous Waste Tracking) - HAZARDOU WASTE PROGRAM CRITERIA AND HAZARDOUS AIR POLLUTANT INVENTORY (Inventory of air pollution sources) Small Quantity Generators, between 100 kg and 1000 kg of hazardous waste/month (Resource Conservation and Recovery Act (tracking hazardous waste)) Business SIC classification: CONCRETE PRODUCTS, EXCEPT BLOCK AND BRICK Alternative names: AMERON POLE PRODUCTS, AMERON POLE PRODS DIV
CALTRANS DISTRICT 7 (1261 VENTURA ST in FILLMORE, CA) . Federal Facility
STATE MASTER (California - Hazardous Waste Tracking) - HAZARDOU WASTE PROGRAM Small Quantity Generators, between 100 kg and 1000 kg of hazardous waste/month (Resource Conservation and Recovery Act (tracking hazardous waste)) - notification Alternative names: FILLMORE MAINT STATION
CHEVRON STATION NO 97983 (704 W VENTURA ST in FILLMORE, CA)
STATE MASTER (California - Hazardous Waste Tracking) - HAZARDOU WASTE PROGRAM Small Quantity Generators, between 100 kg and 1000 kg of hazardous waste/month (Resource Conservation and Recovery Act (tracking hazardous waste)) - notification Organizations: CHEVRON PRODUCTS CO (CONTACT/OWNER)
FILLMORE SENIOR HIGH (555 CENTRAL AVE. in FILLMORE, CA)
(National Center for Education Statistics) - STATE ID-5632021 Organizations: FILLMORE UNIFIED (SCHOOL DISTRICT)
FILLMORE STATION (67 EAST TELEGRAPH ROAD in FILLMORE, CA)
(Resource Conservation and Recovery Act (tracking hazardous waste)) Organizations: SHELL PIPELINE COMPANY LP (CONTACT/OPERATOR)
, SHELL CALIFORNIA PIPELINE COMPANY (CONTACT/OWNER)
Alternative names: TEXACO TRADING AND TRANSPORTATION INC
LEE PHARMACEUTICALS (815 W 5TH STREET in FILLMORE, CA)
SUPERFUND (Superfund database) Small Quantity Generators, between 100 kg and 1000 kg of hazardous waste/month (Resource Conservation and Recovery Act (tracking hazardous waste)) Alternative names: CONSOLIDATED CHEMICAL CO (FORMER OWNER), DR HENRY LEE (OWNER), HUBER MANUFACTURING CO (LESSEE 1984-85)
FILLMORE PIRU CITRUS ASSOCIATION (335 NORTH MAIN STREET in FILLMORE, CA)
COMPLIANCE ACTIVITY (Tracking inspections of insecticide, fungicide, and rodenticide, and toxic substances)
FILLMORE WASTEWATER TREATMENT PLANT (524 SEASIDE STREET in FILLMORE, CA)
CRITERIA AND HAZARDOUS AIR POLLUTANT INVENTORY (Inventory of air pollution sources) National Pollutant Discharge Elimination System MAJOR (Tracking pollutant discharge elimination systems) - permit Business SIC classification: SEWERAGE SYSTEMS Business NAICS classification: SEWAGE TREATMENT FACILITIES. Organizations: FILLMORE, CITY OF (CONTACT/OWNER)
Alternative names: FILLMORE WWTP, NPDES, VENTURA REGIONAL SAN DISTRICT
CHRIS DETAIL SHOP (502 VENTURA ST in FILLMORE, CA)
Small Quantity Generators, between 100 kg and 1000 kg of hazardous waste/month (Resource Conservation and Recovery Act (tracking hazardous waste)) Organizations: ELGGIO CORRAL (CONTACT/OWNER)
AERA ENERGY LLC (SESPE COMPRESSOR PLANT in FILLMORE, CA)
AIR MAJOR (AIRS/AFS) CRITERIA AND HAZARDOUS AIR POLLUTANT INVENTORY (Inventory of air pollution sources) Business SIC classification: CRUDE PETROLEUM AND NATURAL GAS Alternative names: CALRESOURCES LLC
HANSEN PEST CONTROL (1513 LOS ANGELES AVE in FILLMORE, CA)
Small Quantity Generators, between 100 kg and 1000 kg of hazardous waste/month (Resource Conservation and Recovery Act (tracking hazardous waste))
ELKINS RANCH 1980 (3,000 FT S OF GUIBERSON RD., 2 in FILLMORE, CA)
CRITERIA AND HAZARDOUS AIR POLLUTANT INVENTORY (Inventory of air pollution sources) Business SIC classification: REFUSE SYSTEMS Business NAICS classification: SOLID WASTE LANDFILL.
FILLMORE CITY 1968 (NORTH OF FILLMORE in FILLMORE, CA)
CRITERIA AND HAZARDOUS AIR POLLUTANT INVENTORY (Inventory of air pollution sources) Business SIC classification: REFUSE SYSTEMS Business NAICS classification: SOLID WASTE LANDFILL.
Housing units lacking complete plumbing facilities: 2.0% Housing units lacking complete kitchen facilities: 3.7%
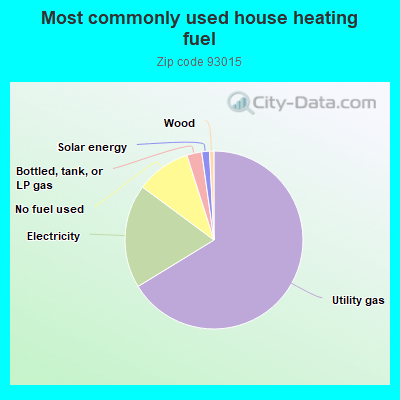
66.0%Utility gas
18.8%Electricity
9.9%No fuel used
2.7%Bottled, tank, or LP gas
1.4%Solar energy
0.8%Wood
Population in 1990: 15,311. Population change in the 1990s: +688 (+4.5%).
Place of birth for U.S.-born residents:
This state: 13,546
Northeast: 248
Midwest: 316
South: 406
West: 342
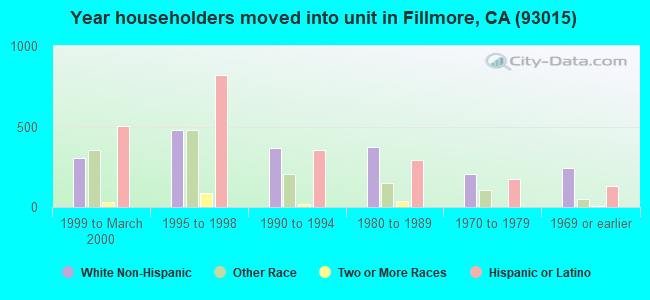
53% of the 93015 zip code residents lived in the same house 5 years ago. Out of people who lived in different houses, 78% lived in this county. Out of people who lived in different counties, 50% lived in California.
93% of the 93015 zip code residents lived in the same house 1 year ago. Out of people who lived in different houses, 53% moved from this county. Out of people who lived in different houses, 20% moved from different county within same state. Out of people who lived in different houses, 30% moved from different state.
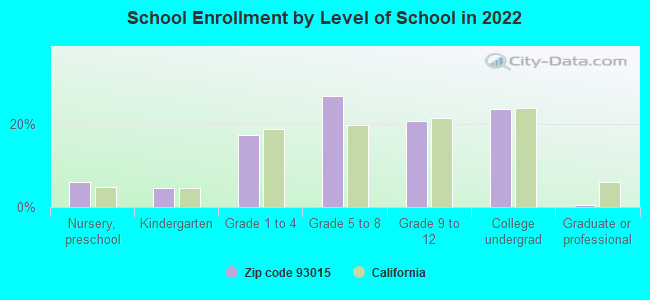
Private vs. public school enrollment:
Students in private schools in grades 1 to 8 (elementary and middle school): 334
Here:
13.9%
California:
10.5%
Students in private schools in grades 9 to 12 (high school): 11
Here:
1.0%
California:
8.5%
Students in private undergraduate colleges: 140
Here:
11.0%
California:
15.9%
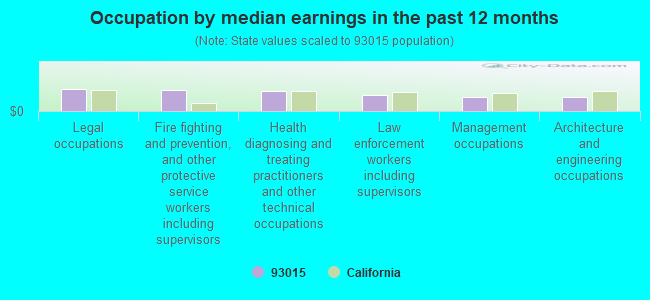
Occupation by median earnings in the past 12 months ($)
110,921Legal occupations
102,760Fire fighting and prevention, and other protective service workers including supervisors
99,512Health diagnosing and treating practitioners and other technical occupations
80,437Law enforcement workers including supervisors
67,922Management occupations
67,857Architecture and engineering occupations
Companies with federal contracts located in this zip code:
KEY GROUP INC (410 ORCHARD ST in FILLMORE, CA; small business) : $1,930,779 in 19 contractsfrom 1999 to 2006
Contracts for Audio/Visual Services, Other Professional Services, Program Management/Support Services, Other ADP and Telecommunications Services (includes data storage on tapes, compact disks, etc.), and moreby Navy Signed by year:2000: $225,074; 2001: $232,255; 2002: $244,392; 2003: $250,876; 2004: $255,978; 2005: $251,572; 2006: $303,209.
Biggest contracts:
$230,695 with Navy for Audio/Visual Services. Signed on 2004-09-27. Completion date: 2003-09-30.
$216,889, same as above.Signed on 2003-09-30. Completion date: 2003-09-30.
$211,166, same as above.Signed on 2002-09-25. Completion date: 2003-09-30.
$210,317, same as above.Signed on 2006-04-28. Completion date: 2011-04-30.
Top industries in this zip code by the number of employees in 2005:
2005 - 2018 National Fire Incident Reporting System (NFIRS) incidents
According to the data from the years 2005 - 2018 the average number of fire incidents per year is 49. The highest number of reported fire incidents - 68 took place in 2007, and the least - 22 in 2012. The data has an increasing trend.
When looking into fire subcategories, the most incidents belonged to: Outside Fires (43.3%), and Structure Fires (29.4%).
Fire incident types reported to NFIRS in Zip Code 93015
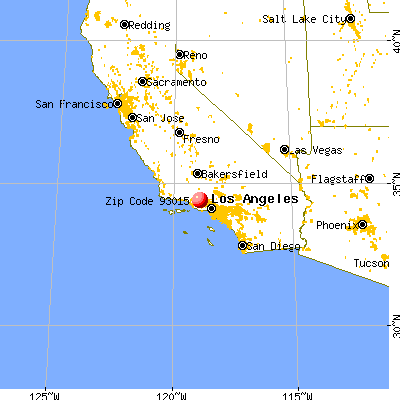


 Nearest zip codes: 93021, 93040, 93066, 93065, 91360, 93060.


 . Federal Facility
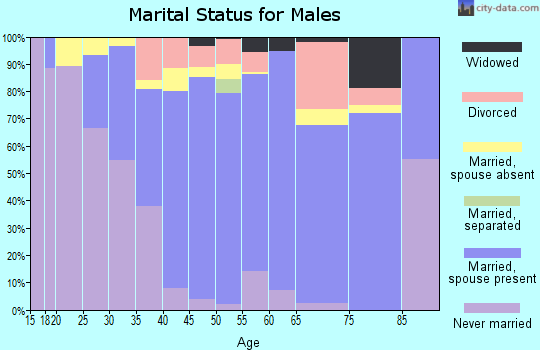
 According to the data from the years 2005 - 2018 the average number of fire incidents per year is 49. The highest number of reported fire incidents - 68 took place in 2007, and the least - 22 in 2012. The data has an increasing trend.
 When looking into fire subcategories, the most incidents belonged to: Outside Fires (43.3%), and Structure Fires (29.4%).