Estimated zip code population in 2022: 13,311 Zip code population in 2010: 15,529 Zip code population in 2000: 14,696
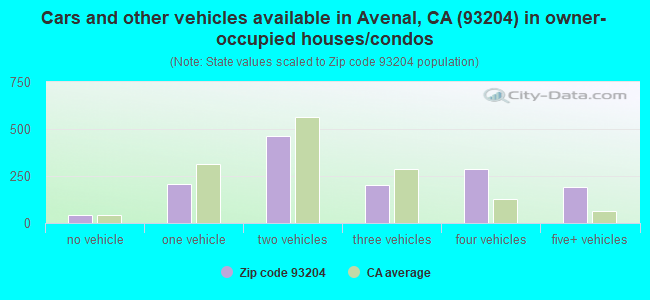
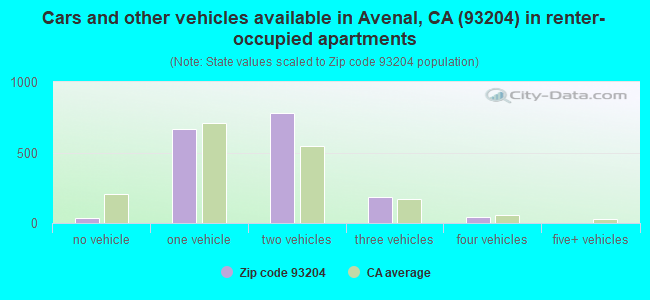
Houses and condos: 3,242 Renter-occupied apartments: 1,715
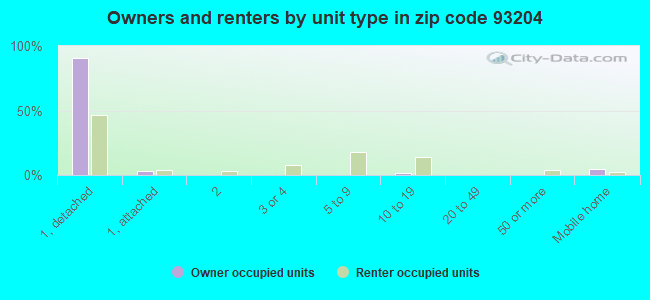
% of renters here:
55%
State:
44%
March 2022 cost of living index in zip code 93204: 92.4 (less than average, U.S. average is 100)
Land area: 59.6 sq. mi. Water area: 0.0 sq. mi.
Population density: 223 people per square mile
(very low).
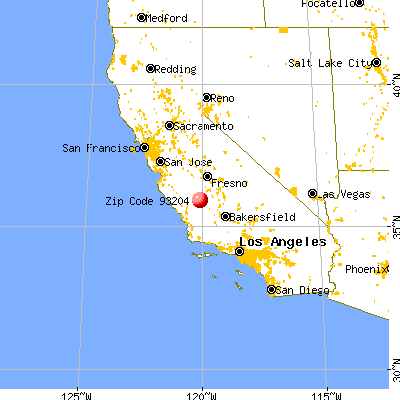
OSM Map
General Map
Google Map
MSN Map
OSM Map
General Map
Google Map
MSN Map
OSM Map
General Map
Google Map
MSN Map
OSM Map
General Map
Google Map
MSN Map
Please wait while loading the map...
Real estate property taxes paid for housing units in 2022:
This zip code:
0.7% ($1,640)
California:
0.7% ($4,831)
Median real estate property taxes paid for housing units with mortgages in 2022: $1,954 (0.9%) Median real estate property taxes paid for housing units with no mortgage in 2022: $1,116 (0.5%)
Business Search- 14 Million verified businesses
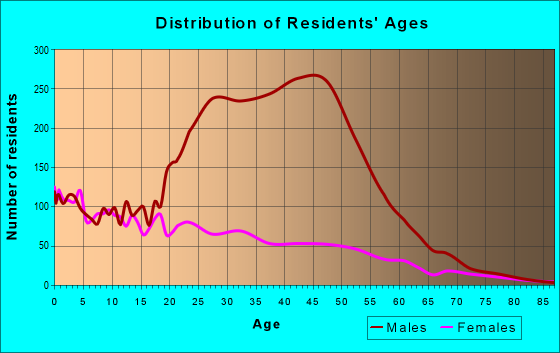
Males: 8,081
(60.7%)
Females: 5,228
(39.3%)
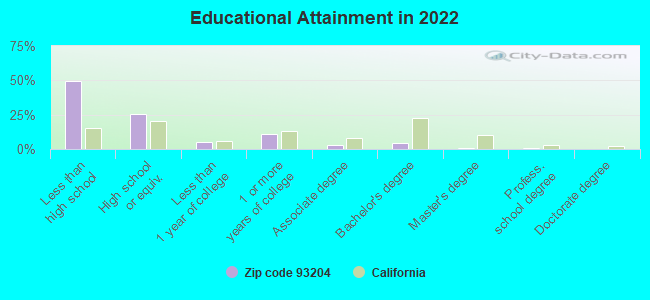
For population 25 years and over in 93204:
High school or higher: 48.9%
Bachelor's degree or higher: 5.9%
Graduate or professional degree: 1.7%
Unemployed: 9.8%
Mean travel time to work (commute): 32.2 minutes
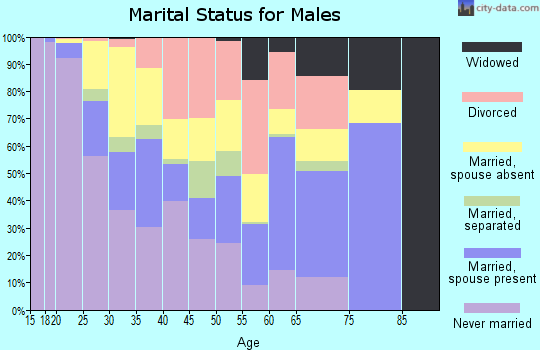
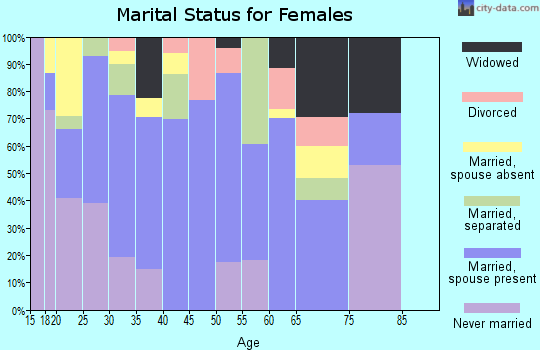
For population 15 years and over in 93204:
Never married: 41.9%
Now married: 43.6%
Separated: 4.4%
Widowed: 3.7%
Divorced: 6.4%
Zip code 93204 compared to state average:
Median household income below state average.
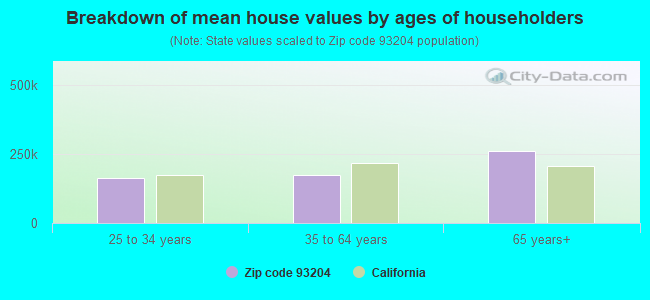
Median house value significantly below state average.
Unemployed percentage above state average.
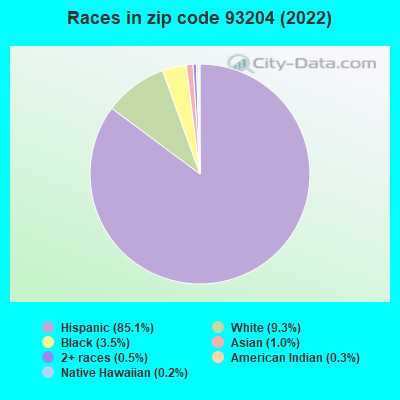
Hispanic race population percentage above state average.
Median age below state average.
Length of stay since moving in significantly above state average.
Percentage of population with a bachelor's degree or higher significantly below state average.
Averages for the 2020 tax year for zip code 93204, filed in 2021:
Average Adjusted Gross Income (AGI) in 2020: $31,860 (Individual Income Tax Returns)
Here:
$31,860
State:
$95,910
Salary/wage: $30,563 (reported on 85.7% of returns)
Here:
$30,563
State:
$77,331
(% of AGI for various income ranges: 2094.1% for AGIs below $25k, 6254.7% for AGIs $25k-50k, 10988.8% for AGIs $50k-75k, 15161.1% for AGIs $75k-100k, 26552.5% for AGIs $100k-200k)
Taxable interest for individuals: $129 (reported on 18.4% of returns)
This zip code:
$129
California:
$2,294
(% of AGI for various income ranges: 0.7% for AGIs below $25k, 2.0% for AGIs $25k-50k, 12.9% for AGIs $50k-75k, 5.6% for AGIs $75k-100k, 110.0% for AGIs $100k-200k)
Ordinary dividends: $3,800 (reported on 0.7% of returns)
Here:
$3,800
State:
$10,949
(% of AGI for various income ranges: 47.5% for AGIs $50k-75k)
Net capital gain/loss in AGI: +$1,600 (reported on 1.4% of returns)
Here:
+$1,600
State:
+$49,306
(% of AGI for various income ranges: 3.6% for AGIs $25k-50k, 80.0% for AGIs $75k-100k)
Profit/loss from business: +$8,041 (reported on 6.4% of returns)
Here:
+$8,041
State:
+$15,671
(% of AGI for various income ranges: 89.8% for AGIs below $25k, 132.9% for AGIs $25k-50k, 238.3% for AGIs $50k-75k)
Total itemized deductions: $26,175 (reported on 1.9% of returns)
Here:
$26,175
State:
$39,517
(% of AGI for various income ranges: 379.2% for AGIs $50k-75k, 1315.6% for AGIs $75k-100k)
Charity contributions: $5,317 (reported on 1.4% of returns)
Here:
$5,317
State:
$12,598
(% of AGI for various income ranges: 52.1% for AGIs $50k-75k, 215.6% for AGIs $75k-100k)
Taxes paid: $7,786 (reported on 1.7% of returns)
93204:
$7,786
State:
$8,807
(% of AGI for various income ranges: 97.5% for AGIs $50k-75k, 345.6% for AGIs $75k-100k)
Earned income credit: $2,609 (reported on 28.6% of returns)
Here:
$2,609
State:
$2,074
(% of AGI for various income ranges: 227.1% for AGIs below $25k, 182.0% for AGIs $25k-50k)
Percentage of individuals using paid preparers for their 2020 taxes: 84.0%
Here:
84%
State:
92%
(% for various income ranges: 74.0% for AGIs below $25k, 92.6% for AGIs $25k-50k, 96.0% for AGIs $50k-75k, 94.7% for AGIs $75k-100k, 90.9% for AGIs $100k-200k)
Averages for the 2012 tax year for zip code 93204, filed in 2013:
Average Adjusted Gross Income (AGI) in 2012: $27,378 (Individual Income Tax Returns)
Here:
$27,378
State:
$72,726
Salary/wage: $25,543 (reported on 94.1% of returns)
Here:
$25,543
State:
$59,079
(% of AGI for various income ranges: 87.1% for AGIs below $25k, 91.8% for AGIs $25k-50k, 88.9% for AGIs $50k-75k, 86.6% for AGIs $75k-100k, 67.4% for AGIs $100k-200k)
Taxable interest for individuals: $364 (reported on 8.5% of returns)
This zip code:
$364
California:
$2,146
(% of AGI for various income ranges: 0.2% for AGIs $50k-75k, 0.4% for AGIs $75k-100k, 0.2% for AGIs $100k-200k)
Ordinary dividends: $1,125 (reported on 1.0% of returns)
Here:
$1,125
State:
$9,308
Profit/loss from business: +$8,950 (reported on 7.2% of returns)
Here:
+$8,950
State:
+$17,064
(% of AGI for various income ranges: 5.1% for AGIs below $25k, 1.4% for AGIs $25k-50k, 1.0% for AGIs $50k-75k)
Taxable individual retirement arrangement distribution: $9,600 (reported on 0.8% of returns)
93204:
$9,600
California:
$19,557
Total itemized deductions: $19,257 (30% of AGI, reported on 9.0% of returns)
Here:
$19,257
State:
$34,004
Here:
29.8% of AGI
State:
22.7% of AGI
(% of AGI for various income ranges: 0.9% for AGIs below $25k, 4.6% for AGIs $25k-50k, 12.6% for AGIs $50k-75k, 13.4% for AGIs $75k-100k, 20.1% for AGIs $100k-200k)
Charity contributions: $2,220 (reported on 7.8% of returns)
Here:
$2,220
State:
$4,659
(% of AGI for various income ranges: 0.3% for AGIs $25k-50k, 1.5% for AGIs $50k-75k, 1.7% for AGIs $75k-100k, 2.1% for AGIs $100k-200k)
Taxes paid: $4,354 (reported on 9.0% of returns)
93204:
$4,354
State:
$14,448
(% of AGI for various income ranges: 0.1% for AGIs below $25k, 0.8% for AGIs $25k-50k, 2.7% for AGIs $50k-75k, 3.5% for AGIs $75k-100k, 6.1% for AGIs $100k-200k)
Earned income credit: $2,845 (reported on 36.2% of returns)
Here:
$2,845
State:
$2,286
(% of AGI for various income ranges: 8.8% for AGIs below $25k, 2.3% for AGIs $25k-50k)
Percentage of individuals using paid preparers for their 2012 taxes: 84.5%
Here:
84%
State:
64%
(% for various income ranges: 83.5% for AGIs below $25k, 87.8% for AGIs $25k-50k, 82.1% for AGIs $50k-75k, 77.8% for AGIs $75k-100k, 80.0% for AGIs $100k-200k)
Averages for the 2004 tax year for zip code 93204, filed in 2005:
Average Adjusted Gross Income (AGI) in 2004: $24,708 (Individual Income Tax Returns)
Here:
$24,708
State:
$58,600
Salary/wage: $22,516 (reported on 93.5% of returns)
Here:
$22,516
State:
$49,455
(% of AGI for various income ranges: 83.3% for AGIs below $10k, 87.2% for AGIs $10k-25k, 89.5% for AGIs $25k-50k, 83.5% for AGIs $50k-75k, 82.5% for AGIs $75k-100k, 58.0% for AGIs over 100k)
Taxable interest for individuals: $806 (reported on 14.7% of returns)
This zip code:
$806
California:
$2,365
(% of AGI for various income ranges: 0.2% for AGIs below $10k, 0.5% for AGIs $10k-25k, 0.4% for AGIs $25k-50k, 0.7% for AGIs $50k-75k, 0.7% for AGIs $75k-100k, 0.7% for AGIs over 100k)
Taxable dividends: $2,904 (reported on 2.9% of returns)
Here:
$2,904
State:
$4,746
(% of AGI for various income ranges: 0.3% for AGIs $10k-25k, 0.5% for AGIs $25k-50k, 0.2% for AGIs $50k-75k, 0.6% for AGIs $75k-100k)
Net capital gain/loss: +$3,203 (reported on 2.3% of returns)
Here:
+$3,203
State:
+$23,418
(% of AGI for various income ranges: 0.1% for AGIs $10k-25k, 0.1% for AGIs $25k-50k, 1.2% for AGIs $50k-75k, 0.8% for AGIs $75k-100k)
Profit/loss from business: +$9,122 (reported on 7.4% of returns)
Here:
+$9,122
State:
+$16,826
(% of AGI for various income ranges: 7.5% for AGIs below $10k, 2.9% for AGIs $10k-25k, 2.5% for AGIs $25k-50k, 3.3% for AGIs $50k-75k)
Total itemized deductions: $16,190 (29% of AGI, reported on 9.1% of returns)
Here:
$16,190
State:
$28,113
Here:
28.8% of AGI
State:
25.3% of AGI
(% of AGI for various income ranges: 1.6% for AGIs $10k-25k, 4.7% for AGIs $25k-50k, 10.3% for AGIs $50k-75k, 17.5% for AGIs $75k-100k, 18.0% for AGIs over 100k)
Charity contributions deductions: $2,314 (4% of AGI, reported on 8.2% of returns)
Here:
$2,314
State:
$3,923
Here:
4.0% of AGI
State:
3.3% of AGI
(% of AGI for various income ranges: 0.1% for AGIs $10k-25k, 0.5% for AGIs $25k-50k, 1.4% for AGIs $50k-75k, 2.2% for AGIs $75k-100k, 3.4% for AGIs over 100k)
Total tax: $2,616 (reported on 41.3% of returns)
93204:
$2,616
State:
$10,761
(% of AGI for various income ranges: 1.3% for AGIs below $10k, 1.6% for AGIs $10k-25k, 3.2% for AGIs $25k-50k, 7.3% for AGIs $50k-75k, 9.5% for AGIs $75k-100k, 15.3% for AGIs over 100k)
Earned income credit: $2,211 (reported on 49.8% of returns)
Here:
$2,211
State:
$1,763
Percentage of individuals using paid preparers for their 2004 taxes: 86.2%
Here:
86%
State:
66%
(% for various income ranges: 80.4% for AGIs below $10k, 89.1% for AGIs $10k-25k, 88.5% for AGIs $25k-50k, 81.1% for AGIs $50k-75k, 79.1% for AGIs $75k-100k, 81.5% for AGIs over 100k)
Likely homosexual households (counted as self-reported same-sex unmarried-partner households)
Lesbian couples: 0.7% of all households
Gay men: 0.0% of all households
Household received Food Stamps/SNAP in the past 12 months: 656 Household did not receive Food Stamps/SNAP in the past 12 months: 2,519
Women who had a birth in the past 12 months: 209 (131 now married, 79 unmarried) Women who did not have a birth in the past 12 months: 2,315 (1,300 now married, 998 unmarried)
Housing units in zip code 93204 with a mortgage: 926 (27 second mortgage, 28 both second mortgage and home equity loan) Median monthly owner costs for units with a mortgage: $1,194 Median monthly owner costs for units without a mortgage: $522
Residents with income below the poverty level in 2022:
This zip code:
20.3%
Whole state:
12.2%
Residents with income below 50% of the poverty level in 2022:
This zip code:
10.6%
Whole state:
6.2%
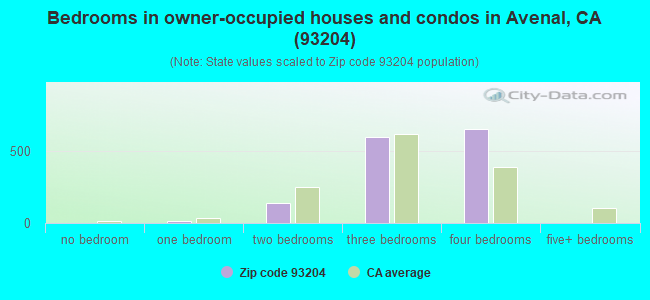
Median number of rooms in houses and condos:
Here:
5.5
State:
6.0
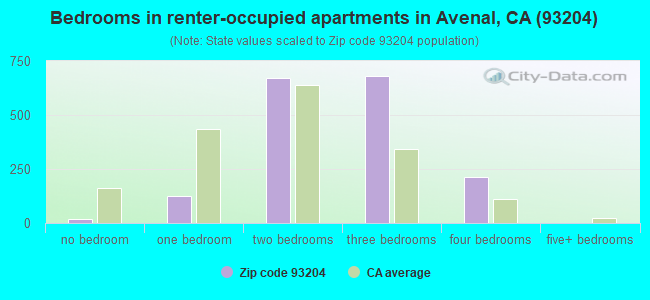
Median number of rooms in apartments:
Here:
4.6
State:
3.9
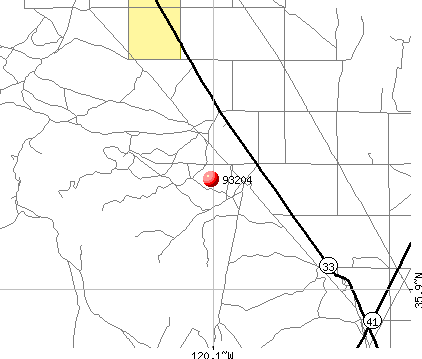
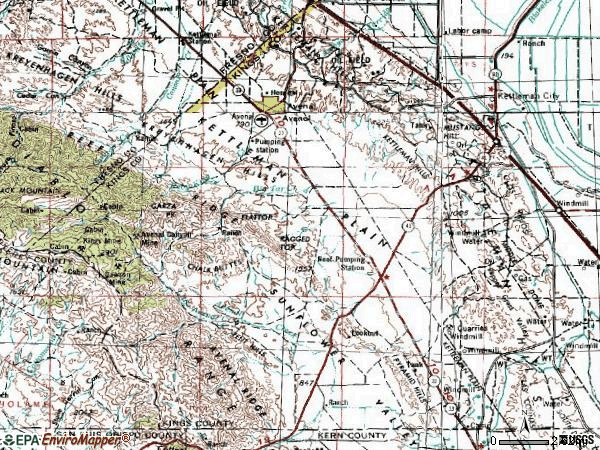
Notable locations in this zip code not listed on our city pages
Notable locations in zip code 93204: Orchard Ranch (A), Avenal Landfill (B), Avenal City Hall (C), Avenal Branch Kings County Library (D), Avenal District Hospital Ambulance Service (E), Avenal State Prison Fire Department (F), Kings County Fire Department Station 12 Avenal (G). Display/hide their locations on the map
Streams, rivers, and creeks: Cottonwood Creek (A), Big Tar Creek (B), Baby King Creek (C), Arroyo del Camino (D), Arroyo Somero (E), Arroyo Ramoso (F), Arroyo Mellado (G), Arroyo Larguito (H), Arroyo Esquinado (I). Display/hide their locations on the map
In group quarters: 2,794 (-1 institutionalized population)
Size of family households: 640 2-persons, 480 3-persons, 505 4-persons, 618 5-persons, 278 6-persons, 100 7-or-more-persons
Size of nonfamily households: 465 1-person
1,818 married couples with children.
1,010 single-parent households (409 men, 601 women).
22.7% of residents of 93204 zip code speak English at home.
75.9% of residents speak Spanish at home (56% very well, 11% well, 18% not well, 15% not at all).
0.1% of residents speak other Indo-European language at home (44% very well, 31% well, 25% not well).
0.9% of residents speak Asian or Pacific Island language at home (72% very well, 28% not at all).
0.5% of residents speak other language at home (50% very well, 47% not well, 3% not at all).
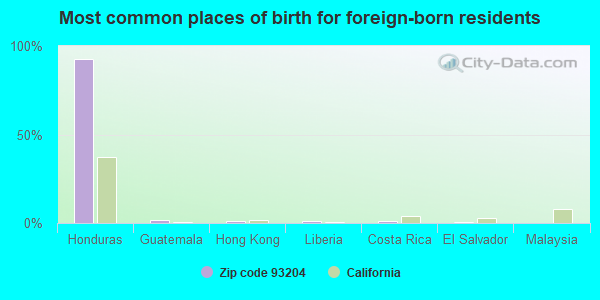
Foreign born population: 4,903 (36.8%) (26.5% of them are naturalized citizens)
This zip code:
36.8%
Whole state:
26.7%
93%Honduras
2%Guatemala
1%Hong Kong
1%Liberia
1%Costa Rica
0%El Salvador
0%Malaysia
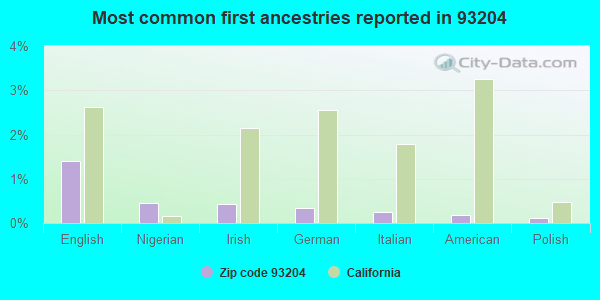
1%English
0%Nigerian
0%Irish
0%German
0%Italian
0%American
0%Polish
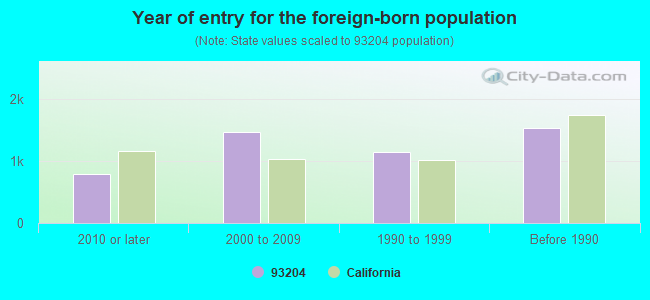
Year of entry for the foreign-born population
7912010 or later
1,4752000 to 2009
1,1471990 to 1999
1,538Before 1990
Facilities with environmental interests located in this zip code:
CALIF STATE PRISON - AVENAL (1 KINGS WAY in AVENAL, CA)
AIR MAJOR (AIRS/AFS) STATE MASTER (California - Hazardous Waste Tracking) - HAZARDOU WASTE PROGRAM CRITERIA AND HAZARDOUS AIR POLLUTANT INVENTORY (Inventory of air pollution sources) Small Quantity Generators, between 100 kg and 1000 kg of hazardous waste/month (Resource Conservation and Recovery Act (tracking hazardous waste)) - notification Business SIC classification: WOOD OFFICE AND STORE FIXTURES, PARTITIONS, SHELVING, AND LOCKERS; CORRECTIONAL INSTITUTIONS Organizations: STATE OF CALIFORNIA (CONTACT/OWNER)
Alternative names: AVENAL STATE PRISON, CA DEPT CORRECTIONS STATE PRISON, DOC - AVENAL STATE PRISON
MOBIL- PYRAMID HILLS- DAGANY (S33&34, T24S, R18E in AVENAL, CA)
(Resource Conservation and Recovery Act (tracking hazardous waste)) Organizations: MOBIL OIL CORP (CONTACT/OWNER)
MOBIL- PYRAMID HILLS- NORRIS (S28&29, T24S, R18E in AVENAL, CA)
(Resource Conservation and Recovery Act (tracking hazardous waste)) Organizations: MOBIL OIL CORP (CONTACT/OWNER)
GASPAR TRUCKING (109 N A AVE in AVENAL, CA)
TRANSPORTER (Resource Conservation and Recovery Act (tracking hazardous waste)) Organizations: GASPAR LOPEZ R (CONTACT/OPERATOR)
, GASPAR LOPEZ (CONTACT/OWNER)
HALLIBURTON SERVICES (333 KING ST in AVENAL, CA)
Small Quantity Generators, between 100 kg and 1000 kg of hazardous waste/month (Resource Conservation and Recovery Act (tracking hazardous waste)) - notification Organizations: HALLIBURTON COMPANY (CONTACT/OWNER)
BANJAMIN A GOMEZ (312 SONOMA ST in AVENAL, CA)
TRANSPORTER (Resource Conservation and Recovery Act (tracking hazardous waste)) Organizations: BENJAMIN A GOMEZ (CONTACT/OPERATOR)
HALLIBURTON SERVICES (12175 S 7TH ST in AVENAL, CA)
CRITERIA AND HAZARDOUS AIR POLLUTANT INVENTORY (Inventory of air pollution sources)
HOLMES WESTERN OIL CORPORATION (PYRAMID HILLS LEASE in AVENAL, CA)
CRITERIA AND HAZARDOUS AIR POLLUTANT INVENTORY (Inventory of air pollution sources) Business SIC classification: CRUDE PETROLEUM AND NATURAL GAS
J.P. OIL COMPANY, INC. (KETTLEMAN HILLS in AVENAL, CA)
CRITERIA AND HAZARDOUS AIR POLLUTANT INVENTORY (Inventory of air pollution sources) Business SIC classification: CRUDE PETROLEUM AND NATURAL GAS
Housing units lacking complete plumbing facilities: 1.7% Housing units lacking complete kitchen facilities: 0.8%
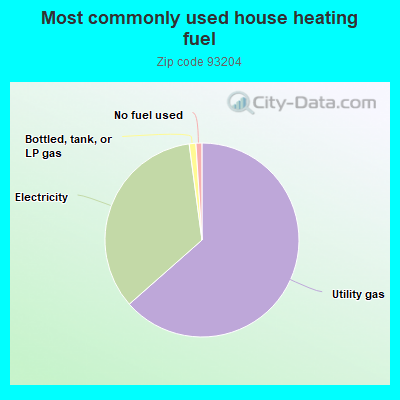
63.5%Utility gas
34.4%Electricity
1.1%Bottled, tank, or LP gas
1.0%No fuel used
Population in 1990: 9,882. Population change in the 1990s: +4,814 (+48.7%).
Place of birth for U.S.-born residents:
This state: 7,886
Northeast: 27
Midwest: 136
South: 191
West: 122
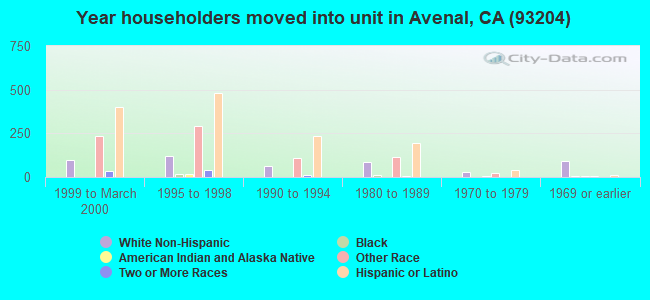
31% of the 93204 zip code residents lived in the same house 5 years ago. Out of people who lived in different houses, 23% lived in this county. Out of people who lived in different counties, 50% lived in California.
86% of the 93204 zip code residents lived in the same house 1 year ago. Out of people who lived in different houses, 22% moved from this county. Out of people who lived in different houses, 74% moved from different county within same state. Out of people who lived in different houses, 2% moved from different state. Out of people who lived in different houses, 3% moved from abroad.
Private vs. public school enrollment:
Students in private schools in grades 1 to 8 (elementary and middle school):
Here:
0.0%
California:
10.5%
Students in private schools in grades 9 to 12 (high school): 464
Here:
42.1%
California:
8.5%
Students in private undergraduate colleges: 160
Here:
19.8%
California:
15.9%
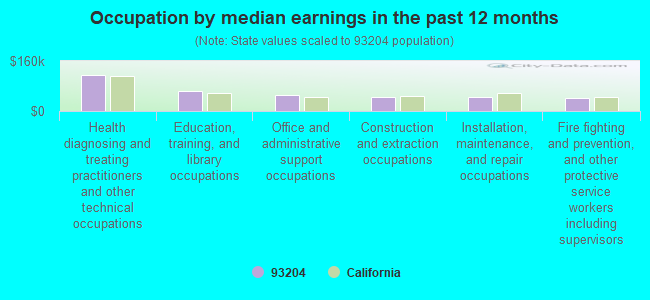
Occupation by median earnings in the past 12 months ($)
115,676Health diagnosing and treating practitioners and other technical occupations
65,526Education, training, and library occupations
51,238Office and administrative support occupations
45,254Construction and extraction occupations
43,216Installation, maintenance, and repair occupations
40,212Fire fighting and prevention, and other protective service workers including supervisors
Top industries in this zip code by the number of employees in 2005:
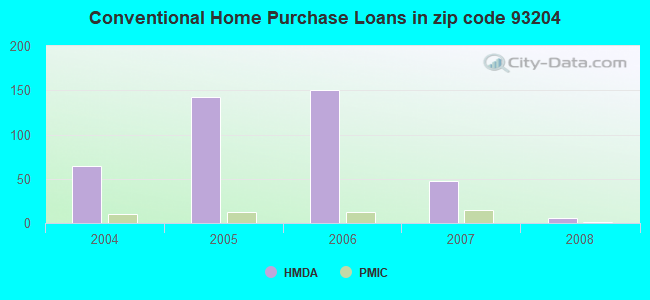
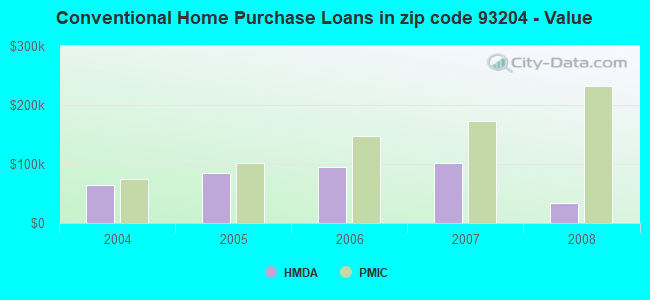
Detailed PMIC statistics for the following Tracts:0017.01
2002 - 2018 National Fire Incident Reporting System (NFIRS) incidents
Based on the data from the years 2002 - 2018 the average number of fires per year is 41. The highest number of fire incidents - 74 took place in 2005, and the least - 0 in 2003. The data has a growing trend.
When looking into fire subcategories, the most reports belonged to: Outside Fires (63.9%), and Structure Fires (19.9%).
Fire incident types reported to NFIRS in Zip Code 93204


 Nearest zip codes: 93239, 93234, 93461, 93249, 93266, 93245.
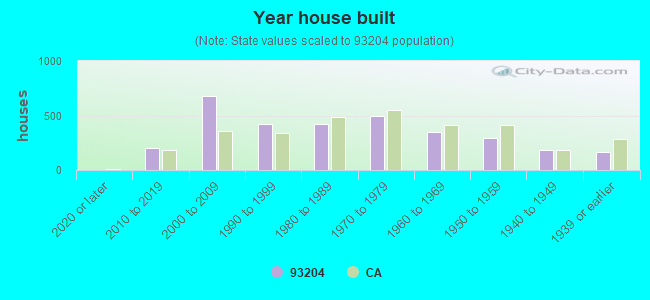


 Based on the data from the years 2002 - 2018 the average number of fires per year is 41. The highest number of fire incidents - 74 took place in 2005, and the least - 0 in 2003. The data has a growing trend.
 When looking into fire subcategories, the most reports belonged to: Outside Fires (63.9%), and Structure Fires (19.9%).