Estimated zip code population in 2022: 9,789 Zip code population in 2010: 10,194 Zip code population in 2000: 9,303
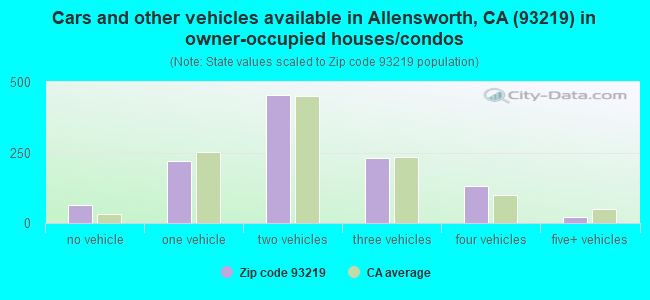
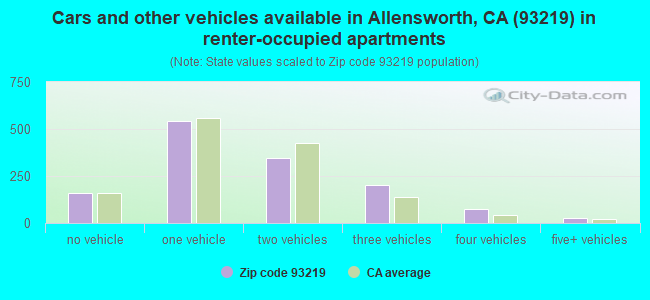
Houses and condos: 2,624 Renter-occupied apartments: 1,346
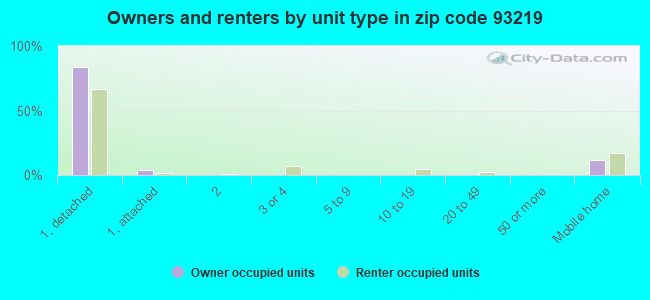
% of renters here:
55%
State:
44%
March 2022 cost of living index in zip code 93219: 88.0 (less than average, U.S. average is 100)
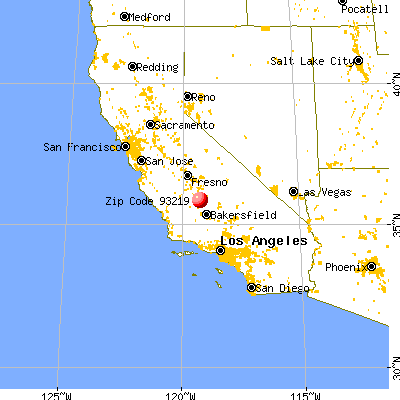
Land area: 97.3 sq. mi. Water area: 0.1 sq. mi.
Population density: 101 people per square mile
(very low).
OSM Map
General Map
Google Map
MSN Map
OSM Map
General Map
Google Map
MSN Map
OSM Map
General Map
Google Map
MSN Map
OSM Map
General Map
Google Map
MSN Map
Please wait while loading the map...
Real estate property taxes paid for housing units in 2022:
This zip code:
0.6% ($1,373)
California:
0.7% ($4,831)
Median real estate property taxes paid for housing units with mortgages in 2022: $1,467 (0.6%) Median real estate property taxes paid for housing units with no mortgage in 2022: $1,153 (0.5%)
Business Search- 14 Million verified businesses
Males: 4,747
(48.5%)
Females: 5,042
(51.5%)
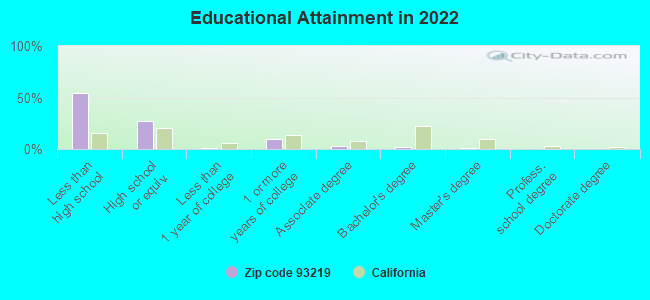
For population 25 years and over in 93219:
High school or higher: 44.5%
Bachelor's degree or higher: 3.4%
Graduate or professional degree: 1.4%
Unemployed: 14.6%
Mean travel time to work (commute): 26.2 minutes
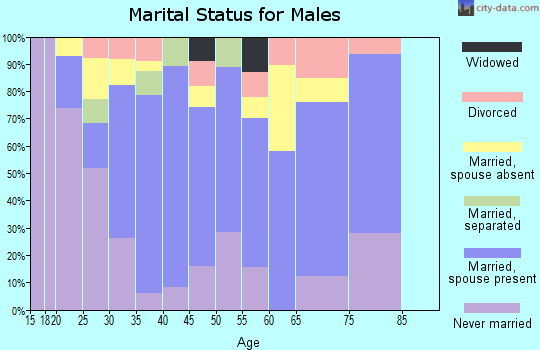
For population 15 years and over in 93219:
Never married: 43.8%
Now married: 43.6%
Separated: 4.1%
Widowed: 4.3%
Divorced: 4.2%
Zip code 93219 compared to state average:
Median household income below state average.
Median house value significantly below state average.
Unemployed percentage above state average.
Black race population percentage significantly below state average.
Hispanic race population percentage above state average.
Median age significantly below state average.
Length of stay since moving in significantly above state average.
Percentage of population with a bachelor's degree or higher significantly below state average.
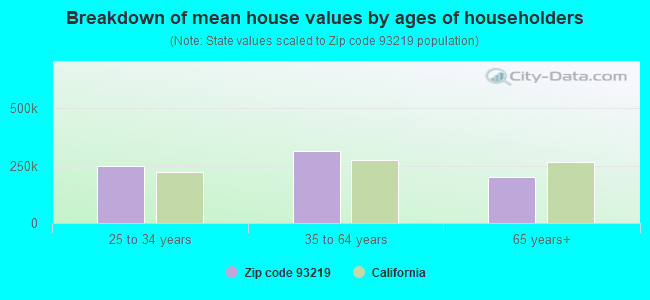
Estimated median house/condo value in 2022: $229,223
93219:
$229,223
California:
$715,900
According to our research of California and other state lists, there were 10 registered sex offenders living in 93219 zip code as of April 27, 2024. The ratio of all residents to sex offenders in zip code 93219 is 1,041 to 1. The ratio of registered sex offenders to all residents in this zip code is lower than the state average.
Median resident age:
This zip code:
26.6 years
California median age:
37.9 years
Average household size:
This zip code:
4.0 people
California:
2.8 people
Averages for the 2020 tax year for zip code 93219, filed in 2021:
Average Adjusted Gross Income (AGI) in 2020: $30,437 (Individual Income Tax Returns)
Here:
$30,437
State:
$95,910
Salary/wage: $25,003 (reported on 91.5% of returns)
Here:
$25,003
State:
$77,331
(% of AGI for various income ranges: 1723.2% for AGIs below $25k, 4226.1% for AGIs $25k-50k, 7937.9% for AGIs $50k-75k, 10126.7% for AGIs $75k-100k)
Taxable interest for individuals: $103 (reported on 8.5% of returns)
This zip code:
$103
California:
$2,294
(% of AGI for various income ranges: 0.4% for AGIs below $25k, 1.6% for AGIs $25k-50k, 3.2% for AGIs $50k-75k, 4.4% for AGIs $75k-100k)
Ordinary dividends: $225 (reported on 1.0% of returns)
Here:
$225
State:
$10,949
(% of AGI for various income ranges: 1.0% for AGIs $25k-50k)
Net capital gain/loss in AGI: +$783 (reported on 1.5% of returns)
Here:
+$783
State:
+$49,306
(% of AGI for various income ranges: 5.3% for AGIs $25k-50k)
Profit/loss from business: +$7,530 (reported on 6.5% of returns)
Here:
+$7,530
State:
+$15,671
(% of AGI for various income ranges: 60.2% for AGIs below $25k, 81.0% for AGIs $25k-50k, 199.6% for AGIs $50k-75k)
Total itemized deductions: $26,600 (reported on 1.0% of returns)
Here:
$26,600
State:
$39,517
(% of AGI for various income ranges: 380.0% for AGIs $50k-75k)
Charity contributions: $4,350 (reported on 1.0% of returns)
Here:
$4,350
State:
$12,598
(% of AGI for various income ranges: 62.1% for AGIs $50k-75k)
Taxes paid: $11,200 (reported on 1.0% of returns)
93219:
$11,200
State:
$8,807
(% of AGI for various income ranges: 160.0% for AGIs $50k-75k)
Earned income credit: $2,712 (reported on 33.2% of returns)
Here:
$2,712
State:
$2,074
(% of AGI for various income ranges: 179.4% for AGIs below $25k, 165.5% for AGIs $25k-50k)
Percentage of individuals using paid preparers for their 2020 taxes: 85.0%
Here:
85%
State:
92%
(% for various income ranges: 82.8% for AGIs below $25k, 86.8% for AGIs $25k-50k, 89.4% for AGIs $50k-75k, 85.7% for AGIs $75k-100k, 80.0% for AGIs $100k-200k)
Averages for the 2012 tax year for zip code 93219, filed in 2013:
Average Adjusted Gross Income (AGI) in 2012: $23,321 (Individual Income Tax Returns)
Here:
$23,321
State:
$72,726
Salary/wage: $20,574 (reported on 95.9% of returns)
Here:
$20,574
State:
$59,079
(% of AGI for various income ranges: 83.9% for AGIs below $25k, 88.7% for AGIs $25k-50k, 87.2% for AGIs $50k-75k, 112.8% for AGIs $75k-100k)
Taxable interest for individuals: $96 (reported on 6.8% of returns)
This zip code:
$96
California:
$2,146
(% of AGI for various income ranges: 0.1% for AGIs $75k-100k)
Ordinary dividends: $100 (reported on 0.5% of returns)
Here:
$100
State:
$9,308
Profit/loss from business: +$8,654 (reported on 6.5% of returns)
Here:
+$8,654
State:
+$17,064
(% of AGI for various income ranges: 3.8% for AGIs below $25k, 1.1% for AGIs $25k-50k, 3.3% for AGIs $50k-75k)
Total itemized deductions: $17,548 (35% of AGI, reported on 7.3% of returns)
Here:
$17,548
State:
$34,004
Here:
35.4% of AGI
State:
22.7% of AGI
(% of AGI for various income ranges: 1.7% for AGIs below $25k, 5.3% for AGIs $25k-50k, 12.1% for AGIs $50k-75k, 25.9% for AGIs $75k-100k)
Charity contributions: $2,252 (reported on 5.7% of returns)
Here:
$2,252
State:
$4,659
(% of AGI for various income ranges: 0.1% for AGIs below $25k, 0.4% for AGIs $25k-50k, 1.3% for AGIs $50k-75k, 4.1% for AGIs $75k-100k)
Taxes paid: $3,122 (reported on 7.3% of returns)
93219:
$3,122
State:
$14,448
(% of AGI for various income ranges: 0.2% for AGIs below $25k, 0.7% for AGIs $25k-50k, 2.2% for AGIs $50k-75k, 7.6% for AGIs $75k-100k)
Earned income credit: $2,883 (reported on 45.7% of returns)
Here:
$2,883
State:
$2,286
(% of AGI for various income ranges: 11.1% for AGIs below $25k, 2.9% for AGIs $25k-50k)
Percentage of individuals using paid preparers for their 2012 taxes: 74.3%
Here:
74%
State:
64%
(% for various income ranges: 72.0% for AGIs below $25k, 78.6% for AGIs $25k-50k, 78.9% for AGIs $50k-75k, 120.0% for AGIs $75k-100k)
Averages for the 2004 tax year for zip code 93219, filed in 2005:
Average Adjusted Gross Income (AGI) in 2004: $19,955 (Individual Income Tax Returns)
Here:
$19,955
State:
$58,600
Salary/wage: $17,613 (reported on 96.3% of returns)
Here:
$17,613
State:
$49,455
(% of AGI for various income ranges: 106.5% for AGIs below $10k, 82.9% for AGIs $10k-25k, 88.7% for AGIs $25k-50k, 88.5% for AGIs $50k-75k, 126.9% for AGIs $75k-100k)
Taxable interest for individuals: $630 (reported on 11.5% of returns)
This zip code:
$630
California:
$2,365
(% of AGI for various income ranges: 0.4% for AGIs below $10k, 0.2% for AGIs $10k-25k, 0.5% for AGIs $25k-50k, 0.2% for AGIs $50k-75k, 2.5% for AGIs $75k-100k)
Taxable dividends: $478 (reported on 0.8% of returns)
Here:
$478
State:
$4,746
Net capital gain/loss: +$6,275 (reported on 1.5% of returns)
Here:
+$6,275
State:
+$23,418
Profit/loss from business: +$9,404 (reported on 5.8% of returns)
Here:
+$9,404
State:
+$16,826
Profit/loss from farming: +$5,500 (reported on 0.4% of returns)
Here:
+$5,500
State:
-$7,562
Total itemized deductions: $15,614 (36% of AGI, reported on 8.2% of returns)
Here:
$15,614
State:
$28,113
Here:
36.4% of AGI
State:
25.3% of AGI
(% of AGI for various income ranges: 2.9% for AGIs $10k-25k, 7.6% for AGIs $25k-50k, 15.6% for AGIs $50k-75k, 38.8% for AGIs $75k-100k)
Charity contributions deductions: $2,127 (5% of AGI, reported on 6.7% of returns)
Here:
$2,127
State:
$3,923
Here:
4.9% of AGI
State:
3.3% of AGI
(% of AGI for various income ranges: 0.2% for AGIs $10k-25k, 0.8% for AGIs $25k-50k, 2.4% for AGIs $50k-75k, 3.7% for AGIs $75k-100k)
Total tax: $1,967 (reported on 31.7% of returns)
93219:
$1,967
State:
$10,761
(% of AGI for various income ranges: 1.5% for AGIs below $10k, 1.3% for AGIs $10k-25k, 2.8% for AGIs $25k-50k, 5.8% for AGIs $50k-75k, 10.6% for AGIs $75k-100k, 18.7% for AGIs over 100k)
Earned income credit: $2,266 (reported on 58.8% of returns)
Here:
$2,266
State:
$1,763
Percentage of individuals using paid preparers for their 2004 taxes: 70.1%
Here:
70%
State:
66%
(% for various income ranges: 63.6% for AGIs below $10k, 71.5% for AGIs $10k-25k, 73.9% for AGIs $25k-50k, 66.0% for AGIs $50k-75k, 130.8% for AGIs $75k-100k)
Household received Food Stamps/SNAP in the past 12 months: 1,039 Household did not receive Food Stamps/SNAP in the past 12 months: 1,584
Women who had a birth in the past 12 months: 149 (79 now married, 71 unmarried) Women who did not have a birth in the past 12 months: 2,646 (965 now married, 1,684 unmarried)
Housing units in zip code 93219 with a mortgage: 755 (21 second mortgage, 1 both second mortgage and home equity loan) Median monthly owner costs for units with a mortgage: $1,158 Median monthly owner costs for units without a mortgage: $444
Residents with income below the poverty level in 2022:
This zip code:
17.3%
Whole state:
12.2%
Residents with income below 50% of the poverty level in 2022:
This zip code:
6.8%
Whole state:
6.2%
Median number of rooms in houses and condos:
Here:
5.3
State:
6.0
Median number of rooms in apartments:
Here:
4.4
State:
3.9
Notable locations in this zip code not listed on our city pages
Notable locations in zip code 93219: South Creek Dairy (A), Deer Creek Ranch (B), Twenty-Eight Gun Club (C), Tulare County Fire Department Battalion 2 Earlimart Fire Station 28 (D), Veterans Building (E), Earlimart Branch Tulare County Library (F). Display/hide their locations on the map
In group quarters: 1 (-1 institutionalized population)
Size of family households: 312 2-persons, 422 3-persons, 457 4-persons, 323 5-persons, 193 6-persons, 264 7-or-more-persons
Size of nonfamily households: 419 1-person, 51 2-persons
1,319 married couples with children.
979 single-parent households (215 men, 764 women).
13.5% of residents of 93219 zip code speak English at home.
84.7% of residents speak Spanish at home (19% very well, 45% well, 11% not well, 26% not at all).
3.4% of residents speak Asian or Pacific Island language at home (46% very well, 34% well, 21% not well).
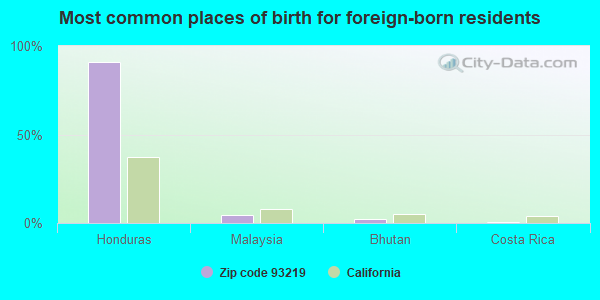
Foreign born population: 3,903 (39.9%) (20.2% of them are naturalized citizens)
This zip code:
39.9%
Whole state:
26.7%
91%Honduras
4%Malaysia
2%Bhutan
1%Costa Rica
0%Guatemala
0%Nicaragua
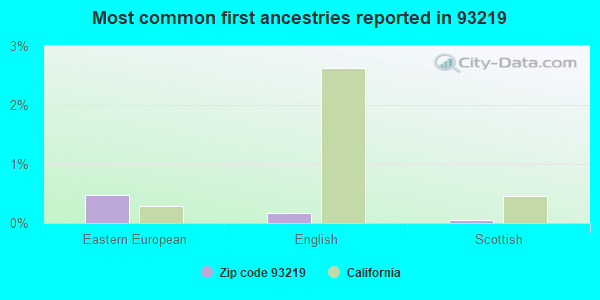
0%Eastern European
0%English
0%Scottish
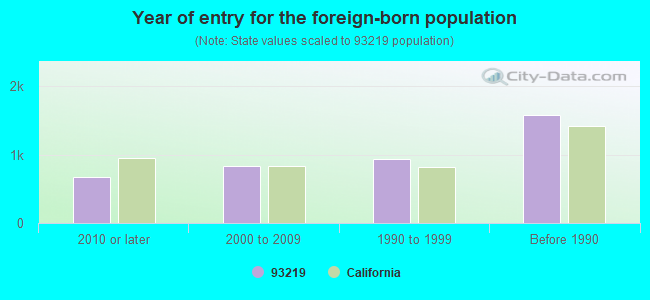
Year of entry for the foreign-born population
6762010 or later
8302000 to 2009
9341990 to 1999
1,578Before 1990
Facilities with environmental interests located in this zip code:
ALLENSWORTH ELEMENTARY SCHOOL (3320 YOUNG ROAD in ALLENSWORTH, CA)
(Geographic Names Information System) COMPLIANCE ACTIVITY (Tracking inspections of insecticide, fungicide, and rodenticide, and toxic substances) (National Center for Education Statistics) - STATE ID-6053839 Alternative names: ALLENSWORTH BOARD OF EDUCATION
ALILA (850 W. WASHINGTON AVE in EARLIMART, CA)
(National Center for Education Statistics) - STATE ID-5430335 Organizations: EARLIMART ELEMENTARY (SCHOOL DISTRICT)
FMC CORP AGRI CHEM GROUP (AVE 56 RD 160 in EARLIMART, CA)
Small Quantity Generators, between 100 kg and 1000 kg of hazardous waste/month (Resource Conservation and Recovery Act (tracking hazardous waste)) Organizations: FMC CORPORATION (CONTACT/OWNER)
A T & T WIRELESS SERVICES (5885 ROAD 148 in EARLIMART, CA)
CRITERIA AND HAZARDOUS AIR POLLUTANT INVENTORY (Inventory of air pollution sources) Business SIC classification: TELEPHONE COMMUNICATIONS, EXCEPT RADIOTELEPHONE
COMPLIANCE ACTIVITY (Tracking inspections of insecticide, fungicide, and rodenticide, and toxic substances)
FASTRIP OIL COMPANY (855 STATE ST in EARLIMART, CA)
CRITERIA AND HAZARDOUS AIR POLLUTANT INVENTORY (Inventory of air pollution sources) Business SIC classification: GASOLINE SERVICE STATIONS
CHEVRON USA INC (935 S STATE STREET in EARLIMART, CA)
CRITERIA AND HAZARDOUS AIR POLLUTANT INVENTORY (Inventory of air pollution sources) Business SIC classification: GASOLINE SERVICE STATIONS
Housing units lacking complete plumbing facilities: 2.7% Housing units lacking complete kitchen facilities: 1.7%
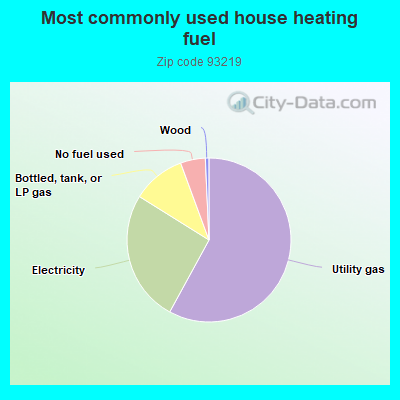
57.9%Utility gas
25.9%Electricity
10.5%Bottled, tank, or LP gas
4.9%No fuel used
0.7%Wood
Population in 1990: 11,963.
Place of birth for U.S.-born residents:
This state: 5,580
South: 48
West: 141
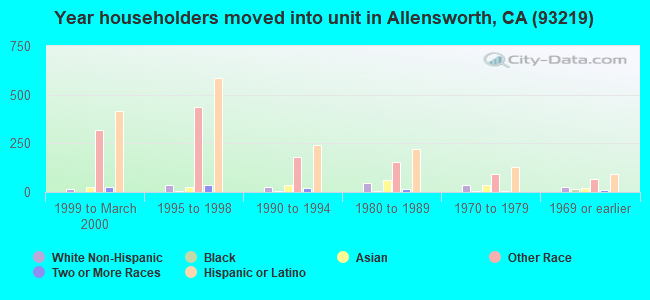
60% of the 93219 zip code residents lived in the same house 5 years ago. Out of people who lived in different houses, 74% lived in this county. Out of people who lived in different counties, 50% lived in California.
94% of the 93219 zip code residents lived in the same house 1 year ago. Out of people who lived in different houses, 36% moved from this county. Out of people who lived in different houses, 59% moved from different county within same state. Out of people who lived in different houses, 1% moved from different state. Out of people who lived in different houses, 11% moved from abroad.
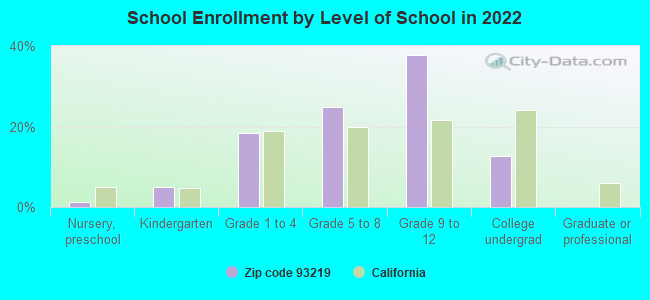
Private vs. public school enrollment:
Students in private schools in grades 1 to 8 (elementary and middle school):
Here:
0.0%
California:
10.5%
Students in private schools in grades 9 to 12 (high school): 11
Here:
1.1%
California:
8.5%
Students in private undergraduate colleges: 20
Here:
5.7%
California:
15.9%
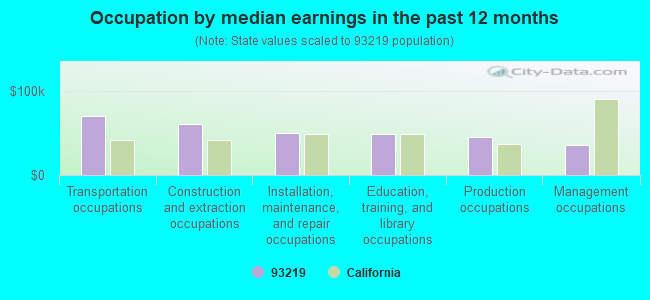
Occupation by median earnings in the past 12 months ($)
70,497Transportation occupations
60,394Construction and extraction occupations
49,487Installation, maintenance, and repair occupations
48,520Education, training, and library occupations
45,533Production occupations
36,040Management occupations
Companies with federal contracts located in this zip code:
G&F JANITORIAL (5217 RD 176 in EARLIMART, CA; small business) : $459,770 in 21 contractsfrom 2000 to 2006
Contracts for Landscaping/Groundskeeping Services, Custodial Janitorial Services by U.S. Army Corps of Engineers - civil program financing only, Army Signed by year:2000: $169,627; 2001: $76,232; 2002: $43,445; 2003: $0; 2004: $134,492; 2005: -$20,524; 2006: $56,498.
Biggest contracts:
$99,945 with U.S. Army Corps of Engineers - civil program financing only for Landscaping/Groundskeeping Services. Signed on 2000-11-30. Completion date: 2000-09-30.
$43,506 with U.S. Army Corps of Engineers - civil program financing only for Custodial Janitorial Services. Signed on 2004-01-08. Completion date: 2004-09-30.
$43,506 with Army for Custodial Janitorial Services. Signed on 2004-01-08. Completion date: 2004-09-30.
$43,445 with U.S. Army Corps of Engineers - civil program financing only for Custodial Janitorial Services. Signed on 2002-11-22. Completion date: 2003-09-30.
Top industries in this zip code by the number of employees in 2005:
Health Care and Social Assistance: All Other Outpatient Care Centers (20-49 employees: 1 establishment)
Construction: New Single-Family Housing Construction (except Operative Builders) (20-49: 1)
Other Services (except Public Administration): Coin-Operated Laundries and Drycleaners (10-19: 1)
Other Services (except Public Administration): General Automotive Repair (5-9: 1, 1-4: 1)
People in group quarters in 2000:
3 people in agriculture workers' dormitories on farms
Fatal accident statistics in 2014:
Fatal accident count: 2
Vehicles involved in fatal accidents: 3
Fatal accidents caused by drunken drivers: 1
Fatalities: 2
Persons involved in fatal accidents: 6
Pedestrians involved in fatal accidents: 0
Fatal accident statistics in 2013:
Fatal accident count: 2
Vehicles involved in fatal accidents: 2
Fatal accidents caused by drunken drivers: 0
Fatalities: 2
Persons involved in fatal accidents: 3
Pedestrians involved in fatal accidents: 2
Home Mortgage Disclosure Act Aggregated Statistics For Year 2009 (Based on 2 full and 4 partial tracts)
A) FHA, FSA/RHS & VA Home Purchase Loans
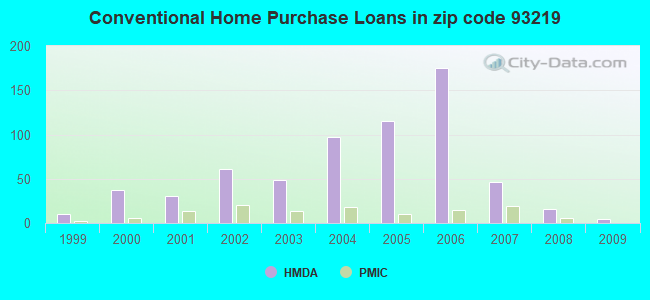
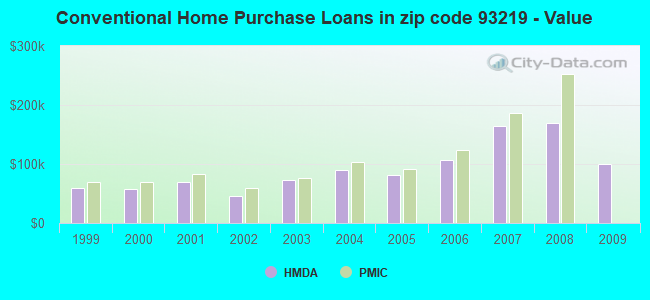
B) Conventional Home Purchase Loans
C) Refinancings
D) Home Improvement Loans
F) Non-occupant Loans on < 5 Family Dwellings (A B C & D)
G) Loans On Manufactured Home Dwelling (A B C & D)
Number
Average Value
Number
Average Value
Number
Average Value
Number
Average Value
Number
Average Value
Number
Average Value
LOANS ORIGINATED
30
$102,358
4
$99,690
28
$82,745
2
$32,360
5
$72,402
1
$182,550
APPLICATIONS APPROVED, NOT ACCEPTED
0
$0
0
$0
10
$72,345
0
$0
2
$191,000
0
$0
APPLICATIONS DENIED
7
$119,727
9
$84,647
80
$124,153
12
$59,857
2
$28,550
1
$131,700
APPLICATIONS WITHDRAWN
5
$90,356
0
$0
25
$94,701
1
$11,970
5
$73,230
0
$0
FILES CLOSED FOR INCOMPLETENESS
0
$0
0
$0
10
$159,228
1
$69,230
2
$350,000
0
$0
Aggregated Statistics For Year 2008 (Based on 2 full and 4 partial tracts)
A) FHA, FSA/RHS & VA Home Purchase Loans
B) Conventional Home Purchase Loans
C) Refinancings
D) Home Improvement Loans
F) Non-occupant Loans on < 5 Family Dwellings (A B C & D)
G) Loans On Manufactured Home Dwelling (A B C & D)
Number
Average Value
Number
Average Value
Number
Average Value
Number
Average Value
Number
Average Value
Number
Average Value
LOANS ORIGINATED
28
$181,381
16
$169,585
86
$112,218
26
$83,364
12
$100,587
1
$294,030
APPLICATIONS APPROVED, NOT ACCEPTED
1
$293,440
5
$216,288
36
$92,639
8
$104,360
3
$47,703
0
$0
APPLICATIONS DENIED
10
$131,030
16
$180,750
163
$126,263
55
$88,943
20
$126,764
8
$75,252
APPLICATIONS WITHDRAWN
6
$171,265
4
$96,680
33
$130,354
3
$53,293
3
$85,260
1
$54,400
FILES CLOSED FOR INCOMPLETENESS
4
$133,458
2
$230,055
11
$131,546
0
$0
0
$0
0
$0
Aggregated Statistics For Year 2007 (Based on 2 full and 4 partial tracts)
A) FHA, FSA/RHS & VA Home Purchase Loans
B) Conventional Home Purchase Loans
C) Refinancings
D) Home Improvement Loans
F) Non-occupant Loans on < 5 Family Dwellings (A B C & D)
G) Loans On Manufactured Home Dwelling (A B C & D)
Number
Average Value
Number
Average Value
Number
Average Value
Number
Average Value
Number
Average Value
Number
Average Value
LOANS ORIGINATED
4
$166,850
46
$165,210
258
$116,890
55
$93,592
38
$106,163
7
$126,329
APPLICATIONS APPROVED, NOT ACCEPTED
1
$217,580
34
$120,483
80
$126,527
8
$81,814
9
$98,757
0
$0
APPLICATIONS DENIED
1
$90,990
71
$132,902
268
$138,131
80
$86,044
23
$97,972
10
$86,702
APPLICATIONS WITHDRAWN
0
$0
22
$165,119
110
$121,458
33
$114,725
11
$117,046
5
$97,462
FILES CLOSED FOR INCOMPLETENESS
0
$0
9
$139,136
44
$139,844
6
$68,420
0
$0
1
$103,240
Aggregated Statistics For Year 2006 (Based on 2 full and 4 partial tracts)
A) FHA, FSA/RHS & VA Home Purchase Loans
B) Conventional Home Purchase Loans
C) Refinancings
D) Home Improvement Loans
F) Non-occupant Loans on < 5 Family Dwellings (A B C & D)
G) Loans On Manufactured Home Dwelling (A B C & D)
Number
Average Value
Number
Average Value
Number
Average Value
Number
Average Value
Number
Average Value
Number
Average Value
LOANS ORIGINATED
5
$129,950
175
$107,079
335
$115,157
57
$82,040
47
$123,126
6
$66,068
APPLICATIONS APPROVED, NOT ACCEPTED
0
$0
46
$107,902
92
$122,812
14
$112,479
15
$117,489
3
$126,303
APPLICATIONS DENIED
0
$0
141
$113,513
299
$128,112
134
$73,145
58
$106,779
9
$31,684
APPLICATIONS WITHDRAWN
3
$43,517
41
$102,936
188
$142,085
50
$83,167
11
$126,430
3
$43,517
FILES CLOSED FOR INCOMPLETENESS
0
$0
23
$95,849
33
$133,072
2
$88,150
0
$0
0
$0
Aggregated Statistics For Year 2005 (Based on 2 full and 4 partial tracts)
A) FHA, FSA/RHS & VA Home Purchase Loans
B) Conventional Home Purchase Loans
C) Refinancings
D) Home Improvement Loans
F) Non-occupant Loans on < 5 Family Dwellings (A B C & D)
G) Loans On Manufactured Home Dwelling (A B C & D)
Number
Average Value
Number
Average Value
Number
Average Value
Number
Average Value
Number
Average Value
Number
Average Value
LOANS ORIGINATED
5
$146,892
115
$81,599
317
$100,433
38
$81,192
44
$114,800
4
$105,772
APPLICATIONS APPROVED, NOT ACCEPTED
1
$157,630
29
$111,667
108
$89,014
8
$60,962
9
$124,847
2
$56,065
APPLICATIONS DENIED
3
$90,797
92
$105,255
340
$93,616
123
$73,656
36
$94,928
14
$89,927
APPLICATIONS WITHDRAWN
0
$0
36
$105,063
253
$106,607
62
$81,643
19
$120,006
4
$63,355
FILES CLOSED FOR INCOMPLETENESS
0
$0
3
$92,267
60
$103,218
8
$77,250
3
$138,937
0
$0
Aggregated Statistics For Year 2004 (Based on 2 full and 4 partial tracts)
A) FHA, FSA/RHS & VA Home Purchase Loans
B) Conventional Home Purchase Loans
C) Refinancings
D) Home Improvement Loans
E) Loans on Dwellings For 5+ Families
F) Non-occupant Loans on < 5 Family Dwellings (A B C & D)
G) Loans On Manufactured Home Dwelling (A B C & D)
Number
Average Value
Number
Average Value
Number
Average Value
Number
Average Value
Number
Average Value
Number
Average Value
Number
Average Value
LOANS ORIGINATED
33
$92,857
97
$90,143
184
$71,370
31
$50,520
0
$0
40
$78,892
6
$72,778
APPLICATIONS APPROVED, NOT ACCEPTED
0
$0
27
$85,553
57
$78,854
7
$53,811
0
$0
15
$64,711
7
$87,533
APPLICATIONS DENIED
4
$56,788
71
$80,401
335
$76,909
75
$48,298
2
$80,000
36
$70,462
16
$70,734
APPLICATIONS WITHDRAWN
5
$82,420
12
$60,908
174
$79,110
19
$45,436
0
$0
5
$55,972
4
$78,988
FILES CLOSED FOR INCOMPLETENESS
1
$87,030
5
$116,900
23
$78,013
1
$129,720
0
$0
6
$64,397
0
$0
Aggregated Statistics For Year 2003 (Based on 2 full and 4 partial tracts)
A) FHA, FSA/RHS & VA Home Purchase Loans
B) Conventional Home Purchase Loans
C) Refinancings
D) Home Improvement Loans
F) Non-occupant Loans on < 5 Family Dwellings (A B C & D)
Number
Average Value
Number
Average Value
Number
Average Value
Number
Average Value
Number
Average Value
LOANS ORIGINATED
36
$82,521
49
$72,294
205
$68,201
18
$8,355
21
$68,932
APPLICATIONS APPROVED, NOT ACCEPTED
2
$103,845
20
$72,730
40
$64,025
2
$18,625
10
$72,910
APPLICATIONS DENIED
1
$56,250
41
$74,001
269
$75,140
20
$26,685
30
$69,667
APPLICATIONS WITHDRAWN
1
$88,210
6
$89,877
130
$82,766
2
$9,565
9
$92,830
FILES CLOSED FOR INCOMPLETENESS
0
$0
0
$0
12
$66,428
0
$0
3
$91,290
Aggregated Statistics For Year 2002 (Based on 2 full and 4 partial tracts)
A) FHA, FSA/RHS & VA Home Purchase Loans
B) Conventional Home Purchase Loans
C) Refinancings
D) Home Improvement Loans
F) Non-occupant Loans on < 5 Family Dwellings (A B C & D)
Number
Average Value
Number
Average Value
Number
Average Value
Number
Average Value
Number
Average Value
LOANS ORIGINATED
57
$80,821
61
$46,189
134
$61,054
25
$10,726
19
$53,769
APPLICATIONS APPROVED, NOT ACCEPTED
3
$70,387
4
$125,735
21
$54,257
3
$4,803
4
$65,000
APPLICATIONS DENIED
2
$115,030
21
$73,424
134
$72,840
30
$14,187
7
$52,481
APPLICATIONS WITHDRAWN
2
$84,880
5
$51,696
67
$74,560
15
$10,855
5
$46,922
FILES CLOSED FOR INCOMPLETENESS
2
$78,000
5
$30,232
17
$54,818
0
$0
4
$19,000
Aggregated Statistics For Year 2001 (Based on 2 full and 4 partial tracts)
A) FHA, FSA/RHS & VA Home Purchase Loans
B) Conventional Home Purchase Loans
C) Refinancings
D) Home Improvement Loans
F) Non-occupant Loans on < 5 Family Dwellings (A B C & D)
Number
Average Value
Number
Average Value
Number
Average Value
Number
Average Value
Number
Average Value
LOANS ORIGINATED
55
$72,809
31
$70,112
130
$57,501
32
$13,382
15
$62,380
APPLICATIONS APPROVED, NOT ACCEPTED
0
$0
8
$39,435
9
$46,198
3
$17,823
4
$19,000
APPLICATIONS DENIED
6
$90,195
16
$73,597
197
$58,595
49
$12,338
5
$32,600
APPLICATIONS WITHDRAWN
8
$84,895
8
$50,376
75
$67,058
16
$19,736
3
$40,853
FILES CLOSED FOR INCOMPLETENESS
0
$0
1
$39,560
21
$59,132
3
$23,920
0
$0
Aggregated Statistics For Year 2000 (Based on 2 full and 4 partial tracts)
A) FHA, FSA/RHS & VA Home Purchase Loans
B) Conventional Home Purchase Loans
C) Refinancings
D) Home Improvement Loans
F) Non-occupant Loans on < 5 Family Dwellings (A B C & D)
Number
Average Value
Number
Average Value
Number
Average Value
Number
Average Value
Number
Average Value
LOANS ORIGINATED
59
$75,602
37
$57,465
42
$50,681
15
$23,603
11
$40,102
APPLICATIONS APPROVED, NOT ACCEPTED
2
$71,000
6
$51,853
22
$50,944
14
$23,217
1
$102,730
APPLICATIONS DENIED
4
$83,960
39
$62,122
126
$47,819
29
$20,553
7
$45,826
APPLICATIONS WITHDRAWN
2
$98,505
6
$79,485
35
$43,497
4
$9,700
1
$36,670
FILES CLOSED FOR INCOMPLETENESS
0
$0
0
$0
18
$39,794
0
$0
0
$0
Aggregated Statistics For Year 1999 (Based on 1 full and 2 partial tracts)
A) FHA, FSA/RHS & VA Home Purchase Loans
B) Conventional Home Purchase Loans
C) Refinancings
D) Home Improvement Loans
E) Loans on Dwellings For 5+ Families
F) Non-occupant Loans on < 5 Family Dwellings (A B C & D)
2005 - 2018 National Fire Incident Reporting System (NFIRS) incidents
According to the data from the years 2005 - 2018 the average number of fire incidents per year is 55. The highest number of reported fire incidents - 132 took place in 2017, and the least - 0 in 2010. The data has a dropping trend.
When looking into fire subcategories, the most incidents belonged to: Outside Fires (45.4%), and Mobile Property/Vehicle Fires (41.2%).
Fire incident types reported to NFIRS in Zip Code 93219


+$5,500
-$7,562
 Nearest zip codes: 93256, 93215, 93261, 93272, 93270, 93258.


 According to the data from the years 2005 - 2018 the average number of fire incidents per year is 55. The highest number of reported fire incidents - 132 took place in 2017, and the least - 0 in 2010. The data has a dropping trend.
 When looking into fire subcategories, the most incidents belonged to: Outside Fires (45.4%), and Mobile Property/Vehicle Fires (41.2%).