Earlimart, California Submit your own pictures of this place and show them to the world
OSM Map
General Map
Google Map
MSN Map
OSM Map
General Map
Google Map
MSN Map
OSM Map
General Map
Google Map
MSN Map
OSM Map
General Map
Google Map
MSN Map
Please wait while loading the map...
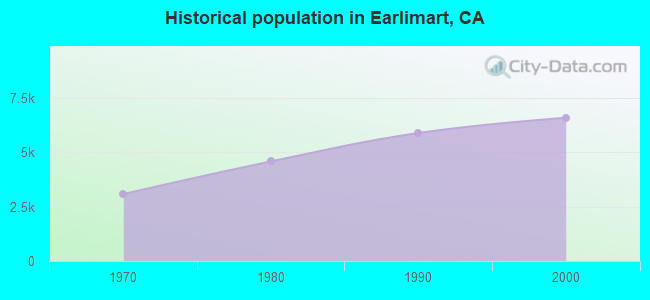
Population in 2010: 8,537. Population change since 2000: +29.7%Males: 4,100 Females: 4,437
March 2022 cost of living index in Earlimart: 88.7 (less than average, U.S. average is 100) Percentage of residents living in poverty in 2022: 16.1%for Hispanic or Latino residents , 100.0% for American Indian residents , 34.2% for other race residents , 11.4% for two or more races residents )Business Search - 14 Million verified businesses
Data:
Median household income ($)
Median household income (% change since 2000)
Household income diversity
Ratio of average income to average house value (%)
Ratio of average income to average rent
Median household income ($) - White
Median household income ($) - Black or African American
Median household income ($) - Asian
Median household income ($) - Hispanic or Latino
Median household income ($) - American Indian and Alaska Native
Median household income ($) - Multirace
Median household income ($) - Other Race
Median household income for houses/condos with a mortgage ($)
Median household income for apartments without a mortgage ($)
Races - White alone (%)
Races - White alone (% change since 2000)
Races - Black alone (%)
Races - Black alone (% change since 2000)
Races - American Indian alone (%)
Races - American Indian alone (% change since 2000)
Races - Asian alone (%)
Races - Asian alone (% change since 2000)
Races - Hispanic (%)
Races - Hispanic (% change since 2000)
Races - Native Hawaiian and Other Pacific Islander alone (%)
Races - Native Hawaiian and Other Pacific Islander alone (% change since 2000)
Races - Two or more races (%)
Races - Two or more races (% change since 2000)
Races - Other race alone (%)
Races - Other race alone (% change since 2000)
Racial diversity
Unemployment (%)
Unemployment (% change since 2000)
Unemployment (%) - White
Unemployment (%) - Black or African American
Unemployment (%) - Asian
Unemployment (%) - Hispanic or Latino
Unemployment (%) - American Indian and Alaska Native
Unemployment (%) - Multirace
Unemployment (%) - Other Race
Population density (people per square mile)
Population - Males (%)
Population - Females (%)
Population - Males (%) - White
Population - Males (%) - Black or African American
Population - Males (%) - Asian
Population - Males (%) - Hispanic or Latino
Population - Males (%) - American Indian and Alaska Native
Population - Males (%) - Multirace
Population - Males (%) - Other Race
Population - Females (%) - White
Population - Females (%) - Black or African American
Population - Females (%) - Asian
Population - Females (%) - Hispanic or Latino
Population - Females (%) - American Indian and Alaska Native
Population - Females (%) - Multirace
Population - Females (%) - Other Race
Coronavirus confirmed cases (Apr 27, 2024)
Deaths caused by coronavirus (Apr 27, 2024)
Coronavirus confirmed cases (per 100k population) (Apr 27, 2024)
Deaths caused by coronavirus (per 100k population) (Apr 27, 2024)
Daily increase in number of cases (Apr 27, 2024)
Weekly increase in number of cases (Apr 27, 2024)
Cases doubled (in days) (Apr 27, 2024)
Hospitalized patients (Apr 18, 2022)
Negative test results (Apr 18, 2022)
Total test results (Apr 18, 2022)
COVID Vaccine doses distributed (per 100k population) (Sep 19, 2023)
COVID Vaccine doses administered (per 100k population) (Sep 19, 2023)
COVID Vaccine doses distributed (Sep 19, 2023)
COVID Vaccine doses administered (Sep 19, 2023)
Likely homosexual households (%)
Likely homosexual households (% change since 2000)
Likely homosexual households - Lesbian couples (%)
Likely homosexual households - Lesbian couples (% change since 2000)
Likely homosexual households - Gay men (%)
Likely homosexual households - Gay men (% change since 2000)
Cost of living index
Median gross rent ($)
Median contract rent ($)
Median monthly housing costs ($)
Median house or condo value ($)
Median house or condo value ($ change since 2000)
Mean house or condo value by units in structure - 1, detached ($)
Mean house or condo value by units in structure - 1, attached ($)
Mean house or condo value by units in structure - 2 ($)
Mean house or condo value by units in structure by units in structure - 3 or 4 ($)
Mean house or condo value by units in structure - 5 or more ($)
Mean house or condo value by units in structure - Boat, RV, van, etc. ($)
Mean house or condo value by units in structure - Mobile home ($)
Median house or condo value ($) - White
Median house or condo value ($) - Black or African American
Median house or condo value ($) - Asian
Median house or condo value ($) - Hispanic or Latino
Median house or condo value ($) - American Indian and Alaska Native
Median house or condo value ($) - Multirace
Median house or condo value ($) - Other Race
Median resident age
Resident age diversity
Median resident age - Males
Median resident age - Females
Median resident age - White
Median resident age - Black or African American
Median resident age - Asian
Median resident age - Hispanic or Latino
Median resident age - American Indian and Alaska Native
Median resident age - Multirace
Median resident age - Other Race
Median resident age - Males - White
Median resident age - Males - Black or African American
Median resident age - Males - Asian
Median resident age - Males - Hispanic or Latino
Median resident age - Males - American Indian and Alaska Native
Median resident age - Males - Multirace
Median resident age - Males - Other Race
Median resident age - Females - White
Median resident age - Females - Black or African American
Median resident age - Females - Asian
Median resident age - Females - Hispanic or Latino
Median resident age - Females - American Indian and Alaska Native
Median resident age - Females - Multirace
Median resident age - Females - Other Race
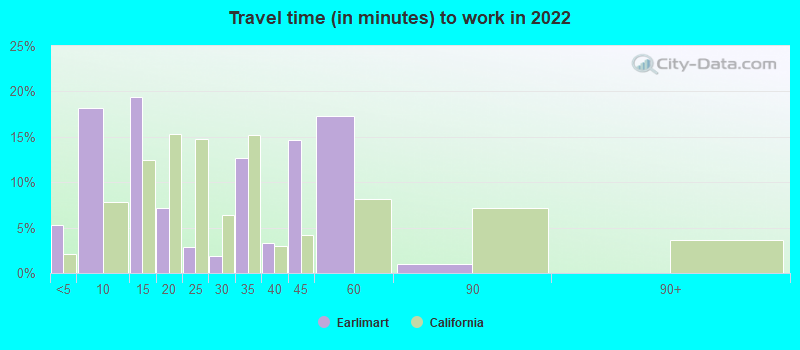
Commute - mean travel time to work (minutes)
Travel time to work - Less than 5 minutes (%)
Travel time to work - Less than 5 minutes (% change since 2000)
Travel time to work - 5 to 9 minutes (%)
Travel time to work - 5 to 9 minutes (% change since 2000)
Travel time to work - 10 to 19 minutes (%)
Travel time to work - 10 to 19 minutes (% change since 2000)
Travel time to work - 20 to 29 minutes (%)
Travel time to work - 20 to 29 minutes (% change since 2000)
Travel time to work - 30 to 39 minutes (%)
Travel time to work - 30 to 39 minutes (% change since 2000)
Travel time to work - 40 to 59 minutes (%)
Travel time to work - 40 to 59 minutes (% change since 2000)
Travel time to work - 60 to 89 minutes (%)
Travel time to work - 60 to 89 minutes (% change since 2000)
Travel time to work - 90 or more minutes (%)
Travel time to work - 90 or more minutes (% change since 2000)
Marital status - Never married (%)
Marital status - Now married (%)
Marital status - Separated (%)
Marital status - Widowed (%)
Marital status - Divorced (%)
Median family income ($)
Median family income (% change since 2000)
Median non-family income ($)
Median non-family income (% change since 2000)
Median per capita income ($)
Median per capita income (% change since 2000)
Median family income ($) - White
Median family income ($) - Black or African American
Median family income ($) - Asian
Median family income ($) - Hispanic or Latino
Median family income ($) - American Indian and Alaska Native
Median family income ($) - Multirace
Median family income ($) - Other Race
Median year house/condo built
Median year apartment built
Year house built - Built 2005 or later (%)
Year house built - Built 2000 to 2004 (%)
Year house built - Built 1990 to 1999 (%)
Year house built - Built 1980 to 1989 (%)
Year house built - Built 1970 to 1979 (%)
Year house built - Built 1960 to 1969 (%)
Year house built - Built 1950 to 1959 (%)
Year house built - Built 1940 to 1949 (%)
Year house built - Built 1939 or earlier (%)
Average household size
Household density (households per square mile)
Average household size - White
Average household size - Black or African American
Average household size - Asian
Average household size - Hispanic or Latino
Average household size - American Indian and Alaska Native
Average household size - Multirace
Average household size - Other Race
Occupied housing units (%)
Vacant housing units (%)
Owner occupied housing units (%)
Renter occupied housing units (%)
Vacancy status - For rent (%)
Vacancy status - For sale only (%)
Vacancy status - Rented or sold, not occupied (%)
Vacancy status - For seasonal, recreational, or occasional use (%)
Vacancy status - For migrant workers (%)
Vacancy status - Other vacant (%)
Residents with income below the poverty level (%)
Residents with income below 50% of the poverty level (%)
Children below poverty level (%)
Poor families by family type - Married-couple family (%)
Poor families by family type - Male, no wife present (%)
Poor families by family type - Female, no husband present (%)
Poverty status for native-born residents (%)
Poverty status for foreign-born residents (%)
Poverty among high school graduates not in families (%)
Poverty among people who did not graduate high school not in families (%)
Residents with income below the poverty level (%) - White
Residents with income below the poverty level (%) - Black or African American
Residents with income below the poverty level (%) - Asian
Residents with income below the poverty level (%) - Hispanic or Latino
Residents with income below the poverty level (%) - American Indian and Alaska Native
Residents with income below the poverty level (%) - Multirace
Residents with income below the poverty level (%) - Other Race
Air pollution - Air Quality Index (AQI)
Air pollution - CO
Air pollution - NO2
Air pollution - SO2
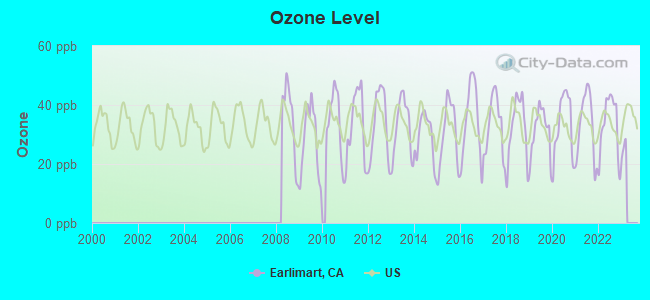
Air pollution - Ozone
Air pollution - PM10
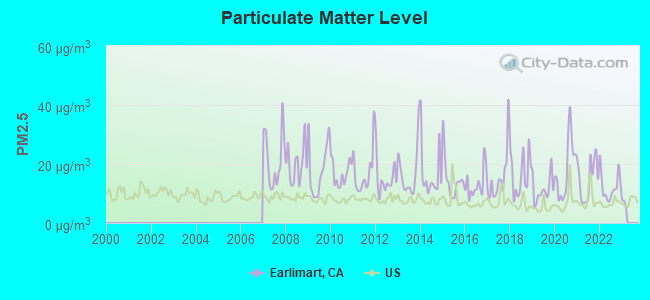
Air pollution - PM25
Air pollution - Pb
Crime - Murders per 100,000 population
Crime - Rapes per 100,000 population
Crime - Robberies per 100,000 population
Crime - Assaults per 100,000 population
Crime - Burglaries per 100,000 population
Crime - Thefts per 100,000 population
Crime - Auto thefts per 100,000 population
Crime - Arson per 100,000 population
Crime - City-data.com crime index
Crime - Violent crime index
Crime - Property crime index
Crime - Murders per 100,000 population (5 year average)
Crime - Rapes per 100,000 population (5 year average)
Crime - Robberies per 100,000 population (5 year average)
Crime - Assaults per 100,000 population (5 year average)
Crime - Burglaries per 100,000 population (5 year average)
Crime - Thefts per 100,000 population (5 year average)
Crime - Auto thefts per 100,000 population (5 year average)
Crime - Arson per 100,000 population (5 year average)
Crime - City-data.com crime index (5 year average)
Crime - Violent crime index (5 year average)
Crime - Property crime index (5 year average)
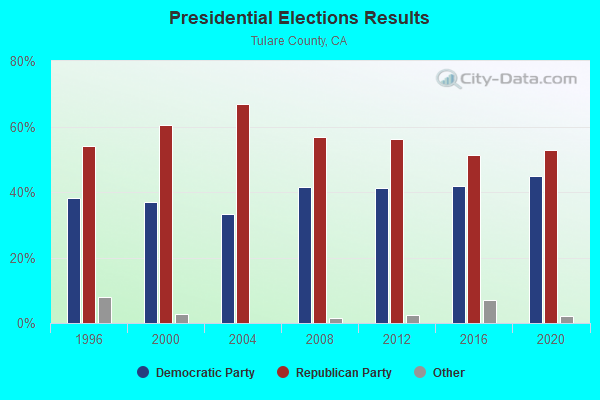
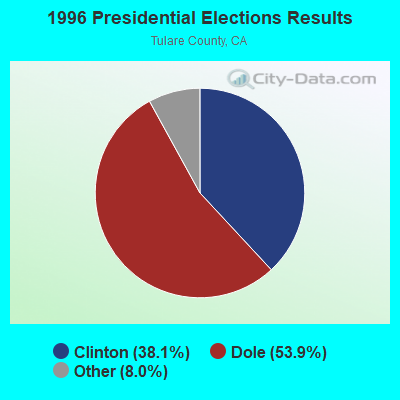
1996 Presidential Elections Results (%) - Democratic Party (Clinton)
1996 Presidential Elections Results (%) - Republican Party (Dole)
1996 Presidential Elections Results (%) - Other
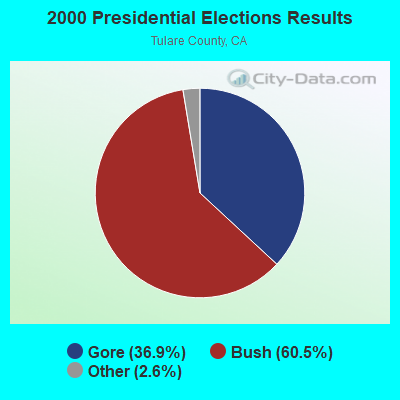
2000 Presidential Elections Results (%) - Democratic Party (Gore)
2000 Presidential Elections Results (%) - Republican Party (Bush)
2000 Presidential Elections Results (%) - Other
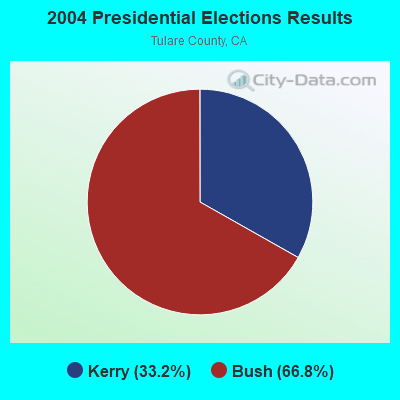
2004 Presidential Elections Results (%) - Democratic Party (Kerry)
2004 Presidential Elections Results (%) - Republican Party (Bush)
2004 Presidential Elections Results (%) - Other
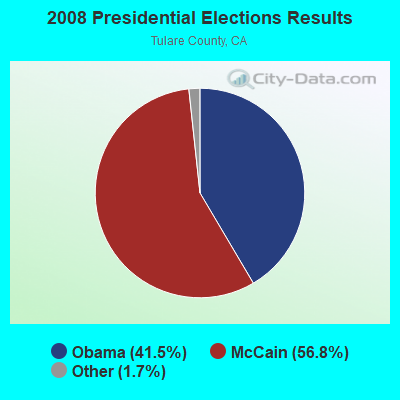
2008 Presidential Elections Results (%) - Democratic Party (Obama)
2008 Presidential Elections Results (%) - Republican Party (McCain)
2008 Presidential Elections Results (%) - Other
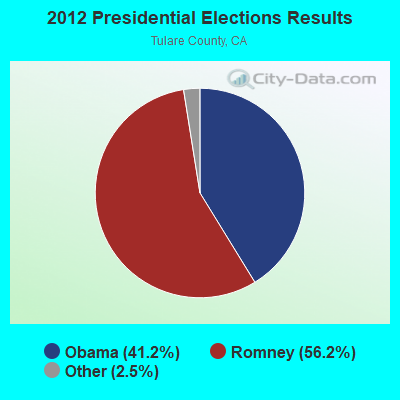
2012 Presidential Elections Results (%) - Democratic Party (Obama)
2012 Presidential Elections Results (%) - Republican Party (Romney)
2012 Presidential Elections Results (%) - Other
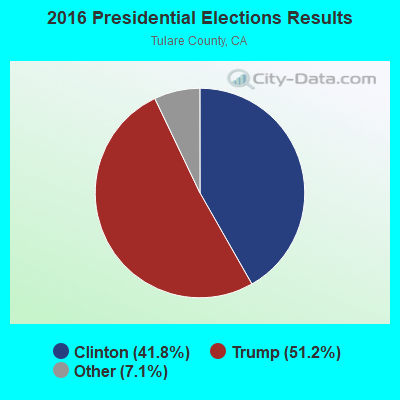
2016 Presidential Elections Results (%) - Democratic Party (Clinton)
2016 Presidential Elections Results (%) - Republican Party (Trump)
2016 Presidential Elections Results (%) - Other
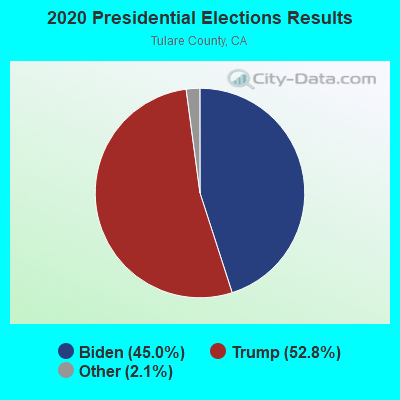
2020 Presidential Elections Results (%) - Democratic Party (Biden)
2020 Presidential Elections Results (%) - Republican Party (Trump)
2020 Presidential Elections Results (%) - Other
Ancestries Reported - Arab (%)
Ancestries Reported - Czech (%)
Ancestries Reported - Danish (%)
Ancestries Reported - Dutch (%)
Ancestries Reported - English (%)
Ancestries Reported - French (%)
Ancestries Reported - French Canadian (%)
Ancestries Reported - German (%)
Ancestries Reported - Greek (%)
Ancestries Reported - Hungarian (%)
Ancestries Reported - Irish (%)
Ancestries Reported - Italian (%)
Ancestries Reported - Lithuanian (%)
Ancestries Reported - Norwegian (%)
Ancestries Reported - Polish (%)
Ancestries Reported - Portuguese (%)
Ancestries Reported - Russian (%)
Ancestries Reported - Scotch-Irish (%)
Ancestries Reported - Scottish (%)
Ancestries Reported - Slovak (%)
Ancestries Reported - Subsaharan African (%)
Ancestries Reported - Swedish (%)
Ancestries Reported - Swiss (%)
Ancestries Reported - Ukrainian (%)
Ancestries Reported - United States (%)
Ancestries Reported - Welsh (%)
Ancestries Reported - West Indian (%)
Ancestries Reported - Other (%)
Educational Attainment - No schooling completed (%)
Educational Attainment - Less than high school (%)
Educational Attainment - High school or equivalent (%)
Educational Attainment - Less than 1 year of college (%)
Educational Attainment - 1 or more years of college (%)
Educational Attainment - Associate degree (%)
Educational Attainment - Bachelor's degree (%)
Educational Attainment - Master's degree (%)
Educational Attainment - Professional school degree (%)
Educational Attainment - Doctorate degree (%)
School Enrollment - Nursery, preschool (%)
School Enrollment - Kindergarten (%)
School Enrollment - Grade 1 to 4 (%)
School Enrollment - Grade 5 to 8 (%)
School Enrollment - Grade 9 to 12 (%)
School Enrollment - College undergrad (%)
School Enrollment - Graduate or professional (%)
School Enrollment - Not enrolled in school (%)
School enrollment - Public schools (%)
School enrollment - Private schools (%)
School enrollment - Not enrolled (%)
Median number of rooms in houses and condos
Median number of rooms in apartments
Housing units lacking complete plumbing facilities (%)
Housing units lacking complete kitchen facilities (%)
Density of houses
Urban houses (%)
Rural houses (%)
Households with people 60 years and over (%)
Households with people 65 years and over (%)
Households with people 75 years and over (%)
Households with one or more nonrelatives (%)
Households with no nonrelatives (%)
Population in households (%)
Family households (%)
Nonfamily households (%)
Population in families (%)
Family households with own children (%)
Median number of bedrooms in owner occupied houses
Mean number of bedrooms in owner occupied houses
Median number of bedrooms in renter occupied houses
Mean number of bedrooms in renter occupied houses
Median number of vehichles in owner occupied houses
Mean number of vehichles in owner occupied houses
Median number of vehichles in renter occupied houses
Mean number of vehichles in renter occupied houses
Mortgage status - with mortgage (%)
Mortgage status - with second mortgage (%)
Mortgage status - with home equity loan (%)
Mortgage status - with both second mortgage and home equity loan (%)
Mortgage status - without a mortgage (%)
Average family size
Average family size - White
Average family size - Black or African American
Average family size - Asian
Average family size - Hispanic or Latino
Average family size - American Indian and Alaska Native
Average family size - Multirace
Average family size - Other Race
Geographical mobility - Same house 1 year ago (%)
Geographical mobility - Moved within same county (%)
Geographical mobility - Moved from different county within same state (%)
Geographical mobility - Moved from different state (%)
Geographical mobility - Moved from abroad (%)
Place of birth - Born in state of residence (%)
Place of birth - Born in other state (%)
Place of birth - Native, outside of US (%)
Place of birth - Foreign born (%)
Housing units in structures - 1, detached (%)
Housing units in structures - 1, attached (%)
Housing units in structures - 2 (%)
Housing units in structures - 3 or 4 (%)
Housing units in structures - 5 to 9 (%)
Housing units in structures - 10 to 19 (%)
Housing units in structures - 20 to 49 (%)
Housing units in structures - 50 or more (%)
Housing units in structures - Mobile home (%)
Housing units in structures - Boat, RV, van, etc. (%)
House/condo owner moved in on average (years ago)
Renter moved in on average (years ago)
Year householder moved into unit - Moved in 1999 to March 2000 (%)
Year householder moved into unit - Moved in 1995 to 1998 (%)
Year householder moved into unit - Moved in 1990 to 1994 (%)
Year householder moved into unit - Moved in 1980 to 1989 (%)
Year householder moved into unit - Moved in 1970 to 1979 (%)
Year householder moved into unit - Moved in 1969 or earlier (%)
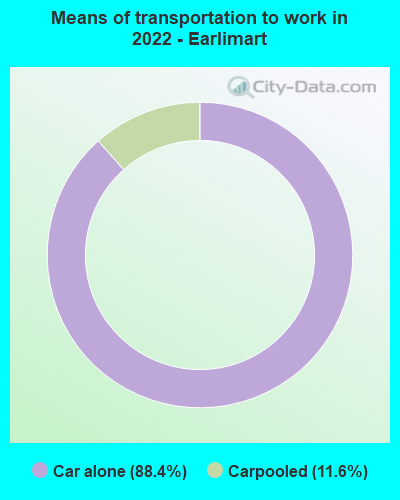
Means of transportation to work - Drove car alone (%)
Means of transportation to work - Carpooled (%)
Means of transportation to work - Public transportation (%)
Means of transportation to work - Bus or trolley bus (%)
Means of transportation to work - Streetcar or trolley car (%)
Means of transportation to work - Subway or elevated (%)
Means of transportation to work - Railroad (%)
Means of transportation to work - Ferryboat (%)
Means of transportation to work - Taxicab (%)
Means of transportation to work - Motorcycle (%)
Means of transportation to work - Bicycle (%)
Means of transportation to work - Walked (%)
Means of transportation to work - Other means (%)
Working at home (%)
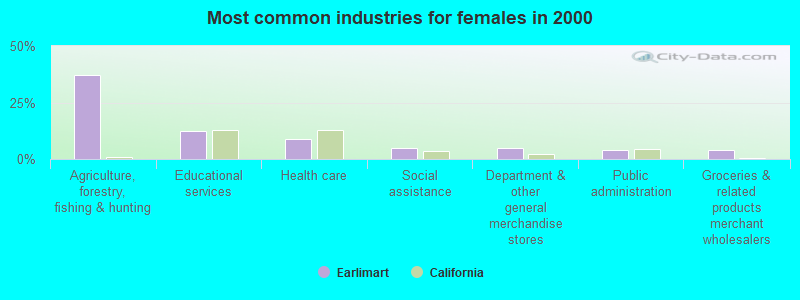
Industry diversity
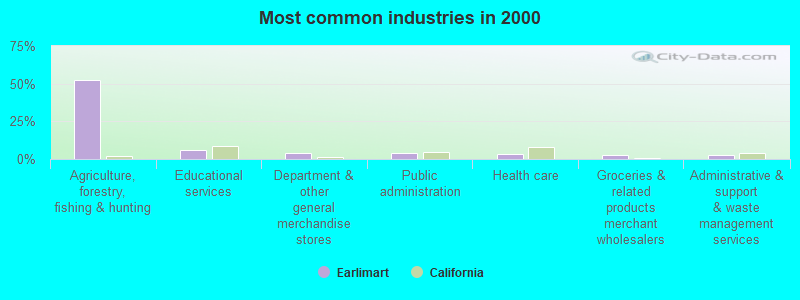
Most Common Industries - Agriculture, forestry, fishing and hunting, and mining (%)
Most Common Industries - Agriculture, forestry, fishing and hunting (%)
Most Common Industries - Mining, quarrying, and oil and gas extraction (%)
Most Common Industries - Construction (%)
Most Common Industries - Manufacturing (%)
Most Common Industries - Wholesale trade (%)
Most Common Industries - Retail trade (%)
Most Common Industries - Transportation and warehousing, and utilities (%)
Most Common Industries - Transportation and warehousing (%)
Most Common Industries - Utilities (%)
Most Common Industries - Information (%)
Most Common Industries - Finance and insurance, and real estate and rental and leasing (%)
Most Common Industries - Finance and insurance (%)
Most Common Industries - Real estate and rental and leasing (%)
Most Common Industries - Professional, scientific, and management, and administrative and waste management services (%)
Most Common Industries - Professional, scientific, and technical services (%)
Most Common Industries - Management of companies and enterprises (%)
Most Common Industries - Administrative and support and waste management services (%)
Most Common Industries - Educational services, and health care and social assistance (%)
Most Common Industries - Educational services (%)
Most Common Industries - Health care and social assistance (%)
Most Common Industries - Arts, entertainment, and recreation, and accommodation and food services (%)
Most Common Industries - Arts, entertainment, and recreation (%)
Most Common Industries - Accommodation and food services (%)
Most Common Industries - Other services, except public administration (%)
Most Common Industries - Public administration (%)
Occupation diversity
Most Common Occupations - Management, business, science, and arts occupations (%)
Most Common Occupations - Management, business, and financial occupations (%)
Most Common Occupations - Management occupations (%)
Most Common Occupations - Business and financial operations occupations (%)
Most Common Occupations - Computer, engineering, and science occupations (%)
Most Common Occupations - Computer and mathematical occupations (%)
Most Common Occupations - Architecture and engineering occupations (%)
Most Common Occupations - Life, physical, and social science occupations (%)
Most Common Occupations - Education, legal, community service, arts, and media occupations (%)
Most Common Occupations - Community and social service occupations (%)
Most Common Occupations - Legal occupations (%)
Most Common Occupations - Education, training, and library occupations (%)
Most Common Occupations - Arts, design, entertainment, sports, and media occupations (%)
Most Common Occupations - Healthcare practitioners and technical occupations (%)
Most Common Occupations - Health diagnosing and treating practitioners and other technical occupations (%)
Most Common Occupations - Health technologists and technicians (%)
Most Common Occupations - Service occupations (%)
Most Common Occupations - Healthcare support occupations (%)
Most Common Occupations - Protective service occupations (%)
Most Common Occupations - Fire fighting and prevention, and other protective service workers including supervisors (%)
Most Common Occupations - Law enforcement workers including supervisors (%)
Most Common Occupations - Food preparation and serving related occupations (%)
Most Common Occupations - Building and grounds cleaning and maintenance occupations (%)
Most Common Occupations - Personal care and service occupations (%)
Most Common Occupations - Sales and office occupations (%)
Most Common Occupations - Sales and related occupations (%)
Most Common Occupations - Office and administrative support occupations (%)
Most Common Occupations - Natural resources, construction, and maintenance occupations (%)
Most Common Occupations - Farming, fishing, and forestry occupations (%)
Most Common Occupations - Construction and extraction occupations (%)
Most Common Occupations - Installation, maintenance, and repair occupations (%)
Most Common Occupations - Production, transportation, and material moving occupations (%)
Most Common Occupations - Production occupations (%)
Most Common Occupations - Transportation occupations (%)
Most Common Occupations - Material moving occupations (%)
People in Group quarters - Institutionalized population (%)
People in Group quarters - Correctional institutions (%)
People in Group quarters - Federal prisons and detention centers (%)
People in Group quarters - Halfway houses (%)
People in Group quarters - Local jails and other confinement facilities (including police lockups) (%)
People in Group quarters - Military disciplinary barracks (%)
People in Group quarters - State prisons (%)
People in Group quarters - Other types of correctional institutions (%)
People in Group quarters - Nursing homes (%)
People in Group quarters - Hospitals/wards, hospices, and schools for the handicapped (%)
People in Group quarters - Hospitals/wards and hospices for chronically ill (%)
People in Group quarters - Hospices or homes for chronically ill (%)
People in Group quarters - Military hospitals or wards for chronically ill (%)
People in Group quarters - Other hospitals or wards for chronically ill (%)
People in Group quarters - Hospitals or wards for drug/alcohol abuse (%)
People in Group quarters - Mental (Psychiatric) hospitals or wards (%)
People in Group quarters - Schools, hospitals, or wards for the mentally retarded (%)
People in Group quarters - Schools, hospitals, or wards for the physically handicapped (%)
People in Group quarters - Institutions for the deaf (%)
People in Group quarters - Institutions for the blind (%)
People in Group quarters - Orthopedic wards and institutions for the physically handicapped (%)
People in Group quarters - Wards in general hospitals for patients who have no usual home elsewhere (%)
People in Group quarters - Wards in military hospitals for patients who have no usual home elsewhere (%)
People in Group quarters - Juvenile institutions (%)
People in Group quarters - Long-term care (%)
People in Group quarters - Homes for abused, dependent, and neglected children (%)
People in Group quarters - Residential treatment centers for emotionally disturbed children (%)
People in Group quarters - Training schools for juvenile delinquents (%)
People in Group quarters - Short-term care, detention or diagnostic centers for delinquent children (%)
People in Group quarters - Type of juvenile institution unknown (%)
People in Group quarters - Noninstitutionalized population (%)
People in Group quarters - College dormitories (includes college quarters off campus) (%)
People in Group quarters - Military quarters (%)
People in Group quarters - On base (%)
People in Group quarters - Barracks, unaccompanied personnel housing (UPH), (Enlisted/Officer), ;and similar group living quarters for military personnel (%)
People in Group quarters - Transient quarters for temporary residents (%)
People in Group quarters - Military ships (%)
People in Group quarters - Group homes (%)
People in Group quarters - Homes or halfway houses for drug/alcohol abuse (%)
People in Group quarters - Homes for the mentally ill (%)
People in Group quarters - Homes for the mentally retarded (%)
People in Group quarters - Homes for the physically handicapped (%)
People in Group quarters - Other group homes (%)
People in Group quarters - Religious group quarters (%)
People in Group quarters - Dormitories (%)
People in Group quarters - Agriculture workers' dormitories on farms (%)
People in Group quarters - Job Corps and vocational training facilities (%)
People in Group quarters - Other workers' dormitories (%)
People in Group quarters - Crews of maritime vessels (%)
People in Group quarters - Other nonhousehold living situations (%)
People in Group quarters - Other noninstitutional group quarters (%)
Residents speaking English at home (%)
Residents speaking English at home - Born in the United States (%)
Residents speaking English at home - Native, born elsewhere (%)
Residents speaking English at home - Foreign born (%)
Residents speaking Spanish at home (%)
Residents speaking Spanish at home - Born in the United States (%)
Residents speaking Spanish at home - Native, born elsewhere (%)
Residents speaking Spanish at home - Foreign born (%)
Residents speaking other language at home (%)
Residents speaking other language at home - Born in the United States (%)
Residents speaking other language at home - Native, born elsewhere (%)
Residents speaking other language at home - Foreign born (%)
Class of Workers - Employee of private company (%)
Class of Workers - Self-employed in own incorporated business (%)
Class of Workers - Private not-for-profit wage and salary workers (%)
Class of Workers - Local government workers (%)
Class of Workers - State government workers (%)
Class of Workers - Federal government workers (%)
Class of Workers - Self-employed workers in own not incorporated business and Unpaid family workers (%)
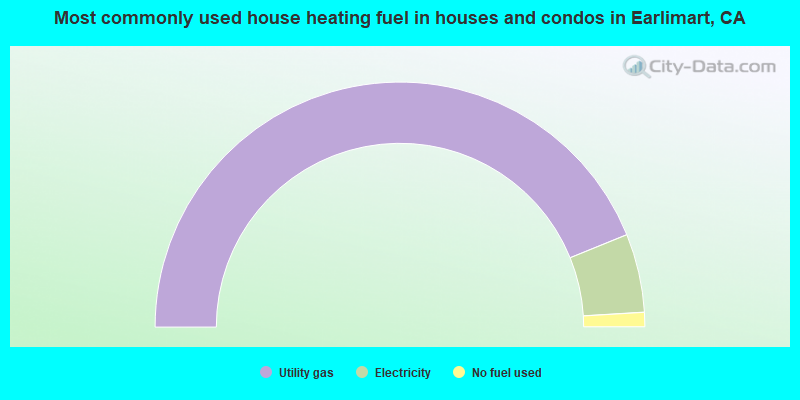
House heating fuel used in houses and condos - Utility gas (%)
House heating fuel used in houses and condos - Bottled, tank, or LP gas (%)
House heating fuel used in houses and condos - Electricity (%)
House heating fuel used in houses and condos - Fuel oil, kerosene, etc. (%)
House heating fuel used in houses and condos - Coal or coke (%)
House heating fuel used in houses and condos - Wood (%)
House heating fuel used in houses and condos - Solar energy (%)
House heating fuel used in houses and condos - Other fuel (%)
House heating fuel used in houses and condos - No fuel used (%)
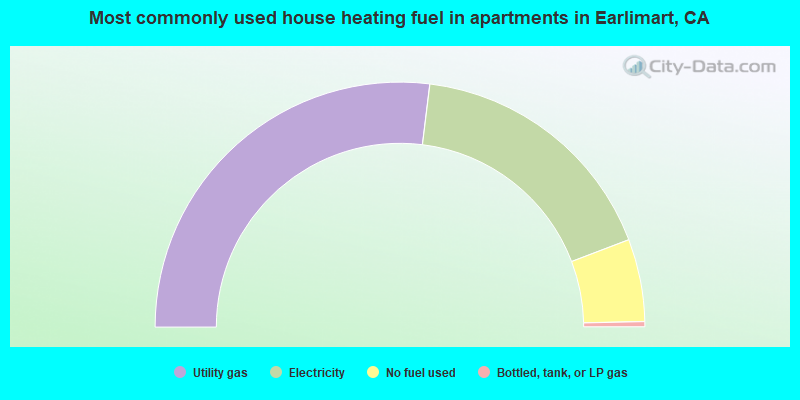
House heating fuel used in apartments - Utility gas (%)
House heating fuel used in apartments - Bottled, tank, or LP gas (%)
House heating fuel used in apartments - Electricity (%)
House heating fuel used in apartments - Fuel oil, kerosene, etc. (%)
House heating fuel used in apartments - Coal or coke (%)
House heating fuel used in apartments - Wood (%)
House heating fuel used in apartments - Solar energy (%)
House heating fuel used in apartments - Other fuel (%)
House heating fuel used in apartments - No fuel used (%)
Armed forces status - In Armed Forces (%)
Armed forces status - Civilian (%)
Armed forces status - Civilian - Veteran (%)
Armed forces status - Civilian - Nonveteran (%)
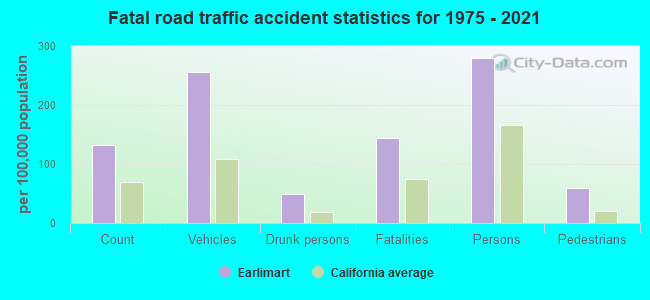
Fatal accidents locations in years 2005-2021
Fatal accidents locations in 2005
Fatal accidents locations in 2006
Fatal accidents locations in 2007
Fatal accidents locations in 2008
Fatal accidents locations in 2009
Fatal accidents locations in 2010
Fatal accidents locations in 2011
Fatal accidents locations in 2012
Fatal accidents locations in 2013
Fatal accidents locations in 2014
Fatal accidents locations in 2015
Fatal accidents locations in 2016
Fatal accidents locations in 2017
Fatal accidents locations in 2018
Fatal accidents locations in 2019
Fatal accidents locations in 2020
Fatal accidents locations in 2021
Alcohol use - People drinking some alcohol every month (%)
Alcohol use - People not drinking at all (%)
Alcohol use - Average days/month drinking alcohol
Alcohol use - Average drinks/week
Alcohol use - Average days/year people drink much
Audiometry - Average condition of hearing (%)
Audiometry - People that can hear a whisper from across a quiet room (%)
Audiometry - People that can hear normal voice from across a quiet room (%)
Audiometry - Ears ringing, roaring, buzzing (%)
Audiometry - Had a job exposure to loud noise (%)
Audiometry - Had off-work exposure to loud noise (%)
Blood Pressure & Cholesterol - Has high blood pressure (%)
Blood Pressure & Cholesterol - Checking blood pressure at home (%)
Blood Pressure & Cholesterol - Frequently checking blood cholesterol (%)
Blood Pressure & Cholesterol - Has high cholesterol level (%)
Consumer Behavior - Money monthly spent on food at supermarket/grocery store
Consumer Behavior - Money monthly spent on food at other stores
Consumer Behavior - Money monthly spent on eating out
Consumer Behavior - Money monthly spent on carryout/delivered foods
Consumer Behavior - Income spent on food at supermarket/grocery store (%)
Consumer Behavior - Income spent on food at other stores (%)
Consumer Behavior - Income spent on eating out (%)
Consumer Behavior - Income spent on carryout/delivered foods (%)
Current Health Status - General health condition (%)
Current Health Status - Blood donors (%)
Current Health Status - Has blood ever tested for HIV virus (%)
Current Health Status - Left-handed people (%)
Dermatology - People using sunscreen (%)
Diabetes - Diabetics (%)
Diabetes - Had a blood test for high blood sugar (%)
Diabetes - People taking insulin (%)
Diet Behavior & Nutrition - Diet health (%)
Diet Behavior & Nutrition - Milk product consumption (# of products/month)
Diet Behavior & Nutrition - Meals not home prepared (#/week)
Diet Behavior & Nutrition - Meals from fast food or pizza place (#/week)
Diet Behavior & Nutrition - Ready-to-eat foods (#/month)
Diet Behavior & Nutrition - Frozen meals/pizza (#/month)
Drug Use - People that ever used marijuana or hashish (%)
Drug Use - Ever used hard drugs (%)
Drug Use - Ever used any form of cocaine (%)
Drug Use - Ever used heroin (%)
Drug Use - Ever used methamphetamine (%)
Health Insurance - People covered by health insurance (%)
Kidney Conditions-Urology - Avg. # of times urinating at night
Medical Conditions - People with asthma (%)
Medical Conditions - People with anemia (%)
Medical Conditions - People with psoriasis (%)
Medical Conditions - People with overweight (%)
Medical Conditions - Elderly people having difficulties in thinking or remembering (%)
Medical Conditions - People who ever received blood transfusion (%)
Medical Conditions - People having trouble seeing even with glass/contacts (%)
Medical Conditions - People with arthritis (%)
Medical Conditions - People with gout (%)
Medical Conditions - People with congestive heart failure (%)
Medical Conditions - People with coronary heart disease (%)
Medical Conditions - People with angina pectoris (%)
Medical Conditions - People who ever had heart attack (%)
Medical Conditions - People who ever had stroke (%)
Medical Conditions - People with emphysema (%)
Medical Conditions - People with thyroid problem (%)
Medical Conditions - People with chronic bronchitis (%)
Medical Conditions - People with any liver condition (%)
Medical Conditions - People who ever had cancer or malignancy (%)
Mental Health - People who have little interest in doing things (%)
Mental Health - People feeling down, depressed, or hopeless (%)
Mental Health - People who have trouble sleeping or sleeping too much (%)
Mental Health - People feeling tired or having little energy (%)
Mental Health - People with poor appetite or overeating (%)
Mental Health - People feeling bad about themself (%)
Mental Health - People who have trouble concentrating on things (%)
Mental Health - People moving or speaking slowly or too fast (%)
Mental Health - People having thoughts they would be better off dead (%)
Oral Health - Average years since last visit a dentist
Oral Health - People embarrassed because of mouth (%)
Oral Health - People with gum disease (%)
Oral Health - General health of teeth and gums (%)
Oral Health - Average days a week using dental floss/device
Oral Health - Average days a week using mouthwash for dental problem
Oral Health - Average number of teeth
Pesticide Use - Households using pesticides to control insects (%)
Pesticide Use - Households using pesticides to kill weeds (%)
Physical Activity - People doing vigorous-intensity work activities (%)
Physical Activity - People doing moderate-intensity work activities (%)
Physical Activity - People walking or bicycling (%)
Physical Activity - People doing vigorous-intensity recreational activities (%)
Physical Activity - People doing moderate-intensity recreational activities (%)
Physical Activity - Average hours a day doing sedentary activities
Physical Activity - Average hours a day watching TV or videos
Physical Activity - Average hours a day using computer
Physical Functioning - People having limitations keeping them from working (%)
Physical Functioning - People limited in amount of work they can do (%)
Physical Functioning - People that need special equipment to walk (%)
Physical Functioning - People experiencing confusion/memory problems (%)
Physical Functioning - People requiring special healthcare equipment (%)
Prescription Medications - Average number of prescription medicines taking
Preventive Aspirin Use - Adults 40+ taking low-dose aspirin (%)
Reproductive Health - Vaginal deliveries (%)
Reproductive Health - Cesarean deliveries (%)
Reproductive Health - Deliveries resulted in a live birth (%)
Reproductive Health - Pregnancies resulted in a delivery (%)
Reproductive Health - Women breastfeeding newborns (%)
Reproductive Health - Women that had a hysterectomy (%)
Reproductive Health - Women that had both ovaries removed (%)
Reproductive Health - Women that have ever taken birth control pills (%)
Reproductive Health - Women taking birth control pills (%)
Reproductive Health - Women that have ever used Depo-Provera or injectables (%)
Reproductive Health - Women that have ever used female hormones (%)
Sexual Behavior - People 18+ that ever had sex (vaginal, anal, or oral) (%)
Sexual Behavior - Males 18+ that ever had vaginal sex with a woman (%)
Sexual Behavior - Males 18+ that ever performed oral sex on a woman (%)
Sexual Behavior - Males 18+ that ever had anal sex with a woman (%)
Sexual Behavior - Males 18+ that ever had any sex with a man (%)
Sexual Behavior - Females 18+ that ever had vaginal sex with a man (%)
Sexual Behavior - Females 18+ that ever performed oral sex on a man (%)
Sexual Behavior - Females 18+ that ever had anal sex with a man (%)
Sexual Behavior - Females 18+ that ever had any kind of sex with a woman (%)
Sexual Behavior - Average age people first had sex
Sexual Behavior - Average number of female sex partners in lifetime (males 18+)
Sexual Behavior - Average number of female vaginal sex partners in lifetime (males 18+)
Sexual Behavior - Average age people first performed oral sex on a woman (18+)
Sexual Behavior - Average number of woman performed oral sex on in lifetime (18+)
Sexual Behavior - Average number of male sex partners in lifetime (males 18+)
Sexual Behavior - Average number of male anal sex partners in lifetime (males 18+)
Sexual Behavior - Average age people first performed oral sex on a man (18+)
Sexual Behavior - Average number of male oral sex partners in lifetime (18+)
Sexual Behavior - People using protection when performing oral sex (%)
Sexual Behavior - Average number of times people have vaginal or anal sex a year
Sexual Behavior - People having sex without condom (%)
Sexual Behavior - Average number of male sex partners in lifetime (females 18+)
Sexual Behavior - Average number of male vaginal sex partners in lifetime (females 18+)
Sexual Behavior - Average number of female sex partners in lifetime (females 18+)
Sexual Behavior - Circumcised males 18+ (%)
Sleep Disorders - Average hours sleeping at night
Sleep Disorders - People that has trouble sleeping (%)
Smoking-Cigarette Use - People smoking cigarettes (%)
Taste & Smell - People 40+ having problems with smell (%)
Taste & Smell - People 40+ having problems with taste (%)
Taste & Smell - People 40+ that ever had wisdom teeth removed (%)
Taste & Smell - People 40+ that ever had tonsils teeth removed (%)
Taste & Smell - People 40+ that ever had a loss of consciousness because of a head injury (%)
Taste & Smell - People 40+ that ever had a broken nose or other serious injury to face or skull (%)
Taste & Smell - People 40+ that ever had two or more sinus infections (%)
Weight - Average height (inches)
Weight - Average weight (pounds)
Weight - Average BMI
Weight - People that are obese (%)
Weight - People that ever were obese (%)
Weight - People trying to lose weight (%)
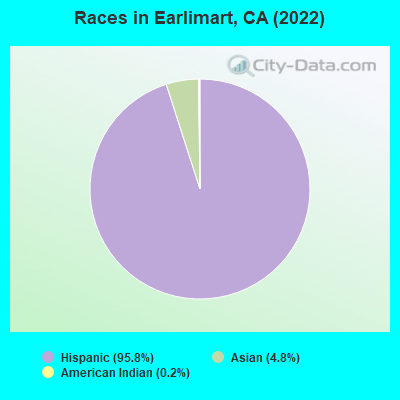
7,412 95.8% Hispanic 372 4.8% Asian alone 12 0.2% American Indian alone
According to our research of California and other state lists, there were 13 registered sex offenders living in Earlimart, California as of April 27, 2024 . The ratio of all residents to sex offenders in Earlimart is 674 to 1.The ratio of registered sex offenders to all residents in this city is near the state average.
Latest news from Earlimart, CA collected exclusively by city-data.com from local newspapers, TV, and radio stations
Current Local Time:
Land area: 2.01 square miles.
Population density: 4,243 people per square mile (average).
3,147 residents are foreign born (37.7% Latin America ).
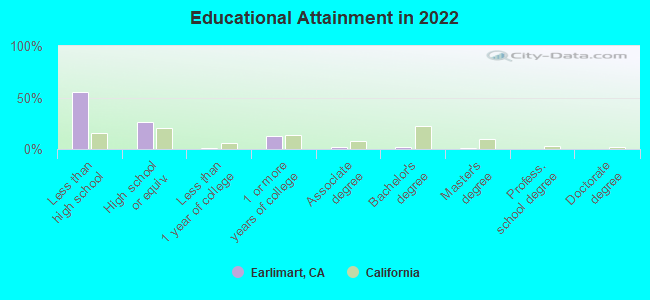
This place:
40.7%California:
26.5%
Median real estate property taxes paid for housing units with mortgages in 2022: $1,353 (0.5%)Median real estate property taxes paid for housing units with no mortgage in 2022: $1,299 (0.6%)
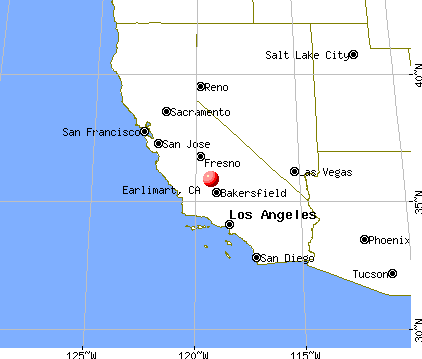
Nearest city with pop. 50,000+: Visalia, CA
Nearest city with pop. 200,000+: Bakersfield, CA
Nearest city with pop. 1,000,000+: Los Angeles, CA
Nearest cities:
Rodriguez Camp, CA (3.0 miles),
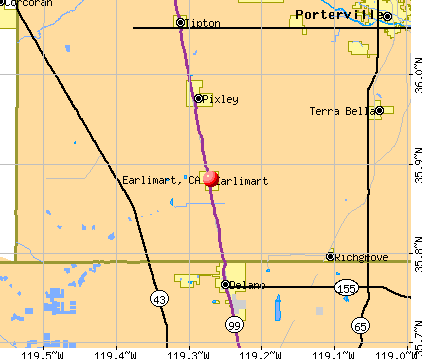
Latitude: 35.88 N, Longitude: 119.27 W
Unemployment in December 2023: Here:
11.2%California:
5.1%
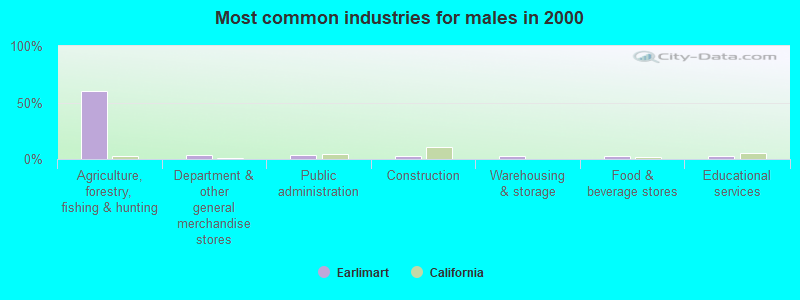
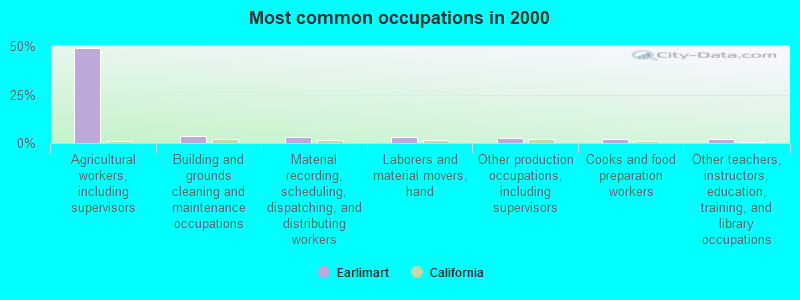
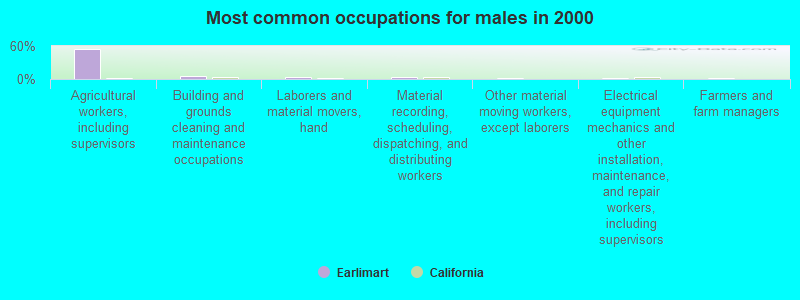
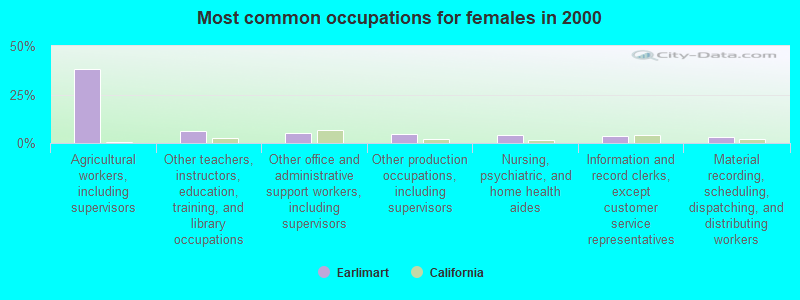
Most common occupations in Earlimart, CA (%)
Both Males Females
Agricultural workers, including supervisors (49.1%)
Building and grounds cleaning and maintenance occupations (3.7%)
Material recording, scheduling, dispatching, and distributing workers (3.1%)
Laborers and material movers, hand (3.1%)
Other production occupations, including supervisors (2.8%)
Cooks and food preparation workers (2.1%)
Other teachers, instructors, education, training, and library occupations (2.1%)
Agricultural workers, including supervisors (54.7%)
Building and grounds cleaning and maintenance occupations (5.0%)
Laborers and material movers, hand (4.2%)
Material recording, scheduling, dispatching, and distributing workers (3.1%)
Other material moving workers, except laborers (2.6%)
Electrical equipment mechanics and other installation, maintenance, and repair workers, including supervisors (2.5%)
Farmers and farm managers (2.3%)
Agricultural workers, including supervisors (38.3%)
Other teachers, instructors, education, training, and library occupations (6.2%)
Other office and administrative support workers, including supervisors (5.1%)
Other production occupations, including supervisors (4.5%)
Nursing, psychiatric, and home health aides (3.9%)
Information and record clerks, except customer service representatives (3.4%)
Material recording, scheduling, dispatching, and distributing workers (3.2%)
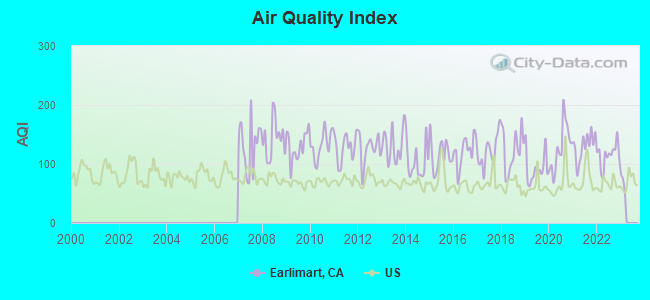
Air pollution and air quality trends(lower is better)
AQI Ozone PM2.5
Earthquake activity:
Earlimart-area historical earthquake activity is significantly above California state average. It is 8338% greater than the overall U.S. average. On 7/21/1952 at 11:52:14, a magnitude 7.7 (7.7 UK, Class: Major, Intensity: VIII - XII) earthquake occurred 62.9 miles away from Earlimart center, causing $50,000,000 total damage On 11/4/1927 at 13:51:53, a magnitude 7.5 (7.5 UK) earthquake occurred 119.7 miles away from the city center On 4/18/1906 at 13:12:21, a magnitude 7.9 (7.9 UK) earthquake occurred 252.9 miles away from the city center, causing $524,000,000 total damage On 6/28/1992 at 11:57:34, a magnitude 7.6 (6.2 MB, 7.6 MS, 7.3 MW, Depth: 0.7 mi) earthquake occurred 194.5 miles away from Earlimart center, causing 3 deaths ( 1 shaking deaths, 2 other deaths) and 400 injuries, causing $100,000,000 total damage and $40,000,000 insured lossesOn 10/16/1999 at 09:46:44, a magnitude 7.4 (6.3 MB, 7.4 MS, 7.2 MW, 7.3 ML) earthquake occurred 186.1 miles away from the city center On 5/2/1983 at 23:42:37, a magnitude 6.7 (6.2 MB, 6.5 MS, 6.5 MW, 6.7 ML, Class: Strong, Intensity: VII - IX) earthquake occurred 62.3 miles away from the city center, causing $31,000,000 total damage Magnitude types: body-wave magnitude (MB), local magnitude (ML), surface-wave magnitude (MS), moment magnitude (MW) Natural disasters: The number of natural disasters in Tulare County (14) is near the US average (15).Major Disasters (Presidential) Declared: 10Emergencies Declared: 2Floods: 8, Storms: 5, Winter Storms: 4, Freezes: 2, Landslides: 2, Drought: 1, Fire: 1, Hurricane: 1, Mudslide: 1, Other: 1 (Note: some incidents may be assigned to more than one category). Hospitals and medical centers near Earlimart: POSITIVE DIRECTIONS #8 (Hospital, about 8 miles away; DELANO, CA)
DELANO DIALYSIS (Dialysis Facility, about 9 miles away; DELANO, CA)
KELLY AND SCOTT'S CARE HOME INC #2 (Hospital, about 9 miles away; DELANO, CA)
KELLY AND SCOTT'S CARE HOME (Hospital, about 9 miles away; DELANO, CA)
DELANO DISTRICT SKILLED NURSING FACILITY (Nursing Home, about 9 miles away; DELANO, CA)
DELANO REGIONAL MEDICAL CENTER (about 9 miles away; DELANO, CA)
BROWNING MANOR CONVALESCENT HOSPITAL (Nursing Home, about 9 miles away; DELANO, CA)
Colleges/universities with over 2000 students nearest to Earlimart:
Porterville College (about 19 miles; Porterville, CA ; Full-time enrollment: 2,560)
College of the Sequoias (about 31 miles; Visalia, CA ; FT enrollment: 6,982)
San Joaquin Valley College-Visalia (about 32 miles; Visalia, CA ; FT enrollment: 2,386)
Bakersfield College (about 37 miles; Bakersfield, CA ; FT enrollment: 10,325)
California State University-Bakersfield (about 38 miles; Bakersfield, CA ; FT enrollment: 7,564)
West Hills College-Lemoore (about 42 miles; Lemoore, CA ; FT enrollment: 2,314)
Reedley College (about 52 miles; Reedley, CA ; FT enrollment: 8,144)
Public elementary/middle schools in Earlimart:
See full list of schools located in Earlimart
Notable locations in Earlimart: (A) , Veterans Building (B) , Earlimart Branch Tulare County Library (C) . Display/hide their locations on the map
Birthplace of: Dack Rambo - Actor.
Tulare County has a predicted average indoor radon screening level between 2 and 4 pCi/L (pico curies per liter) - Moderate Potential Drinking water stations with addresses in Earlimart and their reported violations in the past:
ALLENSWORTH C S D (Population served: 400, Groundwater):
Past health violations:
MCL, Monthly (TCR) - In MAR-2014, Contaminant: Coliform. Follow-up actions: St AO (w/o penalty) issued (APR-10-2014)
MCL, Average - Between JAN-2014 and MAR-2014, Contaminant: Arsenic. Follow-up actions: St AO (w/o penalty) issued (DEC-21-2010)
MCL, Average - Between OCT-2013 and DEC-2013, Contaminant: Arsenic. Follow-up actions: St AO (w/o penalty) issued (DEC-21-2010)
MCL, Average - Between JUL-2013 and SEP-2013, Contaminant: Arsenic. Follow-up actions: St AO (w/o penalty) issued (DEC-21-2010)
MCL, Average - Between APR-2013 and JUN-2013, Contaminant: Arsenic. Follow-up actions: St AO (w/o penalty) issued (DEC-21-2010)
MCL, Average - Between JUL-2012 and SEP-2012, Contaminant: Arsenic. Follow-up actions: St AO (w/o penalty) issued (DEC-21-2010)
7 other older health violations
Past monitoring violations:
Monitoring, Repeat Major (TCR) - In APR-2013, Contaminant: Coliform (TCR). Follow-up actions: St Violation/Reminder Notice (MAY-10-2013)
2 routine major monitoring violations
4 regular monitoring violations
Average household size: This place:
4.4 peopleCalifornia:
2.9 people
Percentage of family households: This place:
89.2%Whole state:
68.7%
Percentage of households with unmarried partners: This place:
8.8%Whole state:
7.2%
Likely homosexual households (counted as self-reported same-sex unmarried-partner households)
Lesbian couples: 0.1% of all households Gay men: 0.1% of all households
For population 15 years and over in Earlimart:
Never married: 44.9%Now married: 41.7%Separated: 3.4%Widowed: 5.4%Divorced: 4.6% For population 25 years and over in Earlimart:
High school or higher: 42.5%Bachelor's degree or higher: 3.1%Graduate or professional degree: 1.2%Unemployed: 35.2%Mean travel time to work (commute): 27.2 minutes
Education Gini index (Inequality in education) Here:
28.1California average:
15.5
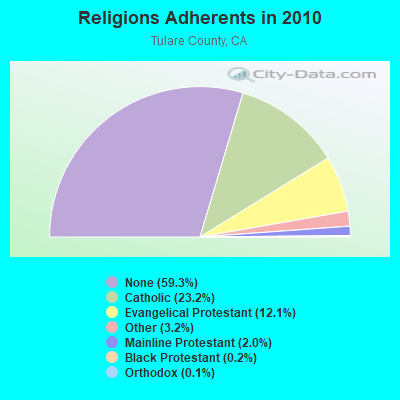
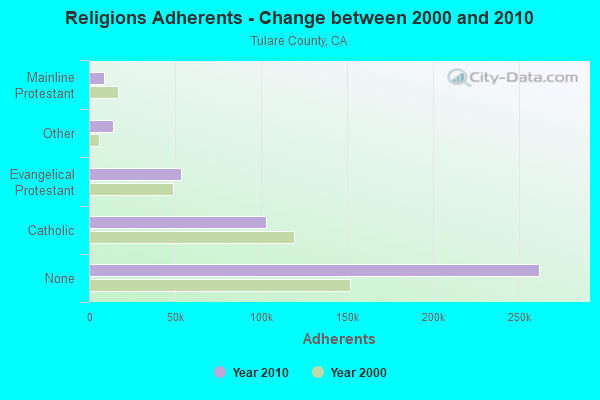
Religion statistics for Earlimart, CA (based on Tulare County data)
Religion Adherents Congregations Catholic 102,772 26 Evangelical Protestant 53,285 300 Other 13,983 37 Mainline Protestant 8,690 37 Black Protestant 757 5 Orthodox 650 2 None 262,042 -
Source: Clifford Grammich, Kirk Hadaway, Richard Houseal, Dale E.Jones, Alexei Krindatch, Richie Stanley and Richard H.Taylor. 2012. 2010 U.S.Religion Census: Religious Congregations & Membership Study. Association of Statisticians of American Religious Bodies. Jones, Dale E., et al. 2002. Congregations and Membership in the United States 2000. Nashville, TN: Glenmary Research Center. Graphs represent county-level data
Food Environment Statistics: Number of grocery stores : 119Tulare County :
2.84 / 10,000 pop.California :
2.14 / 10,000 pop.
Number of supercenters and club stores : 3This county :
0.07 / 10,000 pop.California :
0.04 / 10,000 pop.
Number of convenience stores (no gas) : 32Tulare County :
0.76 / 10,000 pop.State :
0.62 / 10,000 pop.
Number of convenience stores (with gas) : 89Tulare County :
2.12 / 10,000 pop.State :
1.49 / 10,000 pop.
Number of full-service restaurants : 215Tulare County :
5.13 / 10,000 pop.State :
7.42 / 10,000 pop.
Adult diabetes rate : Tulare County :
7.3%California :
7.3%
Adult obesity rate : Here :
28.2%California :
21.3%
Low-income preschool obesity rate : Tulare County :
16.9%California :
17.9%
Health and Nutrition: Healthy diet rate : Earlimart:
43.0%California:
49.4%
Average overall health of teeth and gums : Earlimart:
41.0%State:
48.0%
Average BMI : Earlimart:
27.1California:
28.1
People feeling badly about themselves : Earlimart:
34.4%California:
20.2%
People not drinking alcohol at all : Earlimart:
9.7%State:
11.2%
Average hours sleeping at night : This city:
6.4California:
6.8
Overweight people : Earlimart:
20.5%State:
31.5%
General health condition : Here:
49.4%California:
56.4%
Average condition of hearing : Earlimart:
79.0%California:
80.9%
More about Health and Nutrition of Earlimart, CA Residents
3.84% of this county's 2021 resident taxpayers lived in other counties in 2020 ($53,510 average adjusted gross income )
Here:
3.84%California average:
5.19%
0.01% of residents moved from foreign countries ($107 average AGI )Tulare County:
0.01%California average:
0.03%
Top counties from which taxpayers relocated into this county between 2020 and 2021:
3.70% of this county's 2020 resident taxpayers moved to other counties in 2021 ($58,158 average adjusted gross income )
Here:
3.70%California average:
6.14%
0.01% of residents moved to foreign countries ($170 average AGI )Tulare County:
0.01%California average:
0.02%
Top counties to which taxpayers relocated from this county between 2020 and 2021: Businesses in Earlimart, CA
Strongest AM radio stations in Earlimart:
KCHJ (1010 AM; 5 kW; DELANO, CA; Owner: ILLINOIS LOTUS CORP.)
KERI (1180 AM; 50 kW; WASCO-GREENACRES, CA; Owner: KWSO, INC.)
KWRU (940 AM; 50 kW; FRESNO, CA)
KMJ (580 AM; 50 kW; FRESNO, CA; Owner: INFINITY RADIO OPERATIONS INC.)
KJUG (1270 AM; 5 kW; TULARE, CA; Owner: WESTCOAST BROADCASTING, INC.)
KNZR (1560 AM; 25 kW; BAKERSFIELD, CA; Owner: BUCKLEY BROADCASTING CORP. OF CALIF.)
KGDP (660 AM; 50 kW; ORCUTT, CA; Owner: RADIO REPRESENTATIVES, INC.)
KIRN (670 AM; 35 kW; SIMI VALLEY, CA; Owner: LOTUS OXNARD CORP.)
KUZZ (550 AM; 5 kW; BAKERSFIELD, CA; Owner: OWENS ONE COMPANY)
KGET (970 AM; 5 kW; BAKERSFIELD, CA; Owner: CLEVELAND RADIO LICENSES, LLC)
KSPN (710 AM; 50 kW; LOS ANGELES, CA; Owner: KABC-AM RADIO, INC.)
KLAC (570 AM; 50 kW; LOS ANGELES, CA; Owner: AMFM RADIO LICENSES, L.L.C.)
KRDU (1130 AM; 6 kW; DINUBA, CA; Owner: CAPSTAR TX LIMITED PARTNERSHIP)
Strongest FM radio stations in Earlimart:
KMQA (100.5 FM; EAST PORTERVILLE, CA; Owner: MOON BROADCASTING PORTERVILLE L.L.C.)
KZPO (103.3 FM; LINDSAY, CA; Owner: LINDSAY BROADCASTING)
KDUV (88.9 FM; VISALIA, CA; Owner: COMMUNITY EDUCATIONAL B/CASTNG, INC.)
K266AH (101.1 FM; BENA, CA; Owner: CALVARY CHAPEL OF TWIN FALLS, INC.)
KJUG-FM (106.7 FM; TULARE, CA; Owner: WESTCOAST BROADCASTING, INC.)
K220EY (91.9 FM; PORTERVILLE, CA; Owner: FAMILY STATIONS, INC.)
KTQX (90.1 FM; BAKERSFIELD, CA; Owner: RADIO BILINGUE, INC.)
KUFW (90.5 FM; WOODLAKE, CA; Owner: NATIONAL FARM WORKERS SERVICE CENTER)
KIOO (99.7 FM; PORTERVILLE, CA; Owner: BUCKLEY B/CSTNG CORP OF SAN JOA VAL)
KGZO (90.9 FM; SHAFTER, CA; Owner: THE ASSOCIATION FOR COMMUNITY EDUCATION, INC.)
KMYX-FM (92.5 FM; ARVIN, CA; Owner: FARMWORKER EDUC. RADIO NETWORK, INC.)
K293AG (106.5 FM; TAFT, CA; Owner: CENTRO CRISTIANO DE FE, INC.)
KMAK (100.3 FM; ORANGE COVE, CA; Owner: RICHARD B. SMITH)
KCRZ (104.9 FM; TIPTON, CA; Owner: WESTCOAST BROADCASTING, INC.)
KKBB (99.3 FM; BAKERSFIELD, CA; Owner: BUCKLEY COMMUNICATIONS, INC.)
KFRB (91.3 FM; BAKERSFIELD, CA; Owner: FAMILY STATIONS, INC.)
KUZZ-FM (107.9 FM; BAKERSFIELD, CA; Owner: OWENS ONE COMPANY, INC)
K203CM (88.5 FM; SANGER, CA; Owner: EDUCATIONAL MEDIA FOUNDATION)
KISV (94.1 FM; BAKERSFIELD, CA; Owner: AMERICAN GENERAL MEDIA CORP.)
KGFM (101.5 FM; BAKERSFIELD, CA; Owner: LAGNIAPPE BROADCASTING, INC.)
TV broadcast stations around Earlimart:
KTRO-LP (Channel 50; LANCASTER, CA; Owner: ROBERT D. ADELMAN)
National Bridge Inventory (NBI) Statistics 12 Number of bridges112ft / 33.5m Total length $2,640,000 Total costs223,650 Total average daily traffic24,367 Total average daily truck traffic
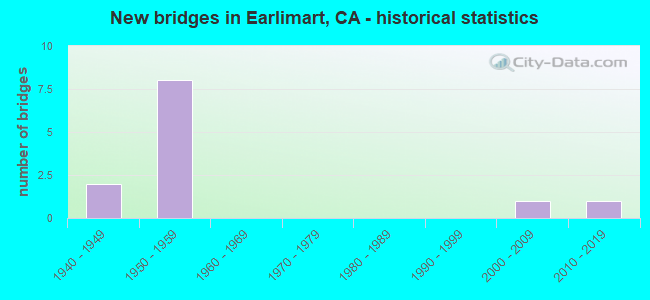
New bridges - historical statistics
2 1940-1949 8 1950-1959 1 2000-2009 1 2010-2019
See full National Bridge Inventory statistics for Earlimart, CA
FCC Registered Cell Phone Towers: 2 (
See the full list of FCC Registered Cell Phone Towers in Earlimart )
FCC Registered Antenna Towers: 29 (
See the full list of FCC Registered Antenna Towers )
FCC Registered Broadcast Land Mobile Towers: 3
4099 Douglas Ave Visitor Ctr (Lat: 35.863556 Lon: -119.392333), Structure height: 8 m, Call Sign: KNEH777, Assigned Frequencies: 812.937 MHz, 857.937 MHz, Grant Date: 11/21/2023, Expiration Date: 02/15/2034, Registrant: State Of California, 601 Sequoia Pacific Blvd, Sacramento, CA 95811-0231, Phone: (916) 894-5102, Fax: (916) 894-5392, Email:
4 Mi Ssw (Lat: 35.826056 Lon: -119.304278), Call Sign: WNNV397, Licensee ID: L00265137, Assigned Frequencies: 462.525 MHz, Grant Date: 03/10/1999, Expiration Date: 03/10/2004, Cancellation Date: 11/03/2003, Certifier: R Dean Meiszer, Registrant: Lb Tower Company LLC, 441 Vine Street, Suite 3900, Cincinnati, OH 45202-3011, Phone: (513) 381-7775, Fax: (513) 381-1292 Lat: 35.885889 Lon: -119.268972, Call Sign: WRTL917, Assigned Frequencies: 461.800 MHz, 462.275 MHz, 462.500 MHz, 462.200 MHz, 464.450 MHz, 461.850 MHz, 462.250 MHz, 463.950 MHz, 462.250 MHz, 463.800 MHz... (+9 more), Grant Date: 07/02/2022, Expiration Date: 07/02/2032, Certifier: Danika Curlee, Registrant: Washington Radio Reports, Gettysburg, PA 17325, Phone: (717) 334-0668, Fax: (717) 334-6440, Email:
FCC Registered Microwave Towers: 10 (
See the full list of FCC Registered Microwave Towers in this town )
FCC Registered Paging Towers: 1 (
See the full list of FCC Registered Paging Towers )
FCC Registered Amateur Radio Licenses: 3
Call Sign: KD6HCX, Previous Call Sign: WB6FPV, Licensee ID: L00300622, Grant Date: 03/19/2002, Expiration Date: 03/19/2012, Cancellation Date: 03/20/2014, Registrant: Michael R Waldrop, Earlimart, CA 93219Call Sign: KF6UCJ, Grant Date: 12/08/1998, Expiration Date: 12/08/2008, Cancellation Date: 12/09/2010, Registrant: Abel S Perez, Earlimart, CA 93219Call Sign: KJ6SSJ, Licensee ID: L01673074, Grant Date: 11/16/2011, Expiration Date: 11/16/2021, Cancellation Date: 11/17/2023, Certifier: Heoth C Wooten, Registrant: Heoth C Wooten, Rt 1 Bx 166 Rd 164, Earlimart, CA 93219FAA Registered Aircraft: 1
Aircraft: ROCKWELL INTERNATIONAL S-2R (Category: Land, Weight: Up to 12,499 Pounds, Speed: 82 mph), Engine: P&W R1340 SERIES (600 HP) (Reciprocating)N-Number: 4092X, N4092X, N-4092X, Serial Number: 1923R, Year manufactured: 1974, Airworthiness Date: 03/11/1974, Certificate Issue Date: 06/13/1995Registrant (Corporation): Vortex Resources Inc, 6589 Road 144, Earlimart, CA 93219Deregistered: Cancel Date: 12/13/2017, Exported to: Colombia
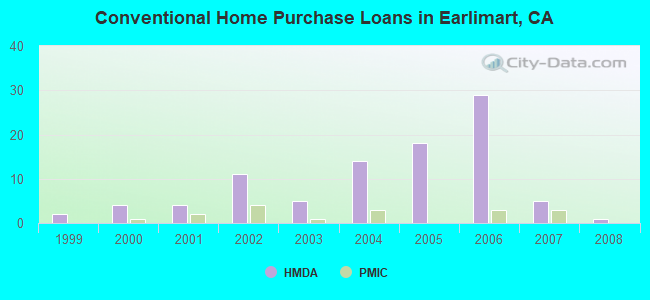
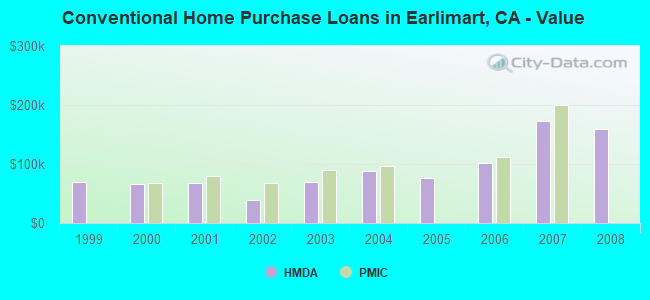
Home Mortgage Disclosure Act Aggregated Statistics For Year 2009(Based on 1 partial tract) A) FHA, FSA/RHS & VA B) Conventional C) Refinancings D) Home Improvement Loans F) Non-occupant Loans on Number Average Value Number Average Value Number Average Value Number Average Value Number Average Value
LOANS ORIGINATED 5 $104,174 0 $0 4 $84,150 0 $0 1 $75,910 APPLICATIONS APPROVED, NOT ACCEPTED 0 $0 0 $0 2 $72,910 0 $0 0 $0 APPLICATIONS DENIED 1 $118,860 2 $81,900 13 $103,606 2 $79,405 0 $0 APPLICATIONS WITHDRAWN 1 $85,400 0 $0 4 $89,892 0 $0 0 $0 FILES CLOSED FOR INCOMPLETENESS 0 $0 0 $0 2 $196,015 0 $0 0 $0
Aggregated Statistics For Year 2008(Based on 1 partial tract) A) FHA, FSA/RHS & VA B) Conventional C) Refinancings D) Home Improvement Loans F) Non-occupant Loans on G) Loans On Manufactured Number Average Value Number Average Value Number Average Value Number Average Value Number Average Value Number Average Value
LOANS ORIGINATED 3 $169,130 1 $158,810 16 $107,902 5 $78,106 2 $100,130 0 $0 APPLICATIONS APPROVED, NOT ACCEPTED 0 $0 0 $0 7 $95,029 2 $99,880 0 $0 0 $0 APPLICATIONS DENIED 1 $161,810 2 $219,985 32 $128,705 11 $92,706 3 $170,297 2 $70,415 APPLICATIONS WITHDRAWN 1 $133,840 0 $0 5 $136,136 0 $0 0 $0 0 $0 FILES CLOSED FOR INCOMPLETENESS 1 $127,850 0 $0 2 $121,105 0 $0 0 $0 0 $0
Aggregated Statistics For Year 2007(Based on 1 partial tract) A) FHA, FSA/RHS & VA B) Conventional C) Refinancings D) Home Improvement Loans F) Non-occupant Loans on G) Loans On Manufactured Number Average Value Number Average Value Number Average Value Number Average Value Number Average Value Number Average Value
LOANS ORIGINATED 1 $147,320 5 $173,292 43 $113,073 10 $91,540 7 $97,169 1 $174,290 APPLICATIONS APPROVED, NOT ACCEPTED 0 $0 5 $128,646 15 $122,053 1 $73,910 1 $111,870 0 $0 APPLICATIONS DENIED 0 $0 14 $123,601 46 $141,591 15 $88,227 3 $98,713 1 $37,450 APPLICATIONS WITHDRAWN 0 $0 3 $211,747 18 $112,060 6 $112,448 2 $100,630 1 $89,890 FILES CLOSED FOR INCOMPLETENESS 0 $0 1 $159,310 8 $127,035 1 $96,380 0 $0 0 $0
Aggregated Statistics For Year 2006(Based on 1 partial tract) A) FHA, FSA/RHS & VA B) Conventional C) Refinancings D) Home Improvement Loans F) Non-occupant Loans on Number Average Value Number Average Value Number Average Value Number Average Value Number Average Value
LOANS ORIGINATED 1 $106,870 29 $101,533 62 $108,885 11 $74,456 7 $125,207 APPLICATIONS APPROVED, NOT ACCEPTED 0 $0 8 $106,185 17 $121,501 3 $104,540 2 $148,320 APPLICATIONS DENIED 0 $0 24 $110,222 55 $117,949 24 $77,095 10 $112,864 APPLICATIONS WITHDRAWN 0 $0 7 $101,093 30 $142,446 10 $86,196 1 $232,220 FILES CLOSED FOR INCOMPLETENESS 0 $0 4 $92,265 5 $126,948 0 $0 0 $0
Aggregated Statistics For Year 2005(Based on 1 partial tract) A) FHA, FSA/RHS & VA B) Conventional C) Refinancings D) Home Improvement Loans F) Non-occupant Loans on G) Loans On Manufactured Number Average Value Number Average Value Number Average Value Number Average Value Number Average Value Number Average Value
LOANS ORIGINATED 1 $125,850 18 $76,880 53 $97,977 6 $83,567 7 $115,647 0 $0 APPLICATIONS APPROVED, NOT ACCEPTED 0 $0 3 $132,507 19 $82,348 1 $49,940 0 $0 0 $0 APPLICATIONS DENIED 0 $0 16 $85,647 57 $88,446 21 $60,641 5 $77,606 1 $31,460 APPLICATIONS WITHDRAWN 0 $0 3 $95,553 44 $93,899 12 $73,453 2 $80,155 0 $0 FILES CLOSED FOR INCOMPLETENESS 0 $0 0 $0 11 $107,644 2 $77,155 0 $0 0 $0
Aggregated Statistics For Year 2004(Based on 1 partial tract) A) FHA, FSA/RHS & VA B) Conventional C) Refinancings D) Home Improvement Loans F) Non-occupant Loans on G) Loans On Manufactured Number Average Value Number Average Value Number Average Value Number Average Value Number Average Value Number Average Value
LOANS ORIGINATED 6 $106,040 14 $88,216 31 $66,775 6 $54,933 7 $72,341 1 $70,910 APPLICATIONS APPROVED, NOT ACCEPTED 0 $0 4 $65,548 8 $69,042 1 $64,420 2 $73,160 1 $70,420 APPLICATIONS DENIED 1 $46,940 12 $65,837 55 $73,521 12 $49,815 5 $61,426 2 $72,665 APPLICATIONS WITHDRAWN 1 $70,910 2 $53,685 30 $74,843 3 $56,767 0 $0 0 $0 FILES CLOSED FOR INCOMPLETENESS 0 $0 0 $0 2 $93,635 0 $0 0 $0 0 $0
Aggregated Statistics For Year 2003(Based on 1 partial tract) A) FHA, FSA/RHS & VA B) Conventional C) Refinancings D) Home Improvement Loans F) Non-occupant Loans on Number Average Value Number Average Value Number Average Value Number Average Value Number Average Value
LOANS ORIGINATED 6 $83,900 5 $70,216 31 $63,472 3 $6,990 2 $49,690 APPLICATIONS APPROVED, NOT ACCEPTED 0 $0 2 $65,920 6 $63,092 0 $0 0 $0 APPLICATIONS DENIED 0 $0 7 $70,130 49 $74,421 3 $36,790 4 $76,782 APPLICATIONS WITHDRAWN 0 $0 0 $0 23 $77,863 0 $0 1 $69,420 FILES CLOSED FOR INCOMPLETENESS 0 $0 0 $0 1 $86,900 0 $0 0 $0
Aggregated Statistics For Year 2002(Based on 1 partial tract) A) FHA, FSA/RHS & VA B) Conventional C) Refinancings D) Home Improvement Loans F) Non-occupant Loans on Number Average Value Number Average Value Number Average Value Number Average Value Number Average Value
LOANS ORIGINATED 10 $83,949 11 $39,680 21 $52,675 4 $10,362 3 $58,597 APPLICATIONS APPROVED, NOT ACCEPTED 0 $0 0 $0 3 $54,433 0 $0 1 $64,920 APPLICATIONS DENIED 0 $0 3 $67,420 18 $79,072 5 $16,680 0 $0 APPLICATIONS WITHDRAWN 0 $0 1 $52,940 10 $64,772 2 $11,235 1 $30,960 FILES CLOSED FOR INCOMPLETENESS 0 $0 1 $18,980 2 $59,180 0 $0 1 $18,980
Aggregated Statistics For Year 2001(Based on 1 partial tract) A) FHA, FSA/RHS & VA B) Conventional C) Refinancings D) Home Improvement Loans F) Non-occupant Loans on Number Average Value Number Average Value Number Average Value Number Average Value Number Average Value
LOANS ORIGINATED 7 $77,050 4 $68,292 17 $52,936 3 $13,483 2 $59,180 APPLICATIONS APPROVED, NOT ACCEPTED 0 $0 2 $37,955 1 $67,420 0 $0 1 $18,980 APPLICATIONS DENIED 1 $83,400 1 $77,410 29 $58,361 5 $14,582 0 $0 APPLICATIONS WITHDRAWN 1 $83,400 1 $47,940 7 $66,277 2 $16,480 0 $0 FILES CLOSED FOR INCOMPLETENESS 0 $0 0 $0 2 $62,925 0 $0 0 $0
Aggregated Statistics For Year 2000(Based on 1 partial tract) A) FHA, FSA/RHS & VA B) Conventional C) Refinancings D) Home Improvement Loans F) Non-occupant Loans on Number Average Value Number Average Value Number Average Value Number Average Value Number Average Value
LOANS ORIGINATED 7 $76,337 4 $65,920 5 $41,150 1 $43,950 1 $25,970 APPLICATIONS APPROVED, NOT ACCEPTED 0 $0 1 $57,930 3 $44,947 2 $29,965 0 $0 APPLICATIONS DENIED 0 $0 5 $51,038 17 $49,940 6 $19,060 1 $39,950 APPLICATIONS WITHDRAWN 0 $0 0 $0 4 $47,692 0 $0 0 $0 FILES CLOSED FOR INCOMPLETENESS 0 $0 0 $0 3 $32,793 0 $0 0 $0
Aggregated Statistics For Year 1999(Based on 1 partial tract) A) FHA, FSA/RHS & VA B) Conventional C) Refinancings D) Home Improvement Loans F) Non-occupant Loans on Number Average Value Number Average Value Number Average Value Number Average Value Number Average Value
LOANS ORIGINATED 7 $66,059 2 $69,195 14 $53,889 0 $0 1 $41,520 APPLICATIONS APPROVED, NOT ACCEPTED 0 $0 2 $60,845 3 $49,150 1 $35,790 0 $0 APPLICATIONS DENIED 0 $0 0 $0 17 $51,397 4 $20,520 3 $41,517 APPLICATIONS WITHDRAWN 1 $60,600 1 $36,740 5 $61,654 0 $0 0 $0 FILES CLOSED FOR INCOMPLETENESS 0 $0 0 $0 3 $37,540 0 $0 0 $0
Detailed HMDA statistics for the following Tracts:
0044.00
Private Mortgage Insurance Companies Aggregated Statistics For Year 2008(Based on 1 partial tract) A) Conventional Number Average Value
LOANS ORIGINATED 0 $0 APPLICATIONS APPROVED, NOT ACCEPTED 2 $176,040 APPLICATIONS DENIED 0 $0 APPLICATIONS WITHDRAWN 0 $0 FILES CLOSED FOR INCOMPLETENESS 0 $0
Aggregated Statistics For Year 2007(Based on 1 partial tract) A) Conventional B) Refinancings Number Average Value Number Average Value
LOANS ORIGINATED 3 $200,093 1 $189,770 APPLICATIONS APPROVED, NOT ACCEPTED 0 $0 1 $123,850 APPLICATIONS DENIED 0 $0 0 $0 APPLICATIONS WITHDRAWN 0 $0 0 $0 FILES CLOSED FOR INCOMPLETENESS 0 $0 0 $0
Aggregated Statistics For Year 2006(Based on 1 partial tract) A) Conventional B) Refinancings C) Non-occupant Loans on Number Average Value Number Average Value Number Average Value
LOANS ORIGINATED 3 $111,200 1 $141,830 1 $114,860 APPLICATIONS APPROVED, NOT ACCEPTED 1 $153,320 0 $0 0 $0 APPLICATIONS DENIED 0 $0 0 $0 0 $0 APPLICATIONS WITHDRAWN 0 $0 0 $0 0 $0 FILES CLOSED FOR INCOMPLETENESS 0 $0 0 $0 0 $0
Aggregated Statistics For Year 2004(Based on 1 partial tract) A) Conventional B) Refinancings C) Non-occupant Loans on Number Average Value Number Average Value Number Average Value
LOANS ORIGINATED 3 $97,050 0 $0 1 $90,390 APPLICATIONS APPROVED, NOT ACCEPTED 0 $0 1 $66,920 0 $0 APPLICATIONS DENIED 0 $0 0 $0 0 $0 APPLICATIONS WITHDRAWN 0 $0 0 $0 0 $0 FILES CLOSED FOR INCOMPLETENESS 0 $0 0 $0 0 $0
Aggregated Statistics For Year 2003(Based on 1 partial tract) A) Conventional B) Refinancings Number Average Value Number Average Value
LOANS ORIGINATED 1 $90,390 2 $81,150 APPLICATIONS APPROVED, NOT ACCEPTED 0 $0 0 $0 APPLICATIONS DENIED 0 $0 0 $0 APPLICATIONS WITHDRAWN 0 $0 0 $0 FILES CLOSED FOR INCOMPLETENESS 0 $0 0 $0
Aggregated Statistics For Year 2002(Based on 1 partial tract) A) Conventional B) Refinancings C) Non-occupant Loans on Number Average Value Number Average Value Number Average Value
LOANS ORIGINATED 4 $68,418 2 $84,150 1 $44,450 APPLICATIONS APPROVED, NOT ACCEPTED 0 $0 0 $0 0 $0 APPLICATIONS DENIED 0 $0 0 $0 0 $0 APPLICATIONS WITHDRAWN 0 $0 0 $0 0 $0 FILES CLOSED FOR INCOMPLETENESS 0 $0 0 $0 0 $0
Aggregated Statistics For Year 2001(Based on 1 partial tract) A) Conventional B) Refinancings Number Average Value Number Average Value
LOANS ORIGINATED 2 $80,405 1 $58,430 APPLICATIONS APPROVED, NOT ACCEPTED 0 $0 0 $0 APPLICATIONS DENIED 0 $0 0 $0 APPLICATIONS WITHDRAWN 0 $0 0 $0 FILES CLOSED FOR INCOMPLETENESS 0 $0 0 $0
Aggregated Statistics For Year 2000(Based on 1 partial tract) A) Conventional B) Refinancings C) Non-occupant Loans on Number Average Value Number Average Value Number Average Value
LOANS ORIGINATED 1 $68,420 1 $49,440 1 $59,930 APPLICATIONS APPROVED, NOT ACCEPTED 0 $0 0 $0 0 $0 APPLICATIONS DENIED 0 $0 0 $0 0 $0 APPLICATIONS WITHDRAWN 0 $0 0 $0 0 $0 FILES CLOSED FOR INCOMPLETENESS 0 $0 0 $0 0 $0
Aggregated Statistics For Year 1999(Based on 1 partial tract) B) Refinancings Number Average Value
LOANS ORIGINATED 2 $62,990 APPLICATIONS APPROVED, NOT ACCEPTED 0 $0 APPLICATIONS DENIED 0 $0 APPLICATIONS WITHDRAWN 0 $0 FILES CLOSED FOR INCOMPLETENESS 0 $0
Detailed PMIC statistics for the following Tracts:
0044.00
Most common first names in Earlimart, CA among deceased individuals Name Count Lived (average)
Jose 20 68.5 years Maria 17 71.6 years Juan 16 79.1 years Pedro 13 68.6 years Mary 13 80.1 years Antonio 12 68.6 years James 11 70.5 years William 11 76.9 years Manuel 11 70.3 years John 10 68.9 years
Most common last names in Earlimart, CA among deceased individuals Last name Count Lived (average)
Rodriguez 16 76.3 years Silva 9 74.6 years Lopez 8 71.0 years Torres 8 67.2 years Perez 8 63.5 years Martinez 8 74.8 years Hernandez 7 66.6 years Flores 7 75.7 years Gonzalez 7 51.9 years Ruiz 7 76.0 years
Earlimart compared to California state average:
Median household income below state average. Median house value significantly below state average. Unemployed percentage above state average. Black race population percentage significantly below state average. Hispanic race population percentage above state average. Median age significantly below state average. Foreign-born population percentage above state average. Length of stay since moving in significantly above state average. Percentage of population with a bachelor's degree or higher significantly below state average.
#3 on the list of "Top 101 cities with largest percentage of males in occupations: farming, fishing, and forestry occupations (population 5,000+)"
#4 on the list of "Top 101 cities with largest percentage of females in occupations: farming, fishing, and forestry occupations (population 5,000+)"
#5 on the list of "Top 101 cities with largest percentage of males in industries: agriculture, forestry, fishing and hunting (population 5,000+)"
#6 on the list of "Top 101 cities with largest percentage of females in industries: agriculture, forestry, fishing and hunting (population 5,000+)"
#26 on the list of "Top 101 cities with the smallest percentage of likely homosexual households (counted as self-reported same-sex unmarried-partner households) (population 5,000+)"
#37 on the list of "Top 101 cities with the lowest percentage of English-only speaking households, population 5,000+"
#44 on the list of "Top 101 cities with the most people carpooling to work (population 5,000+)"
#66 on the list of "Top 101 cities with the least people having Master's or Doctorate degrees (population 5,000+)"
#88 on the list of "Top 100 least-educated cities"
#4 (93219) on the list of "Top 101 zip codes with the lowest 2012 average taxable interest for individuals (pop 5,000+)"
#13 (93219) on the list of "Top 101 zip codes with the largest percentage of Scottish first ancestries (pop 5,000+)"
#38 (93219) on the list of "Top 101 zip codes with the largest percentage of Welsh first ancestries (pop 5,000+)"
#55 (93219) on the list of "Top 101 zip codes with the lowest average reported salary/wage in 2012 (pop 5,000+)"
#56 (93219) on the list of "Top 101 zip codes with the smallest percentage of taxpayers reporting profit/loss from business in 2012 (pop 5,000+)"
#59 (93219) on the list of "Top 101 zip codes with the largest percentage of returns reporting salary or wage in 2012 (pop 5,000+)"
#78 (93219) on the list of "Top 101 zip codes with the smallest percentage of taxpayers reporting taxable interest in 2012 (pop 5,000+)"
#6 on the list of "Top 101 counties with the highest Particulate Matter (PM2.5 ) Annual air pollution readings in 2012 (µg/m3 )"
#7 on the list of "Top 101 counties with the highest Particulate Matter (PM10 ) Annual air pollution readings in 2012 (µg/m3 )"
#10 on the list of "Top 101 counties with the highest number of births per 1000 residents 2007-2013"
#16 on the list of "Top 101 counties with the highest Ozone (1-hour) air pollution readings in 2012 (ppm)"
#25 on the list of "Top 101 counties with the lowest percentage of residents relocating to foreign countries in 2011"


 Recent articles from our blog. Our writers, many of them Ph.D. graduates or candidates, create easy-to-read articles on a wide variety of topics.

 (30.6 miles


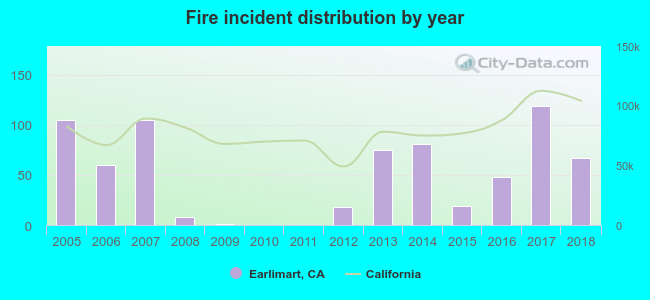 Based on the data from the years 2005 - 2018 the average number of fire incidents per year is 50. The highest number of reported fires - 119 took place in 2017, and the least - 0 in 2010. The data has a dropping trend.
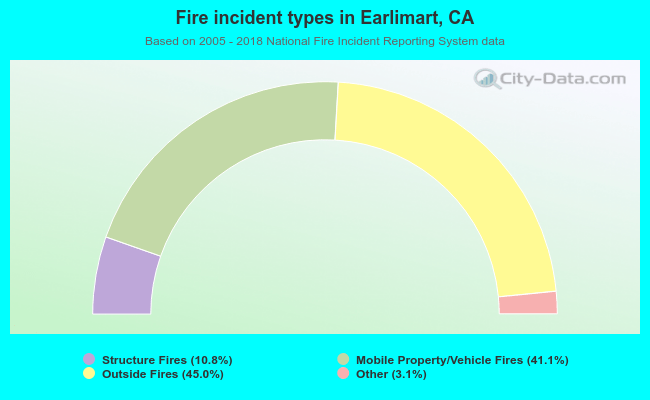 When looking into fire subcategories, the most reports belonged to: Outside Fires (45.0%), and Mobile Property/Vehicle Fires (41.1%).