Delano, California
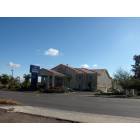
Delano: Holiday Inn Express off County Line Road
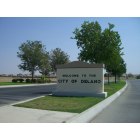
Delano: Welcome to Delano
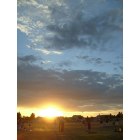
Delano: THE SUN SETS ON MORNINGSIDE PARK DELANO, CA
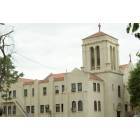
Delano: Down Town Delano Church
- add
your
Submit your own pictures of this city and show them to the world
- OSM Map
- General Map
- Google Map
- MSN Map
Population change since 2000: +31.0%
| Males: 29,025 | |
| Females: 21,818 |
| Median resident age: | 33.6 years |
| California median age: | 37.9 years |
Zip codes: 93215, 93250, 93280.
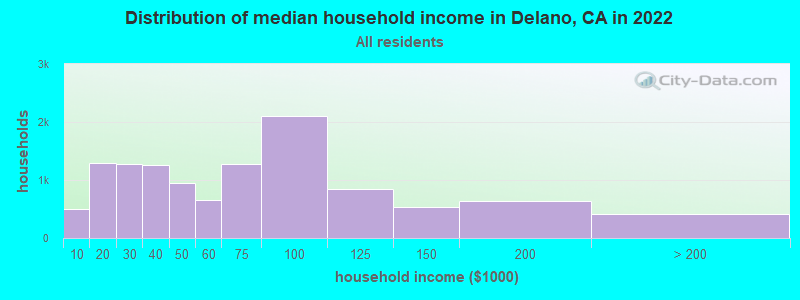
Delano Zip Code Map| Delano: | $55,613 |
| CA: | $91,551 |
Estimated per capita income in 2022: $17,886 (it was $11,068 in 2000)
Delano city income, earnings, and wages data
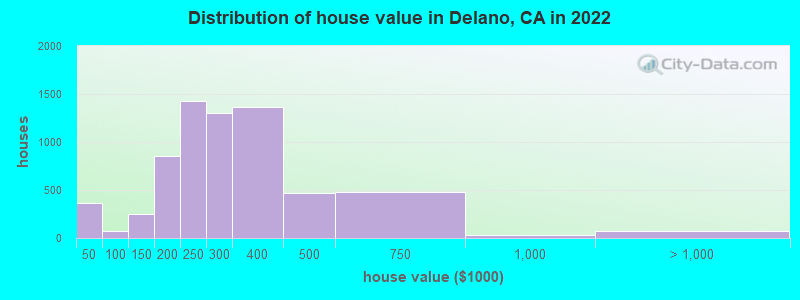
Estimated median house or condo value in 2022: $288,108 (it was $85,600 in 2000)
| Delano: | $288,108 |
| CA: | $715,900 |
Mean prices in 2022: all housing units: $366,187; detached houses: $384,471; townhouses or other attached units: $303,616; in 2-unit structures: $562,075; in 3-to-4-unit structures: $224,286; in 5-or-more-unit structures: $262,914; mobile homes: $180,289; occupied boats, rvs, vans, etc.: $173,886
Median gross rent in 2022: $1,118.
(15.3% for White Non-Hispanic residents, 54.0% for Black residents, 21.8% for Hispanic or Latino residents, 4.7% for American Indian residents, 14.8% for other race residents, 25.0% for two or more races residents)
Detailed information about poverty and poor residents in Delano, CA


Compare current foreclosures near Delano, CA:
| Photo | Address | Area | Beds / Baths | Price | Details |
|---|---|---|---|---|---|

|
#1
13th Ave
Delano, CA 93215
|
1,324 sq. feet
|
1 baths 2 beds |
show details | |

|
#2
W 13th Ave
Delano, CA 93215
|
955 sq. feet
|
2 baths 3 beds |
show details | |

|
#3
18th Ave
Delano, CA 93215
|
1,553 sq. feet
|
2 baths 4 beds |
show details | |

|
#4
Franciscan Plz
Delano, CA 93215
|
1,434 sq. feet
|
2 baths 4 beds |
show details | |

|
#5
Catalina Pl
Delano, CA 93215
|
1,434 sq. feet
|
2 baths 4 beds |
show details | |

|
#6
College Dr
Delano, CA 93215
|
1,202 sq. feet
|
2 baths 4 beds |
show details | |

|
#7
7th Ave
Delano, CA 93215
|
1,396 sq. feet
|
2 baths 3 beds |
show details | |

|
#8
Albany St
Delano, CA 93215
|
999 sq. feet
|
2 baths 3 beds |
show details | |

|
#9
Norwalk St
Delano, CA 93215
|
1,699 sq. feet
|
2 baths 4 beds |
show details | |

|
#10
Via Basilica Ave
Delano, CA 93215
|
1,887 sq. feet
|
2 baths 4 beds |
show details |
| Photo | Address | Area | Beds / Baths | Price | Details |
|---|---|---|---|---|---|

|
#11
Clinton St
Delano, CA 93215
|
858 sq. feet
|
1 baths 2 beds |
show details | |

|
#12
San Marco Ct
Delano, CA 93215
|
2,809 sq. feet
|
3 baths 5 beds |
show details | |

|
#13
18th Ave Apt A
Delano, CA 93215
|
- sq. feet
|
- baths - beds |
show details | |

|
#14
Chaparral Dr
Delano, CA 93215
|
- sq. feet
|
- baths - beds |
show details | |

|
#15
Belmont St Apt 41
Delano, CA 93215
|
- sq. feet
|
- baths - beds |
show details | |

|
#16
Kensington St
Delano, CA 93215
|
- sq. feet
|
- baths - beds |
show details | |

|
#17
Belmont St Apt 67
Delano, CA 93215
|
- sq. feet
|
- baths - beds |
show details | |

|
#18
Fremont St Apt B
Delano, CA 93215
|
- sq. feet
|
- baths - beds |
show details | |

|
#19
Chaparral Cir
Delano, CA 93215
|
- sq. feet
|
- baths - beds |
show details | |

|
#20
N Mariposa Rd
Earlimart, CA 93219
|
1,232 sq. feet
|
2 baths 4 beds |
show details |
| Photo | Address | Area | Beds / Baths | Price | Details |
|---|---|---|---|---|---|

|
#21
Cherrywood St
Mc Farland, CA 93250
|
1,261 sq. feet
|
2 baths 4 beds |
show details | |

|
#22
Zinfandel St
Mc Farland, CA 93250
|
1,803 sq. feet
|
2 baths 4 beds |
show details | |

|
#23
Taylor Ave
Mc Farland, CA 93250
|
1,126 sq. feet
|
2 baths 4 beds |
show details | |

|
#24
Tokay St
Mc Farland, CA 93250
|
2,088 sq. feet
|
2 baths 4 beds |
show details | |

|
#25
Ironbark St
Wasco, CA 93280
|
1,495 sq. feet
|
2 baths 3 beds |
show details | |

|
#26
Oak Creek Ct
Wasco, CA 93280
|
1,301 sq. feet
|
2 baths 3 beds |
show details | |

|
#27
Appletree Ln
Wasco, CA 93280
|
2,187 sq. feet
|
2 baths 4 beds |
show details | |

|
#28
Buenaventura St
Wasco, CA 93280
|
1,440 sq. feet
|
2 baths 3 beds |
show details | |

|
#29
Primrose Ct
Wasco, CA 93280
|
1,363 sq. feet
|
2 baths 4 beds |
show details | |

|
#30
Rio Santana Ct
Mc Farland, CA 93250
|
- sq. feet
|
- baths - beds |
show details |
| Photo | Address | Area | Beds / Baths | Price | Details |
|---|---|---|---|---|---|

|
#31
W Sherwood Ave Apt 4
Mc Farland, CA 93250
|
- sq. feet
|
- baths - beds |
show details | |

|
#32
N Mariposa Rd
Earlimart, CA 93219
|
- sq. feet
|
- baths - beds |
show details | |

|
#33
Prairie Rose Way
Wasco, CA 93280
|
- sq. feet
|
- baths - beds |
show details | |

|
#34
Laguna Niguel Ave
Wasco, CA 93280
|
- sq. feet
|
- baths - beds |
show details | |

|
#35
Terra Bella
Terra Bella, CA 93270
|
- sq. feet
|
- baths - beds |
show details | |

|
Check over 1 million property listings on Foreclosure.com!
|
browse all offers | |||


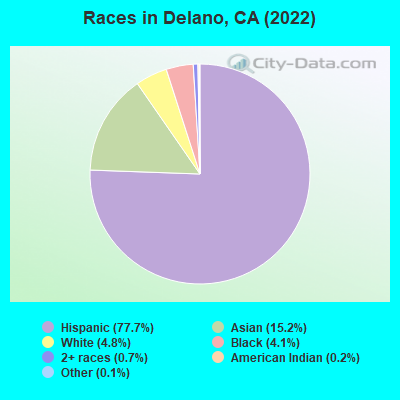
- 39,62877.7%Hispanic
- 7,73815.2%Asian alone
- 2,4724.8%White alone
- 2,0854.1%Black alone
- 3410.7%Two or more races
- 790.2%American Indian alone
- 550.1%Other race alone
- 200.04%Native Hawaiian and Other
Pacific Islander alone
According to our research of California and other state lists, there were 53 registered sex offenders living in Delano, California as of April 27, 2024.
The ratio of all residents to sex offenders in Delano is 1,007 to 1.
The ratio of registered sex offenders to all residents in this city is lower than the state average.
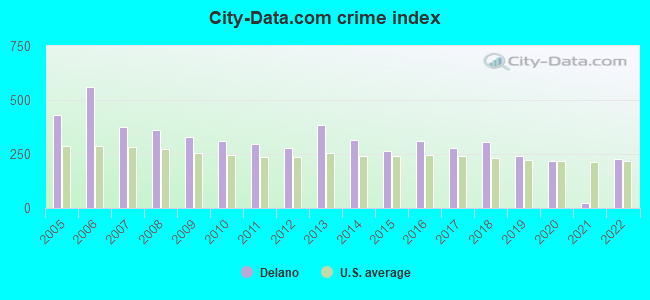
The City-Data.com crime index weighs serious crimes and violent crimes more heavily. Higher means more crime, U.S. average is 246.1. It adjusts for the number of visitors and daily workers commuting into cities.
- means the value is smaller than the state average.- means the value is about the same as the state average.
- means the value is bigger than the state average.
- means the value is much bigger than the state average.
Crime rate in Delano detailed stats: murders, rapes, robberies, assaults, burglaries, thefts, arson
Full-time law enforcement employees in 2021, including police officers: 65 (46 officers - 41 male; 5 female).
| Officers per 1,000 residents here: | 0.87 |
| California average: | 2.30 |
 Recent articles from our blog. Our writers, many of them Ph.D. graduates or candidates, create easy-to-read articles on a wide variety of topics.

 | Is Marin County very liberal? (99 replies) |
| California Business Closures and Job Loss tracking thread (598 replies) |
| Coronavirus (12544 replies) |
| Measure of America 2021: 9 Million Californians Live in 62 Elite Enclaves (20 replies) |
| How do people afford to live in CA (172 replies) |
| Bullet train? Yes or no? (242 replies) |
Latest news from Delano, CA collected exclusively by city-data.com from local newspapers, TV, and radio stations
Current Local Time: PST time zone
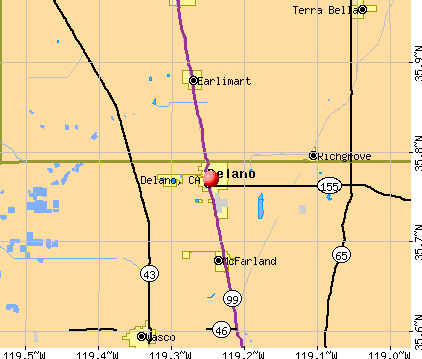
Elevation: 316 feet
Land area: 10.1 square miles.
Population density: 5,032 people per square mile (average).
17,841 residents are foreign born (25.2% Latin America, 10.1% Asia).
| This city: | 35.0% |
| California: | 26.5% |
Median real estate property taxes paid for housing units with mortgages in 2022: $2,029 (0.7%)
Median real estate property taxes paid for housing units with no mortgage in 2022: $1,410 (0.6%)
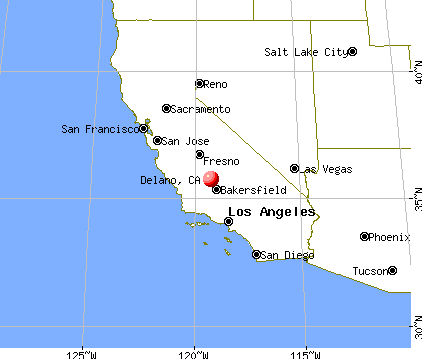
Nearest city with pop. 50,000+: Bakersfield, CA  (31.0 miles , pop. 247,057).
Nearest city with pop. 1,000,000+: Los Angeles, CA (126.5 miles , pop. 3,694,820).
Nearest cities:
), ), ), ), Latitude: 35.77 N, Longitude: 119.25 W
Daytime population change due to commuting: -473 (-0.9%)
Workers who live and work in this city: 8,615 (45.6%)
Area code: 661
Property values in Delano, CA
Delano, California accommodation & food services, waste management - Economy and Business Data
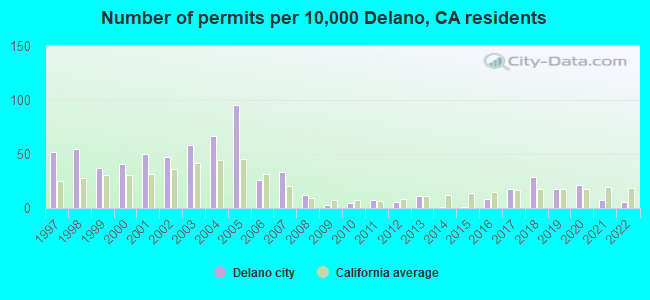
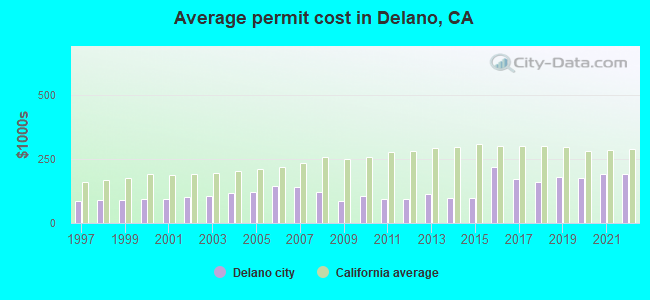
Single-family new house construction building permits:
- 2022: 21 buildings, average cost: $192,000
- 2021: 28 buildings, average cost: $192,700
- 2020: 83 buildings, average cost: $178,400
- 2019: 70 buildings, average cost: $179,100
- 2018: 111 buildings, average cost: $161,200
- 2017: 67 buildings, average cost: $172,100
- 2016: 34 buildings, average cost: $218,900
- 2015: 4 buildings, average cost: $98,500
- 2014: 4 buildings, average cost: $95,600
- 2013: 44 buildings, average cost: $114,900
- 2012: 22 buildings, average cost: $94,000
- 2011: 30 buildings, average cost: $93,300
- 2010: 17 buildings, average cost: $104,200
- 2009: 11 buildings, average cost: $87,800
- 2008: 46 buildings, average cost: $122,600
- 2007: 130 buildings, average cost: $140,700
- 2006: 99 buildings, average cost: $143,200
- 2005: 372 buildings, average cost: $122,900
- 2004: 260 buildings, average cost: $117,800
- 2003: 228 buildings, average cost: $103,700
- 2002: 185 buildings, average cost: $101,700
- 2001: 193 buildings, average cost: $94,500
- 2000: 159 buildings, average cost: $92,500
- 1999: 145 buildings, average cost: $91,500
- 1998: 213 buildings, average cost: $89,600
- 1997: 203 buildings, average cost: $85,000
| Here: | 22.7% |
| California: | 5.1% |
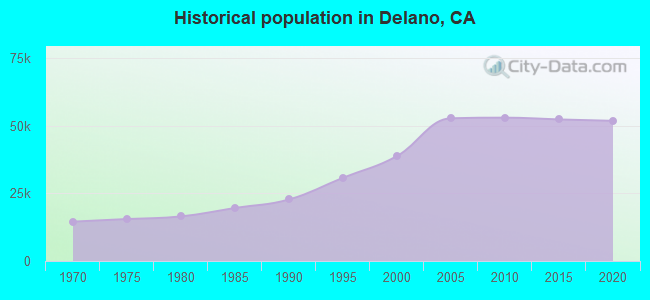
Population change in the 1990s: +15,549 (+66.8%).
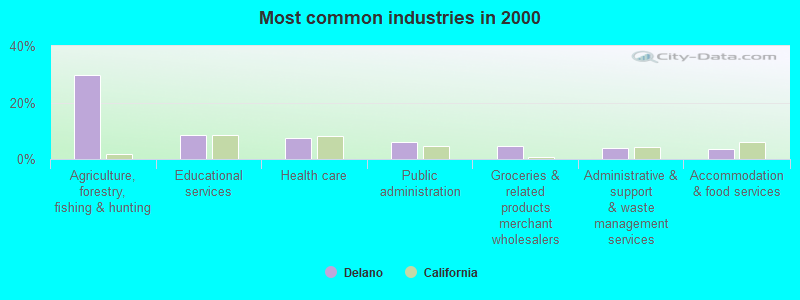
- Agriculture, forestry, fishing & hunting (29.7%)
- Educational services (8.5%)
- Health care (7.4%)
- Public administration (6.2%)
- Groceries & related products merchant wholesalers (4.5%)
- Administrative & support & waste management services (3.7%)
- Accommodation & food services (3.5%)
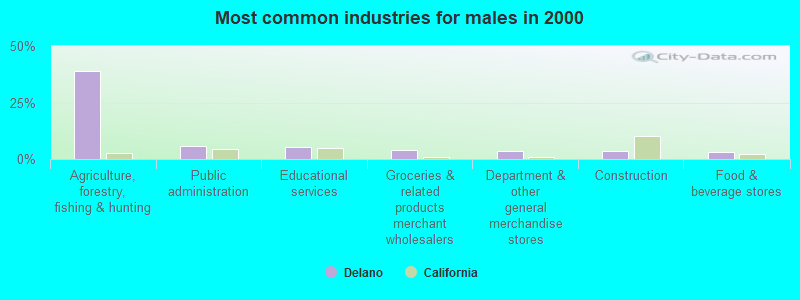
- Agriculture, forestry, fishing & hunting (39.1%)
- Public administration (5.8%)
- Educational services (5.2%)
- Groceries & related products merchant wholesalers (4.0%)
- Department & other general merchandise stores (3.5%)
- Construction (3.5%)
- Food & beverage stores (3.2%)
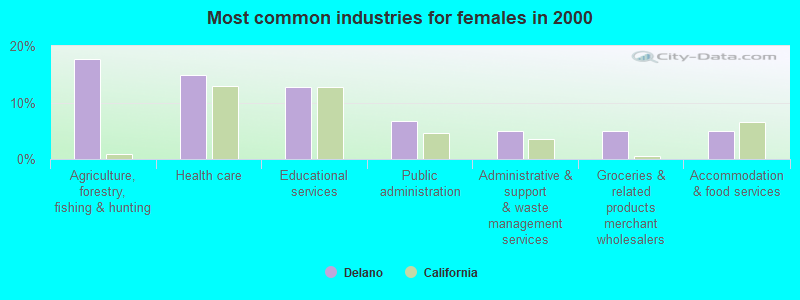
- Agriculture, forestry, fishing & hunting (17.7%)
- Health care (14.8%)
- Educational services (12.7%)
- Public administration (6.7%)
- Administrative & support & waste management services (5.0%)
- Groceries & related products merchant wholesalers (5.0%)
- Accommodation & food services (5.0%)
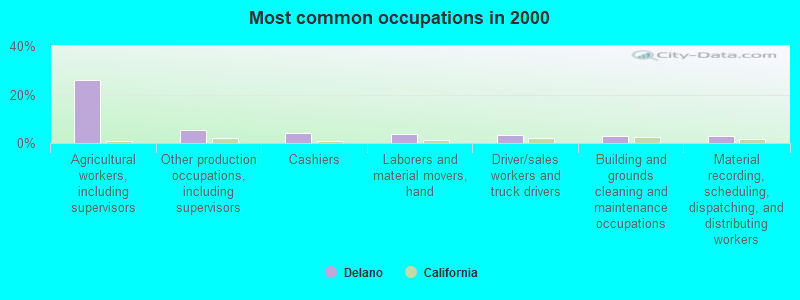
- Agricultural workers, including supervisors (25.8%)
- Other production occupations, including supervisors (5.4%)
- Cashiers (4.1%)
- Laborers and material movers, hand (3.8%)
- Driver/sales workers and truck drivers (3.2%)
- Building and grounds cleaning and maintenance occupations (3.0%)
- Material recording, scheduling, dispatching, and distributing workers (3.0%)
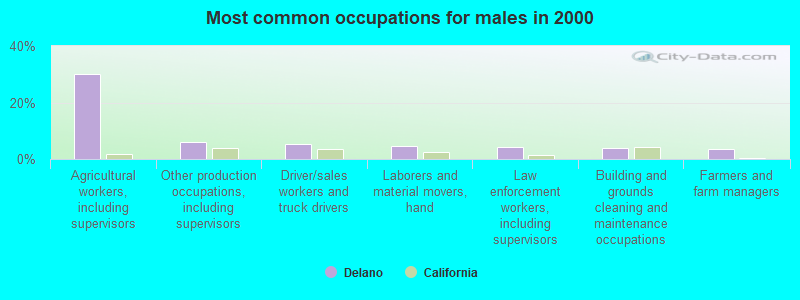
- Agricultural workers, including supervisors (30.2%)
- Other production occupations, including supervisors (6.1%)
- Driver/sales workers and truck drivers (5.5%)
- Laborers and material movers, hand (4.7%)
- Law enforcement workers, including supervisors (4.1%)
- Building and grounds cleaning and maintenance occupations (3.8%)
- Farmers and farm managers (3.5%)
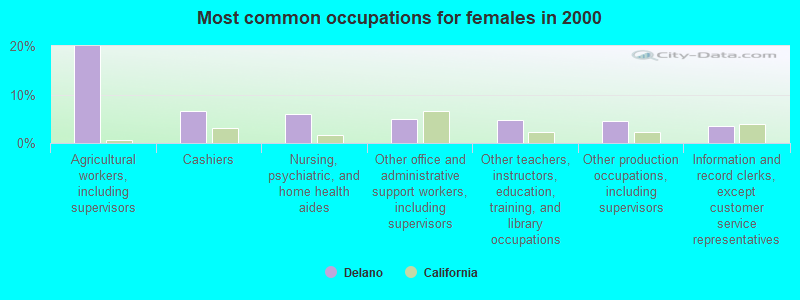
- Agricultural workers, including supervisors (20.0%)
- Cashiers (6.7%)
- Nursing, psychiatric, and home health aides (5.9%)
- Other office and administrative support workers, including supervisors (5.0%)
- Other teachers, instructors, education, training, and library occupations (4.8%)
- Other production occupations, including supervisors (4.6%)
- Information and record clerks, except customer service representatives (3.6%)
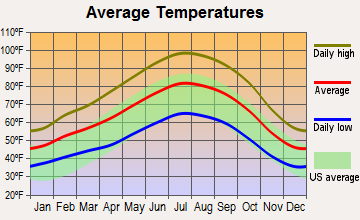
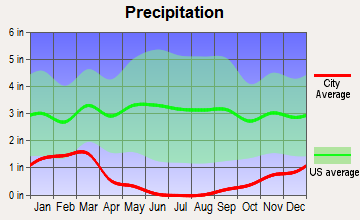
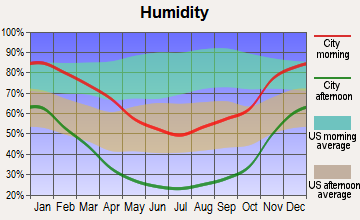
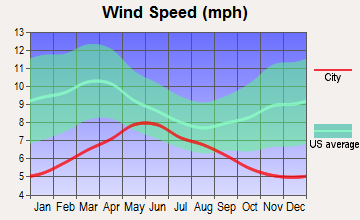
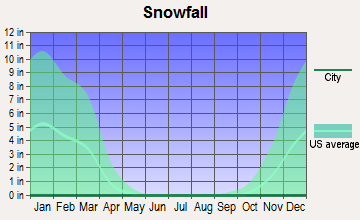
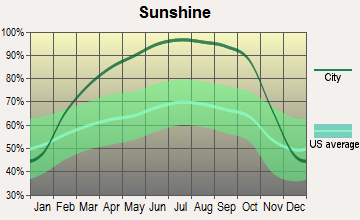
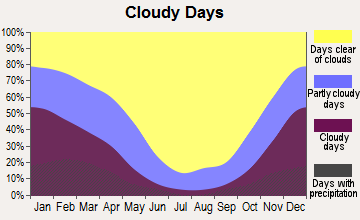
Average climate in Delano, California
Based on data reported by over 4,000 weather stations
|
|


(lower is better)
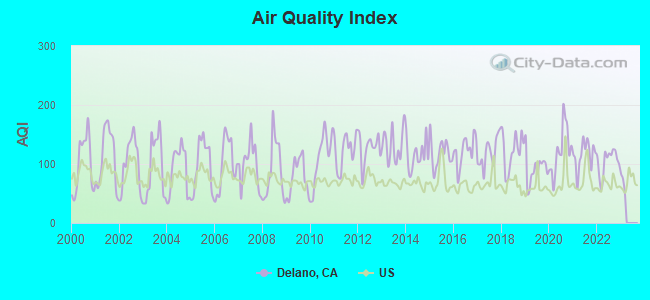
Air Quality Index (AQI) level in 2022 was 104. This is significantly worse than average.
| City: | 104 |
| U.S.: | 73 |
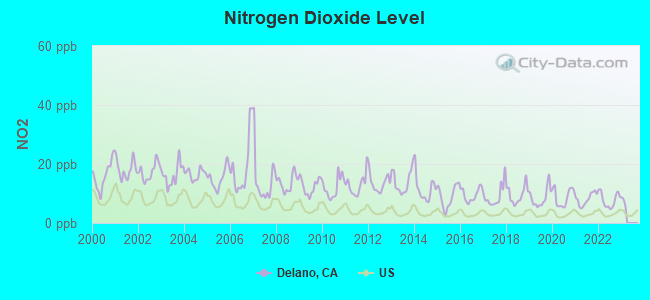
Nitrogen Dioxide (NO2) [ppb] level in 2022 was 7.81. This is significantly worse than average. Closest monitor was 18.5 miles away from the city center.
| City: | 7.81 |
| U.S.: | 5.11 |
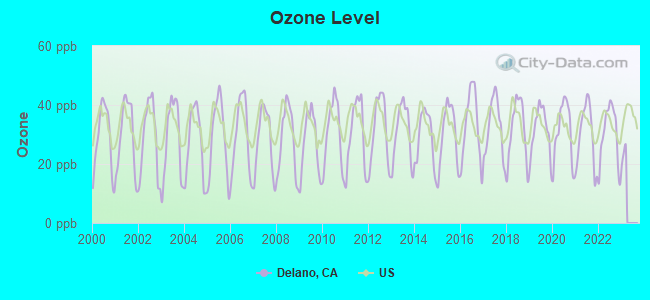
Ozone [ppb] level in 2022 was 30.0. This is about average. Closest monitor was 18.5 miles away from the city center.
| City: | 30.0 |
| U.S.: | 33.3 |
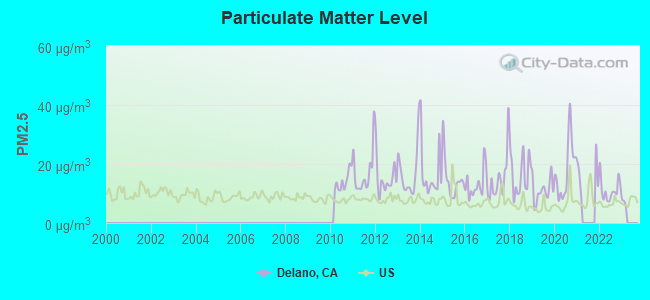
Particulate Matter (PM2.5) [µg/m3] level in 2022 was 11.2. This is worse than average. There were 0 monitors within city limits.
| City: | 11.2 |
| U.S.: | 8.1 |
Earthquake activity:
Delano-area historical earthquake activity is significantly above California state average. It is 8283% greater than the overall U.S. average.On 7/21/1952 at 11:52:14, a magnitude 7.7 (7.7 UK, Class: Major, Intensity: VIII - XII) earthquake occurred 55.0 miles away from Delano center, causing $50,000,000 total damage
On 11/4/1927 at 13:51:53, a magnitude 7.5 (7.5 UK) earthquake occurred 116.8 miles away from Delano center
On 4/18/1906 at 13:12:21, a magnitude 7.9 (7.9 UK) earthquake occurred 258.7 miles away from Delano center, causing $524,000,000 total damage
On 6/28/1992 at 11:57:34, a magnitude 7.6 (6.2 MB, 7.6 MS, 7.3 MW, Depth: 0.7 mi) earthquake occurred 188.9 miles away from the city center, causing 3 deaths (1 shaking deaths, 2 other deaths) and 400 injuries, causing $100,000,000 total damage and $40,000,000 insured losses
On 10/16/1999 at 09:46:44, a magnitude 7.4 (6.3 MB, 7.4 MS, 7.2 MW, 7.3 ML) earthquake occurred 181.1 miles away from Delano center
On 5/2/1983 at 23:42:37, a magnitude 6.7 (6.2 MB, 6.5 MS, 6.5 MW, 6.7 ML, Class: Strong, Intensity: VII - IX) earthquake occurred 66.8 miles away from the city center, causing $31,000,000 total damage
Magnitude types: body-wave magnitude (MB), local magnitude (ML), surface-wave magnitude (MS), moment magnitude (MW)
Natural disasters:
The number of natural disasters in Kern County (29) is a lot greater than the US average (15).Major Disasters (Presidential) Declared: 14
Emergencies Declared: 3
Causes of natural disasters: Fires: 12, Floods: 12, Storms: 7, Winter Storms: 5, Mudslides: 4, Landslides: 3, Freezes: 2, Drought: 1, Heavy Rain: 1, Hurricane: 1, Snow: 1, Tornado: 1, Wind: 1, Other: 1 (Note: some incidents may be assigned to more than one category).

Hospitals and medical centers in Delano:
- DELANO REGIONAL MEDICAL CENTER (Proprietary, provides emergency services, 1401 GARCES HIGHWAY)
- KELLY AND SCOTT'S CARE HOME (2212 5TH DRIVE)
- KELLY AND SCOTT'S CARE HOME INC #2 (1324 5TH PLACE)
- POSITIVE DIRECTIONS #8 (1755 MAIN STREET)
- BROWNING MANOR CONVALESCENT HOSPITAL (729 BROWNING ROAD)
- DELANO DISTRICT SKILLED NURSING FACILITY (1509 TOKAY STREET)
- DELANO DIALYSIS (905 MAIN STREET)
Airports and heliports located in Delano:
- Delano Municipal Airport (DLO) (Runways: 1, Itinerant Ops: 11,000, Local Ops: 8,000)
- San Joaquin Helicopters Heliport (5CA6)
Colleges/universities with over 2000 students nearest to Delano:
- Porterville College (about 24 miles; Porterville, CA; Full-time enrollment: 2,560)
- Bakersfield College (about 30 miles; Bakersfield, CA; FT enrollment: 10,325)
- California State University-Bakersfield (about 31 miles; Bakersfield, CA; FT enrollment: 7,564)
- College of the Sequoias (about 39 miles; Visalia, CA; FT enrollment: 6,982)
- San Joaquin Valley College-Visalia (about 40 miles; Visalia, CA; FT enrollment: 2,386)
- Taft College (about 45 miles; Taft, CA; FT enrollment: 2,121)
- West Hills College-Lemoore (about 49 miles; Lemoore, CA; FT enrollment: 2,314)
Public high schools in Delano:
- DELANO HIGH (Students: 1,369, Location: 1331 CECIL AVE., Grades: 9-12)
- CESAR E. CHAVEZ HIGH (Students: 1,100, Location: 800 BROWNING RD., Grades: 9-12)
- ROBERT F. KENNEDY HIGH (Students: 484, Location: 1401 HIETT AVE., Grades: 9-12)
- PARAMOUNT ACADEMY (Students: 99, Location: 1942 RANDOLPH ST., Grades: 6-12, Charter school)
- VALLEY HIGH (Students: 62, Location: 1927 RANDOLPH ST., Grades: 9-12)
Private high school in Delano:
Biggest public elementary/middle schools in Delano:
- ALMOND TREE MIDDLE (Students: 736, Location: 200 W. 15TH AVE., Grades: 6-8)
- CECIL AVENUE MATH AND SCIENCE ACADEMY (Students: 732, Location: 1430 CECIL AVE., Grades: 6-8, Charter school)
- LA VINA MIDDLE (Students: 647, Location: 1331 BROWNING RD., Grades: 6-8)
- MORNINGSIDE (Students: 411, Location: 2100 SUMMER DR., Grades: KG-5)
- HARVEST ELEMENTARY (Students: 361, Location: 1320 VASSAR AVE., Grades: KG-5)
- PRINCETON STREET ELEMENTARY (Students: 358, Location: 1959 PRINCETON ST., Grades: KG-5)
- ALBANY PARK ELEMENTARY (Students: 314, Location: 235 W. 20TH AVE., Grades: KG-5)
- TERRACE ELEMENTARY (Students: 313, Location: 1999 NORWALK ST., Grades: KG-5)
- COLUMBINE ELEMENTARY (Students: 152, Location: 2240 RD. 160, Grades: KG-8)
- NUEVA VISTA LANGUAGE ACADEMY (Students: 124, Location: 120 GARCES HWY., Grades: KG-5, Charter school)
User-submitted facts and corrections:
- Delano has a new comprehensive public High School: Cesar E. Chavez High School (Established 2003). This school year (2003-2004), it currently holds two classes (9th and 10th), but in two years, it will be a 4 year high school (9th through 12th). It currently has over 1000 students, but can hold around 2000. Their website is http://www.cesarchavezhighschool.org for more information.
Points of interest:
Notable locations in Delano: Delano Public Golf Course (A), Delano Ambulance (B), North Kern State Prison Fire Department (C), Kern County Building (D), Heritage Park Museum (E), Kern County Fire Department Station 37 Delano West (F), Delano Community Center (G), Kern County Fire Department Station 34 Delano (H), Delano Union Elementary School District Office (I), Delano Joint Union High School District Office (J), Delano Chamber of Commerce (K), Delano Branch Kern County Library (L), Civic Center Hall (M), Charlotte Chichester Auditorium (N). Display/hide their locations on the map
Shopping Centers: Delano Village Shopping Center (1), Randolph Village Shopping Center (2), Cecil Plaza Shopping Center (3). Display/hide their locations on the map
Churches in Delano include: Episcopal Church of the Redeemer (A), Immanuel Baptist Church (B), Saint Marys Church (C), Advent Christian Church (D), Apostolic Church (E), Bethel Chapel Filipino Assembly of God Church (F), Calvary Pentecostal Holiness of God Church (G), Christian Alliance Church (H), Church of Christ (I). Display/hide their locations on the map
Cemetery: Delano McFarland District Cemetery (1). Display/hide its location on the map
Parks in Delano include: Cecil Park (1), Cesar Chavez Park (2), Filipino Community Council Recreation Center (3), Frederick Field (4), Heritage Park (5), Jefferson Park (6), Kalibo Park (7), Memorial Park (8), Memorial Stadium (9). Display/hide their locations on the map
Tourist attraction: Delano Heritage Park (Cultural Attractions- Events- & Facilities; 330 South Lexington Street).
Hotel: Best Western Liberty Inn (14394 County Line Road).
Birthplace of: Luis Valdez - Film director, Steve Cox - Baseball player.
Drinking water stations with addresses in Delano and their reported violations in the past:
AGBAYANI VILLAGE WATER SYSTEM (Population served: 168, Groundwater):Past health violations:Past monitoring violations:
- MCL, Monthly (TCR) - In AUG-2005, Contaminant: Coliform. Follow-up actions: St AO (w/o penalty) issued (MAR-06-2006)
- Follow-up Or Routine LCR Tap M/R - In OCT-01-2010, Contaminant: Lead and Copper Rule. Follow-up actions: St Violation/Reminder Notice (FEB-13-2013)
Drinking water stations with addresses in Delano that have no violations reported:
- JAKOV DULCICH & SONS WATER SYSTEM (Population served: 40, Primary Water Source Type: Groundwater)
- LUCICH FARMS COLD STORAGE LLC WATER SYS. (Population served: 25, Primary Water Source Type: Groundwater)
| This city: | 4.1 people |
| California: | 2.9 people |
| This city: | 87.2% |
| Whole state: | 68.7% |
| This city: | 8.7% |
| Whole state: | 7.2% |
Likely homosexual households (counted as self-reported same-sex unmarried-partner households)
- Lesbian couples: 0.3% of all households
- Gay men: 0.3% of all households
People in group quarters in Delano in 2010:
- 10,530 people in state prisons
- 189 people in nursing facilities/skilled-nursing facilities
- 124 people in college/university student housing
- 28 people in group homes intended for adults
- 12 people in residential treatment centers for adults
- 9 people in workers' group living quarters and job corps centers
- 5 people in other noninstitutional facilities
People in group quarters in Delano in 2000:
- 4,805 people in state prisons
- 177 people in nursing homes
- 39 people in homes for the mentally retarded
- 20 people in homes for the mentally ill
- 13 people in homes for the physically handicapped
- 3 people in other noninstitutional group quarters
Banks with branches in Delano (2011 data):
- Citizens Business Bank: Delano Branch at 1613 Inyo Street, branch established on 1997/01/27. Info updated 2011/03/30: Bank assets: $6,475.4 mil, Deposits: $4,625.6 mil, headquarters in Ontario, CA, positive income, Commercial Lending Specialization, 46 total offices, Holding Company: Cvb Financial Corp.
- Wells Fargo Bank, National Association: Delano Branch at 920 11th Street, branch established on 1964/12/15. Info updated 2011/04/05: Bank assets: $1,161,490.0 mil, Deposits: $905,653.0 mil, headquarters in Sioux Falls, SD, positive income, 6395 total offices, Holding Company: Wells Fargo & Company
- Finance and Thrift Company: Delano Branch at 1202 Main Street, branch established on 1945/01/01. Info updated 2010/02/16: Bank assets: $129.7 mil, Deposits: $98.5 mil, headquarters in Porterville, CA, positive income, Consumer Lending Specialization, 9 total offices
- Union Bank, National Association: Delano Branch at 1308 Main Street, branch established on 1958/08/11. Info updated 2011/09/01: Bank assets: $88,967.5 mil, Deposits: $65,286.4 mil, headquarters in San Francisco, CA, positive income, Commercial Lending Specialization, 403 total offices, Holding Company: Mitsubishi Ufj Financial Group, Inc.
- Bank of America, National Association: Delano Branch at 1211 Main Street, branch established on 1955/06/20. Info updated 2009/11/18: Bank assets: $1,451,969.3 mil, Deposits: $1,077,176.8 mil, headquarters in Charlotte, NC, positive income, 5782 total offices, Holding Company: Bank Of America Corporation
- JPMorgan Chase Bank, National Association: Delano Branch at 917 Main Street, branch established on 1954/12/01. Info updated 2011/11/10: Bank assets: $1,811,678.0 mil, Deposits: $1,190,738.0 mil, headquarters in Columbus, OH, positive income, International Specialization, 5577 total offices, Holding Company: Jpmorgan Chase & Co.
- Bank of the Sierra: Delano Branch at 1126 Main Street, branch established on 2007/03/14. Info updated 2006/11/03: Bank assets: $1,332.3 mil, Deposits: $1,091.7 mil, headquarters in Porterville, CA, positive income, Commercial Lending Specialization, 26 total offices, Holding Company: Sierra Bancorp
For population 15 years and over in Delano:
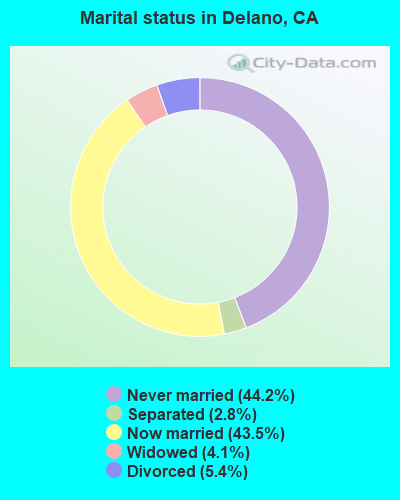
- Never married: 44.2%
- Now married: 43.5%
- Separated: 2.8%
- Widowed: 4.1%
- Divorced: 5.4%
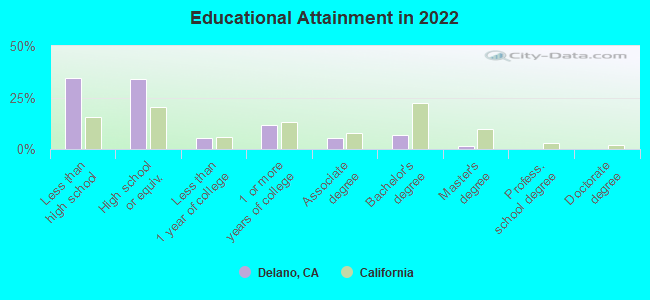
For population 25 years and over in Delano:
- High school or higher: 62.9%
- Bachelor's degree or higher: 8.3%
- Graduate or professional degree: 1.7%
- Unemployed: 30.3%
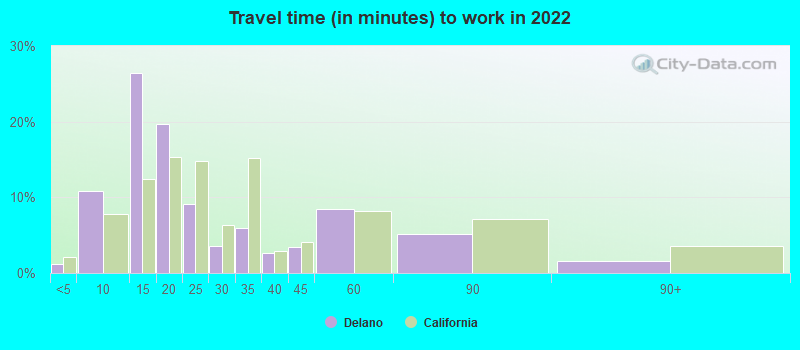
- Mean travel time to work (commute): 20.1 minutes
| Here: | 20.4 |
| California average: | 15.5 |
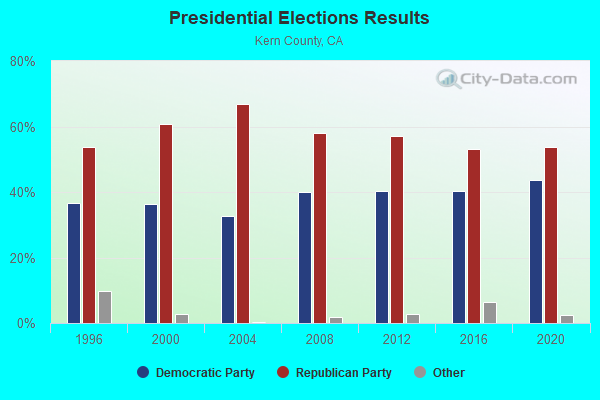
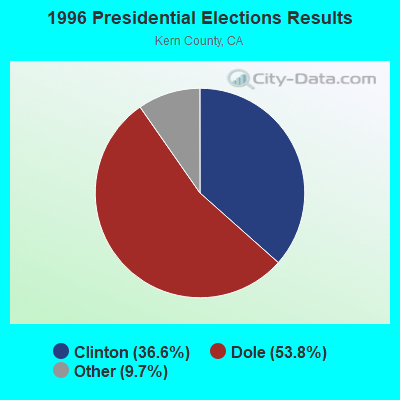
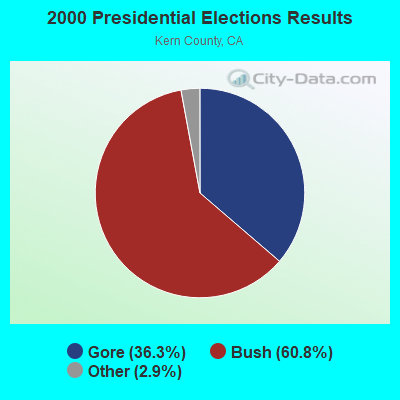
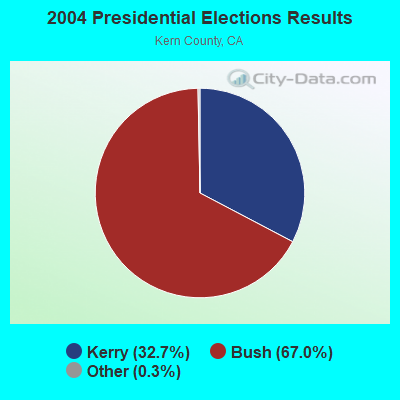
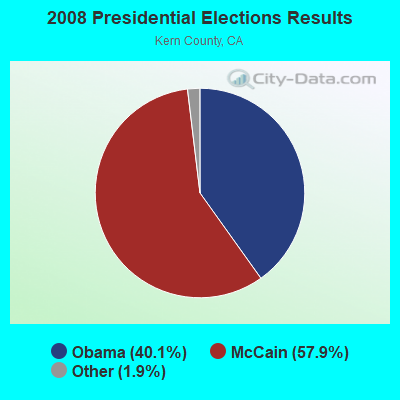
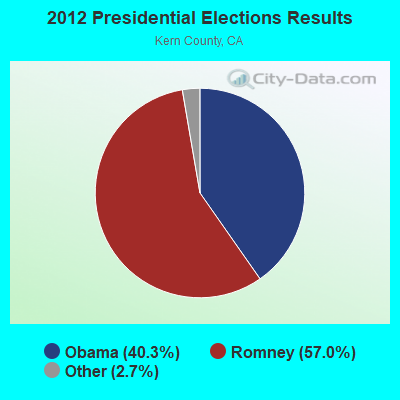
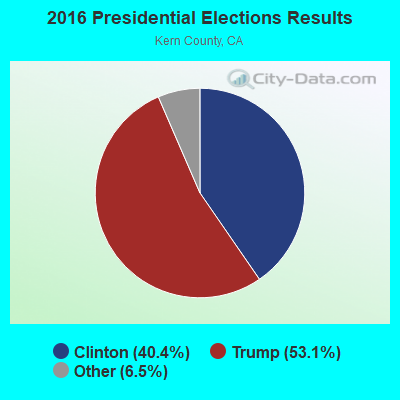
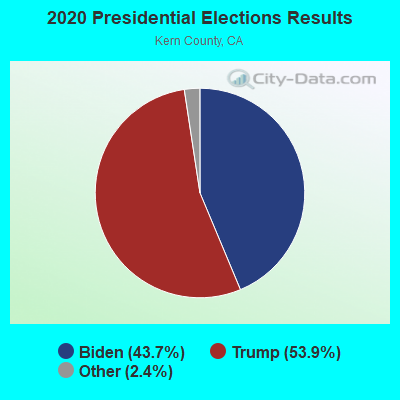
Graphs represent county-level data. Detailed 2008 Election Results
Religion statistics for Delano, CA (based on Kern County data)
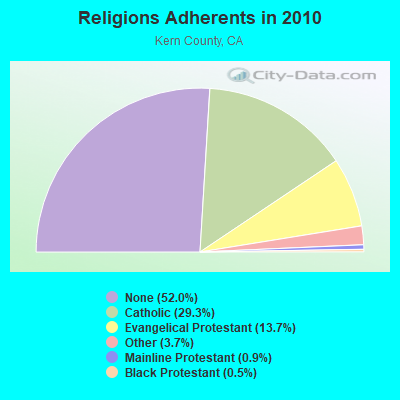
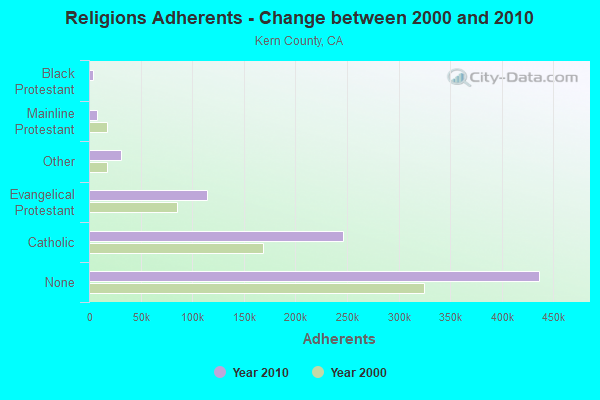
| Religion | Adherents | Congregations |
|---|---|---|
| Catholic | 245,836 | 30 |
| Evangelical Protestant | 114,724 | 436 |
| Other | 30,687 | 83 |
| Mainline Protestant | 7,459 | 38 |
| Black Protestant | 4,026 | 25 |
| Orthodox | 450 | 3 |
| None | 436,449 | - |
Food Environment Statistics:
| Kern County: | 2.41 / 10,000 pop. |
| State: | 2.14 / 10,000 pop. |
| This county: | 0.04 / 10,000 pop. |
| California: | 0.04 / 10,000 pop. |
| Kern County: | 0.80 / 10,000 pop. |
| California: | 0.62 / 10,000 pop. |
| Kern County: | 2.10 / 10,000 pop. |
| California: | 1.49 / 10,000 pop. |
| Kern County: | 4.60 / 10,000 pop. |
| California: | 7.42 / 10,000 pop. |
| This county: | 8.0% |
| State: | 7.3% |
| Kern County: | 29.4% |
| California: | 21.3% |
| Kern County: | 15.9% |
| California: | 17.9% |
Health and Nutrition:
| This city: | 46.7% |
| California: | 49.4% |
| Here: | 44.4% |
| California: | 48.0% |
| Here: | 28.0 |
| California: | 28.1 |
| This city: | 21.5% |
| California: | 20.2% |
| This city: | 12.4% |
| State: | 11.2% |
| Delano: | 6.7 |
| California: | 6.8 |
| This city: | 27.2% |
| California: | 31.5% |
| Delano: | 53.9% |
| California: | 56.4% |
| Here: | 81.7% |
| State: | 80.9% |
More about Health and Nutrition of Delano, CA Residents
| Local government employment and payroll (March 2022) | |||||
| Function | Full-time employees | Monthly full-time payroll | Average yearly full-time wage | Part-time employees | Monthly part-time payroll |
|---|---|---|---|---|---|
| Police Protection - Officers | 124 | $796,129 | $77,045 | 0 | $0 |
| Police - Other | 23 | $92,350 | $48,183 | 0 | $0 |
| Water Supply | 23 | $126,190 | $65,838 | 0 | $0 |
| Parks and Recreation | 18 | $74,287 | $49,525 | 11 | $5,954 |
| Solid Waste Management | 16 | $74,899 | $56,174 | 0 | $0 |
| Transit | 16 | $28,321 | $21,241 | 2 | $2,914 |
| Other Government Administration | 16 | $87,627 | $65,720 | 0 | $0 |
| Other and Unallocable | 14 | $70,253 | $60,217 | 1 | $2,530 |
| Sewerage | 12 | $63,854 | $63,854 | 0 | $0 |
| Financial Administration | 8 | $56,889 | $85,334 | 0 | $0 |
| Streets and Highways | 7 | $77,338 | $132,579 | 0 | $0 |
| Health | 4 | $19,567 | $58,701 | 0 | $0 |
| Airports | 1 | $4,049 | $48,588 | 0 | $0 |
| Totals for Government | 282 | $1,571,753 | $66,883 | 14 | $11,398 |
Delano government finances - Expenditure in 2017 (per resident):
- Construction - Housing and Community Development: $511,000 ($10.05)
Regular Highways: $295,000 ($5.80)
- Current Operations - General - Other: $10,987,000 ($216.10)
Police Protection: $8,927,000 ($175.58)
Water Utilities: $5,282,000 ($103.89)
Central Staff Services: $4,750,000 ($93.42)
Transit Utilities: $3,405,000 ($66.97)
Sewerage: $2,404,000 ($47.28)
Solid Waste Management: $2,233,000 ($43.92)
Parks and Recreation: $2,098,000 ($41.26)
Local Fire Protection: $1,884,000 ($37.06)
Regular Highways: $1,794,000 ($35.29)
Financial Administration: $706,000 ($13.89)
Air Transportation: $529,000 ($10.40)
Housing and Community Development: $431,000 ($8.48)
Protective Inspection and Regulation - Other: $321,000 ($6.31)
Health - Other: $19,000 ($0.37)
- General - Interest on Debt: $1,754,000 ($34.50)
- Other Capital Outlay - Police Protection: $1,621,000 ($31.88)
Regular Highways: $1,097,000 ($21.58)
Water Utilities: $539,000 ($10.60)
Transit Utilities: $89,000 ($1.75)
General - Other: $53,000 ($1.04)
Solid Waste Management: $34,000 ($0.67)
Central Staff Services: $29,000 ($0.57)
Air Transportation: $27,000 ($0.53)
Housing and Community Development: $21,000 ($0.41)
Parking Facilities: $12,000 ($0.24)
Parks and Recreation: $11,000 ($0.22)
Sewerage: $10,000 ($0.20)
- Total Salaries and Wages: $697,000 ($13.71)
- Water Utilities - Interest on Debt: $46,000 ($0.90)
Delano government finances - Revenue in 2017 (per resident):
- Charges - Other: $17,798,000 ($350.06)
Sewerage: $6,588,000 ($129.58)
Solid Waste Management: $3,521,000 ($69.25)
Air Transportation: $365,000 ($7.18)
Regular Highways: $274,000 ($5.39)
Parks and Recreation: $109,000 ($2.14)
- Federal Intergovernmental - Transit Utilities: $1,029,000 ($20.24)
Housing and Community Development: $544,000 ($10.70)
Air Transportation: $218,000 ($4.29)
Other: $165,000 ($3.25)
- Local Intergovernmental - Transit Utilities: $1,445,000 ($28.42)
Other: $59,000 ($1.16)
- Miscellaneous - Special Assessments: $1,453,000 ($28.58)
Interest Earnings: $598,000 ($11.76)
General Revenue - Other: $420,000 ($8.26)
Rents: $361,000 ($7.10)
Fines and Forfeits: $276,000 ($5.43)
Donations From Private Sources: $22,000 ($0.43)
- Revenue - Water Utilities: $8,757,000 ($172.24)
Transit Utilities: $299,000 ($5.88)
- State Intergovernmental - Other: $2,782,000 ($54.72)
Highways: $967,000 ($19.02)
Transit Utilities: $107,000 ($2.10)
Sewerage: $20,000 ($0.39)
General Local Government Support: $18,000 ($0.35)
- Tax - General Sales and Gross Receipts: $12,015,000 ($236.32)
Property: $9,728,000 ($191.33)
Public Utilities Sales: $789,000 ($15.52)
Other License: $368,000 ($7.24)
Other Selective Sales: $338,000 ($6.65)
Occupation and Business License - Other: $171,000 ($3.36)
Other: $132,000 ($2.60)
Documentary and Stock Transfer: $35,000 ($0.69)
Delano government finances - Debt in 2017 (per resident):
- Long Term Debt - Beginning Outstanding - Unspecified Public Purpose: $67,893,000 ($1335.35)
Outstanding Unspecified Public Purpose: $65,213,000 ($1282.63)
Retired Unspecified Public Purpose: $3,973,000 ($78.14)
Issue, Unspecified Public Purpose: $1,293,000 ($25.43)
Delano government finances - Cash and Securities in 2017 (per resident):
- Bond Funds - Cash and Securities: $623,000 ($12.25)
- Other Funds - Cash and Securities: $54,678,000 ($1075.43)
- Sinking Funds - Cash and Securities: $6,484,000 ($127.53)
4.83% of this county's 2021 resident taxpayers lived in other counties in 2020 ($47,246 average adjusted gross income)
| Here: | 4.83% |
| California average: | 5.19% |
0.03% of residents moved from foreign countries ($334 average AGI)
Kern County: 0.03% California average: 0.03%
Top counties from which taxpayers relocated into this county between 2020 and 2021:
| from Los Angeles County, CA | |
| from San Bernardino County, CA | |
| from Tulare County, CA |
4.56% of this county's 2020 resident taxpayers moved to other counties in 2021 ($61,654 average adjusted gross income)
| Here: | 4.56% |
| California average: | 6.14% |
0.03% of residents moved to foreign countries ($342 average AGI)
Kern County: 0.03% California average: 0.02%
Top counties to which taxpayers relocated from this county between 2020 and 2021:
| to Los Angeles County, CA | |
| to Tulare County, CA | |
| to San Diego County, CA |
| Businesses in Delano, CA | ||||
| Name | Count | Name | Count | |
|---|---|---|---|---|
| 99 Cents Only Stores | 1 | Kmart | 1 | |
| AT&T | 1 | Little Caesars Pizza | 1 | |
| Ace Hardware | 1 | McDonald's | 1 | |
| AutoZone | 1 | Nike | 2 | |
| Best Western | 1 | Payless | 1 | |
| Blockbuster | 1 | Pizza Hut | 1 | |
| Burger King | 1 | Quiznos | 1 | |
| Chevrolet | 1 | RadioShack | 1 | |
| DHL | 1 | Rite Aid | 1 | |
| Dennys | 1 | Rodeway Inn | 1 | |
| Domino's Pizza | 1 | Sears | 1 | |
| FedEx | 2 | Starbucks | 1 | |
| GNC | 1 | Subway | 4 | |
| Goodwill | 1 | T-Mobile | 2 | |
| H&R Block | 2 | Taco Bell | 1 | |
| Holiday Inn | 1 | True Value | 2 | |
| Home Depot | 1 | U-Haul | 3 | |
| JCPenney | 1 | UPS | 2 | |
| Jack In The Box | 1 | Vans | 1 | |
| KFC | 1 | |||
Strongest AM radio stations in Delano:
- KERI (1180 AM; 50 kW; WASCO-GREENACRES, CA; Owner: KWSO, INC.)
- KCHJ (1010 AM; 5 kW; DELANO, CA; Owner: ILLINOIS LOTUS CORP.)
- KWRU (940 AM; 50 kW; FRESNO, CA)
- KMJ (580 AM; 50 kW; FRESNO, CA; Owner: INFINITY RADIO OPERATIONS INC.)
- KNZR (1560 AM; 25 kW; BAKERSFIELD, CA; Owner: BUCKLEY BROADCASTING CORP. OF CALIF.)
- KGDP (660 AM; 50 kW; ORCUTT, CA; Owner: RADIO REPRESENTATIVES, INC.)
- KUZZ (550 AM; 5 kW; BAKERSFIELD, CA; Owner: OWENS ONE COMPANY)
- KGET (970 AM; 5 kW; BAKERSFIELD, CA; Owner: CLEVELAND RADIO LICENSES, LLC)
- KIRN (670 AM; 35 kW; SIMI VALLEY, CA; Owner: LOTUS OXNARD CORP.)
- KJUG (1270 AM; 5 kW; TULARE, CA; Owner: WESTCOAST BROADCASTING, INC.)
- KAFY (1100 AM; 4 kW; BAKERSFIELD, CA; Owner: KAFY, INC.)
- KSPN (710 AM; 50 kW; LOS ANGELES, CA; Owner: KABC-AM RADIO, INC.)
- KLAC (570 AM; 50 kW; LOS ANGELES, CA; Owner: AMFM RADIO LICENSES, L.L.C.)
Strongest FM radio stations in Delano:
- KMQA (100.5 FM; EAST PORTERVILLE, CA; Owner: MOON BROADCASTING PORTERVILLE L.L.C.)
- K266AH (101.1 FM; BENA, CA; Owner: CALVARY CHAPEL OF TWIN FALLS, INC.)
- KTQX (90.1 FM; BAKERSFIELD, CA; Owner: RADIO BILINGUE, INC.)
- KZPO (103.3 FM; LINDSAY, CA; Owner: LINDSAY BROADCASTING)
- KDUV (88.9 FM; VISALIA, CA; Owner: COMMUNITY EDUCATIONAL B/CASTNG, INC.)
- KJUG-FM (106.7 FM; TULARE, CA; Owner: WESTCOAST BROADCASTING, INC.)
- K220EY (91.9 FM; PORTERVILLE, CA; Owner: FAMILY STATIONS, INC.)
- KUFW (90.5 FM; WOODLAKE, CA; Owner: NATIONAL FARM WORKERS SERVICE CENTER)
- KMYX-FM (92.5 FM; ARVIN, CA; Owner: FARMWORKER EDUC. RADIO NETWORK, INC.)
- KGZO (90.9 FM; SHAFTER, CA; Owner: THE ASSOCIATION FOR COMMUNITY EDUCATION, INC.)
- KKBB (99.3 FM; BAKERSFIELD, CA; Owner: BUCKLEY COMMUNICATIONS, INC.)
- K293AG (106.5 FM; TAFT, CA; Owner: CENTRO CRISTIANO DE FE, INC.)
- KFRB (91.3 FM; BAKERSFIELD, CA; Owner: FAMILY STATIONS, INC.)
- KUZZ-FM (107.9 FM; BAKERSFIELD, CA; Owner: OWENS ONE COMPANY, INC)
- KISV (94.1 FM; BAKERSFIELD, CA; Owner: AMERICAN GENERAL MEDIA CORP.)
- KGFM (101.5 FM; BAKERSFIELD, CA; Owner: LAGNIAPPE BROADCASTING, INC.)
- KDFO-FM (98.5 FM; DELANO, CA; Owner: CLEAR CHANNEL BROADCASTING LICENSES, INC.)
- KKDJ (105.3 FM; DELANO, CA; Owner: CLEAR CHANNEL BROADCASTING LICENSES, INC.)
- KIOO (99.7 FM; PORTERVILLE, CA; Owner: BUCKLEY B/CSTNG CORP OF SAN JOA VAL)
- KMAK (100.3 FM; ORANGE COVE, CA; Owner: RICHARD B. SMITH)
TV broadcast stations around Delano:
- KTRO-LP (Channel 50; LANCASTER, CA; Owner: ROBERT D. ADELMAN)
- KPMC-LP (Channel 42; BAKERSFIELD, CA; Owner: GARY M. COCOLA FAMILY TRUST)
- National Bridge Inventory (NBI) Statistics
- 23Number of bridges
- 269ft / 82.2mTotal length
- 445,452Total average daily traffic
- 95,300Total average daily truck traffic
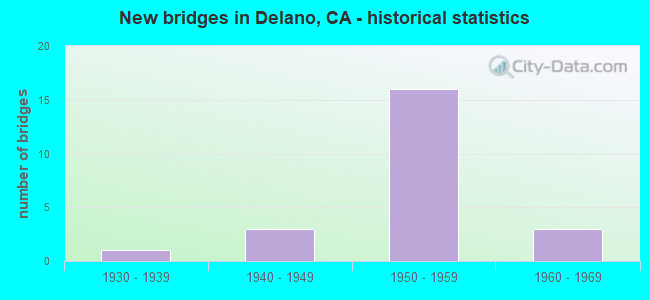
- New bridges - historical statistics
- 11930-1939
- 31940-1949
- 161950-1959
- 31960-1969
FCC Registered Antenna Towers: 154 (See the full list of FCC Registered Antenna Towers)
FCC Registered Broadcast Land Mobile Towers: 31 (See the full list of FCC Registered Broadcast Land Mobile Towers in Delano, CA)
FCC Registered Microwave Towers: 38 (See the full list of FCC Registered Microwave Towers in this town)
FCC Registered Paging Towers: 2 (See the full list of FCC Registered Paging Towers)
FCC Registered Maritime Coast & Aviation Ground Towers: 3 (See the full list of FCC Registered Maritime Coast & Aviation Ground Towers)
FCC Registered Amateur Radio Licenses: 71 (See the full list of FCC Registered Amateur Radio Licenses in Delano)
FAA Registered Aircraft: 31 (See the full list of FAA Registered Aircraft in Delano)
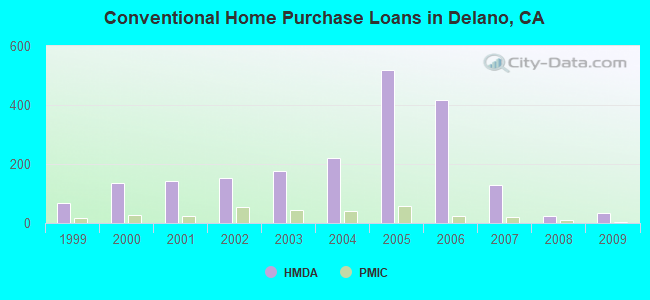
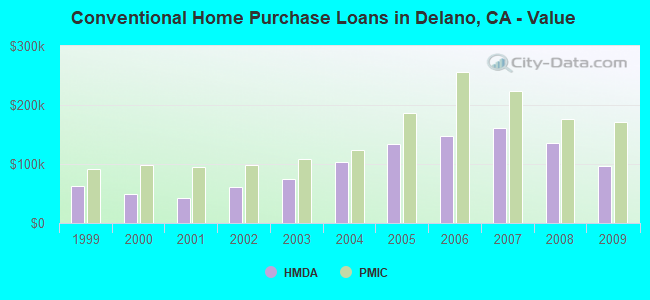
| Home Mortgage Disclosure Act Aggregated Statistics For Year 2009 (Based on 2 full and 3 partial tracts) | ||||||||||
| A) FHA, FSA/RHS & VA Home Purchase Loans | B) Conventional Home Purchase Loans | C) Refinancings | D) Home Improvement Loans | F) Non-occupant Loans on < 5 Family Dwellings (A B C & D) | ||||||
|---|---|---|---|---|---|---|---|---|---|---|
| Number | Average Value | Number | Average Value | Number | Average Value | Number | Average Value | Number | Average Value | |
| LOANS ORIGINATED | 105 | $125,217 | 33 | $96,481 | 65 | $104,005 | 6 | $75,810 | 15 | $73,064 |
| APPLICATIONS APPROVED, NOT ACCEPTED | 4 | $153,725 | 1 | $50,850 | 16 | $128,633 | 2 | $15,530 | 2 | $163,270 |
| APPLICATIONS DENIED | 19 | $112,658 | 7 | $85,373 | 97 | $144,030 | 7 | $135,464 | 13 | $112,478 |
| APPLICATIONS WITHDRAWN | 14 | $144,547 | 4 | $87,270 | 45 | $124,662 | 2 | $131,230 | 6 | $113,515 |
| FILES CLOSED FOR INCOMPLETENESS | 2 | $127,040 | 2 | $99,540 | 12 | $157,447 | 2 | $164,665 | 2 | $66,300 |
Detailed HMDA statistics for the following Tracts: 0046.01 , 0046.02, 0048.00, 0049.01, 0049.02, 0050.00
| Private Mortgage Insurance Companies Aggregated Statistics For Year 2009 (Based on 2 full and 2 partial tracts) | ||||
| A) Conventional Home Purchase Loans | B) Refinancings | |||
|---|---|---|---|---|
| Number | Average Value | Number | Average Value | |
| LOANS ORIGINATED | 2 | $171,530 | 0 | $0 |
| APPLICATIONS APPROVED, NOT ACCEPTED | 2 | $79,825 | 1 | $216,000 |
| APPLICATIONS DENIED | 0 | $0 | 0 | $0 |
| APPLICATIONS WITHDRAWN | 0 | $0 | 0 | $0 |
| FILES CLOSED FOR INCOMPLETENESS | 0 | $0 | 0 | $0 |
Detailed PMIC statistics for the following Tracts: 0046.02 , 0048.00, 0049.01, 0049.02, 0050.00
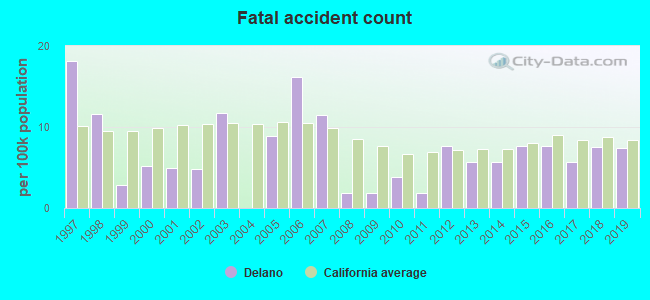
2005 - 2018 National Fire Incident Reporting System (NFIRS) incidents
- Fire incident types reported to NFIRS in Delano, CA
- 84742.4%Outside Fires
- 65832.9%Structure Fires
- 48724.4%Mobile Property/Vehicle Fires
- 80.4%Other
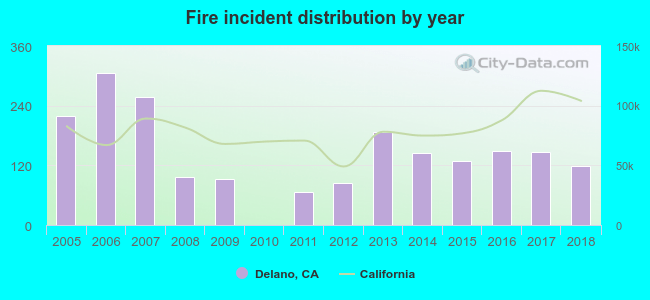 Based on the data from the years 2005 - 2018 the average number of fire incidents per year is 143. The highest number of reported fires - 306 took place in 2006, and the least - 0 in 2010. The data has a dropping trend.
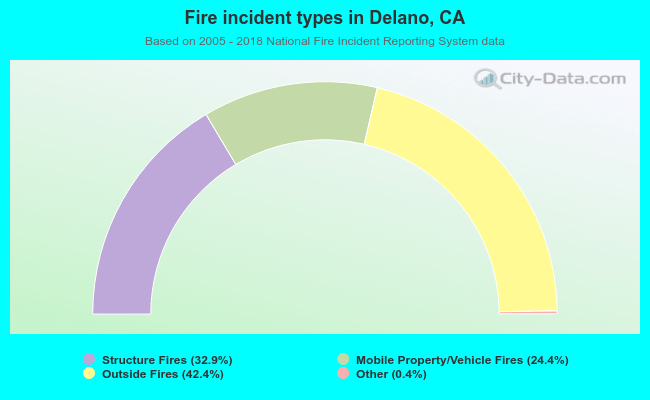 When looking into fire subcategories, the most reports belonged to: Outside Fires (42.4%), and Structure Fires (32.9%).
Fire-safe hotels and motels in Delano, California:
- Best Western Liberty Inn, 14394 County Line Rd, Delano, California 93215 , Phone: (661) 725-0976, Fax: (661) 725-6743
- Holiday Inn Express, 2222 Girard St, Delano, California 93215 , Phone: (661) 725-7272, Fax: (661) 725-6300
- Hyatt Place Delano, 1200 Garzoli Ave, Delano, California 93215 , Phone: (888) 591-1234, Fax: (661) 454-6205
| Most common first names in Delano, CA among deceased individuals | ||
| Name | Count | Lived (average) |
|---|---|---|
| Maria | 109 | 74.6 years |
| Jose | 80 | 72.5 years |
| John | 74 | 77.1 years |
| James | 68 | 72.3 years |
| Mary | 67 | 78.9 years |
| Juan | 65 | 74.6 years |
| William | 54 | 76.0 years |
| Manuel | 53 | 72.3 years |
| Joe | 48 | 69.4 years |
| Pedro | 47 | 78.2 years |
| Most common last names in Delano, CA among deceased individuals | ||
| Last name | Count | Lived (average) |
|---|---|---|
| Martinez | 49 | 71.5 years |
| Lopez | 41 | 69.5 years |
| Hernandez | 41 | 73.2 years |
| Garcia | 33 | 70.2 years |
| Rodriguez | 32 | 68.7 years |
| Chavez | 30 | 68.2 years |
| Williams | 27 | 77.0 years |
| Ramirez | 26 | 64.6 years |
| Reyes | 25 | 71.0 years |
| Gonzalez | 25 | 73.7 years |
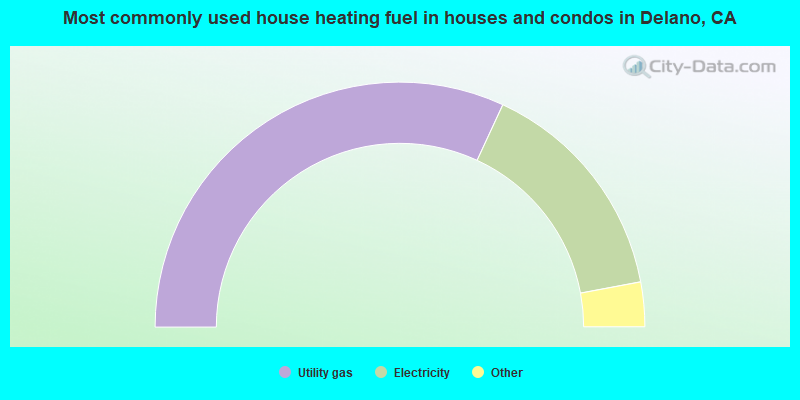
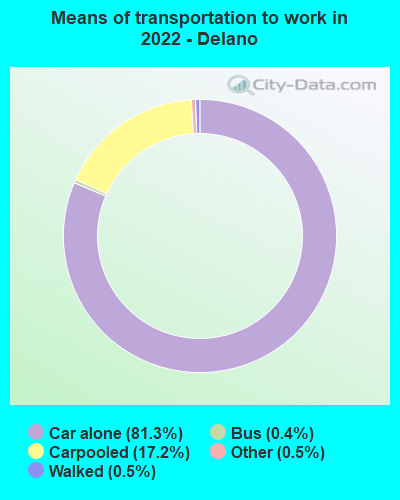
- 63.8%Utility gas
- 30.3%Electricity
- 2.8%No fuel used
- 1.8%Solar energy
- 1.4%Bottled, tank, or LP gas
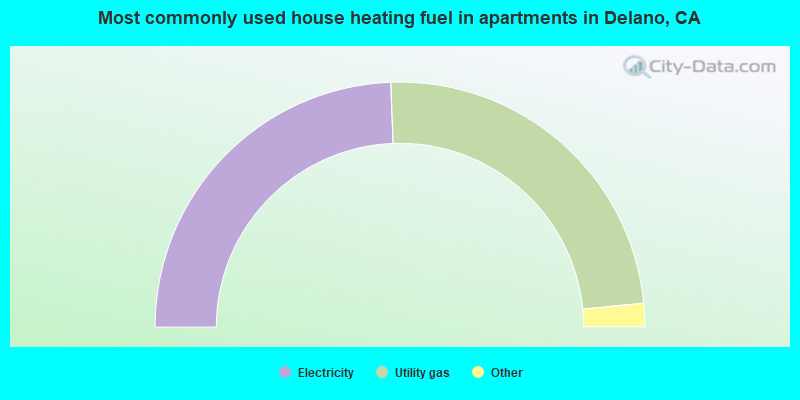
- 48.8%Electricity
- 48.1%Utility gas
- 2.2%No fuel used
- 0.7%Bottled, tank, or LP gas
- 0.2%Solar energy
Delano compared to California state average:
- Median household income below state average.
- Median house value significantly below state average.
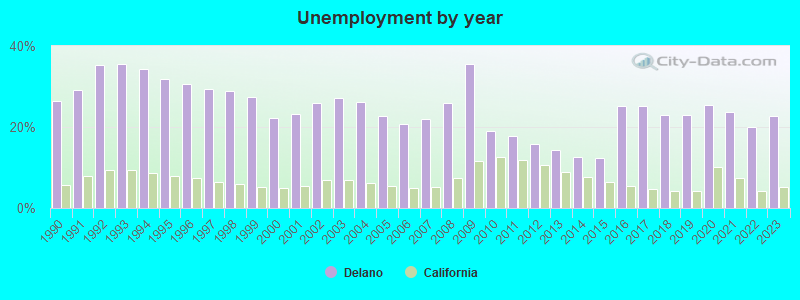
- Unemployed percentage above state average.
- Hispanic race population percentage above state average.
- Foreign-born population percentage above state average.
- Length of stay since moving in significantly above state average.
- Institutionalized population percentage significantly above state average.
- Percentage of population with a bachelor's degree or higher significantly below state average.
Delano on our top lists:
- #1 on the list of "Top 101 cities with largest percentage of males in occupations: farming, fishing, and forestry occupations (population 50,000+)"
- #1 on the list of "Top 101 cities with largest percentage of females in occupations: farming, fishing, and forestry occupations (population 50,000+)"
- #1 on the list of "Top 100 cities with the largest percentage of males (pop. 50,000+)"
- #1 on the list of "Top 101 cities with largest percentage of females in industries: agriculture, forestry, fishing and hunting (population 50,000+)"
- #2 on the list of "Top 101 cities with largest percentage of males in industries: agriculture, forestry, fishing and hunting (population 50,000+)"
- #3 on the list of "Top 101 cities with the least people having Master's or Doctorate degrees (population 50,000+)"
- #7 on the list of "Top 101 cities with the lowest number of police officers per 1000 residents (population 50,000+)"
- #7 on the list of "Top 100 least-educated cities (pop. 50,000+)"
- #15 on the list of "Top 101 cities with the largest sunshine amount differences during a year (population 50,000+)"
- #16 on the list of "Top 101 cities with the smallest percentage of elementary and middle school students in private schools (5,000+ students)"
- #21 on the list of "Top 101 cities with the lowest average yearly precipitation (population 50,000+)"
- #24 on the list of "Top 101 cities with largest percentage of females in industries: retail trade (population 50,000+)"
- #25 on the list of "Top 101 cities with the lowest percentage of English-only speaking households, population 50,000+"
- #27 on the list of "Top 101 cities with largest percentage of males in occupations: law enforcement workers including supervisors (population 50,000+)"
- #29 on the list of "Top 101 cities with the largest city-data.com crime index per police officer (population 50,000+)"
- #29 on the list of "Top 101 cities with the highest number of arson incidents per 100,000 residents, excludes tourist destinations and others with a lot of outsiders visiting based on city industries data (population 50,000+)"
- #29 on the list of "Top 101 cities with the highest average snowfall in a year (population 50,000+)"
- #30 on the list of "Top 101 cities with largest percentage of males in occupations: material moving occupations (population 50,000+)"
- #32 on the list of "Top 101 cities with largest percentage of workers with very short commute times (9 minutes or less) (population 50,000+)"
- #34 on the list of "Top 101 cities with the highest average sunshine amount (population 50,000+)"
- #21 (93250) on the list of "Top 101 zip codes with the largest percentage of Arab first ancestries"
- #56 (93250) on the list of "Top 101 zip codes with the largest percentage of returns reporting salary or wage in 2012 (pop 5,000+)"
- #74 (93250) on the list of "Top 101 zip codes with the lowest 2012 average taxable interest for individuals (pop 5,000+)"
- #89 (93250) on the list of "Top 101 zip codes with the smallest percentage of taxpayers reporting net capital gain/loss in 2012 (pop 5,000+)"
- #99 (93280) on the list of "Top 101 zip codes with the largest percentage of taxpayers using paid preparers for 2012 taxes (pop 5,000+)"
- #6 on the list of "Top 101 counties with the highest Particulate Matter (PM10) Annual air pollution readings in 2012 (µg/m3)"
- #13 on the list of "Top 101 counties with the highest carbon monoxide air pollution readings in 2012 (ppm)"
- #13 on the list of "Top 101 counties with the highest lead air pollution readings in 2012 (µg/m3)"
- #13 on the list of "Top 101 counties with the lowest lead air pollution readings in 2012 (µg/m3)"
- #17 on the list of "Top 101 counties with the highest ground withdrawal of fresh water for public supply"

|
Total of 7 patent applications in 2008-2024.