Estimated zip code population in 2022: 60,928 Zip code population in 2010: 52,849 Zip code population in 2000: 36,711
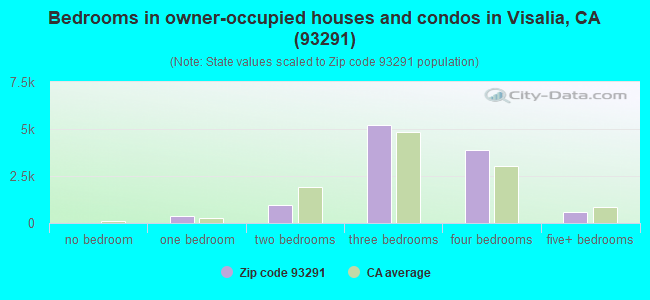
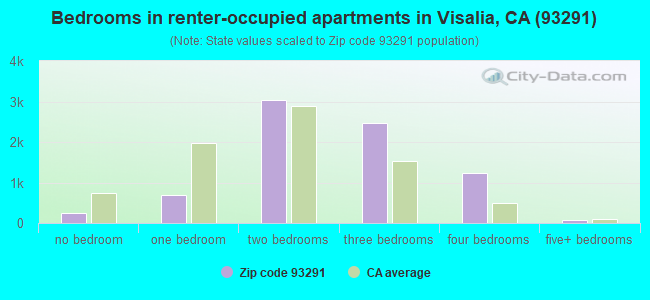
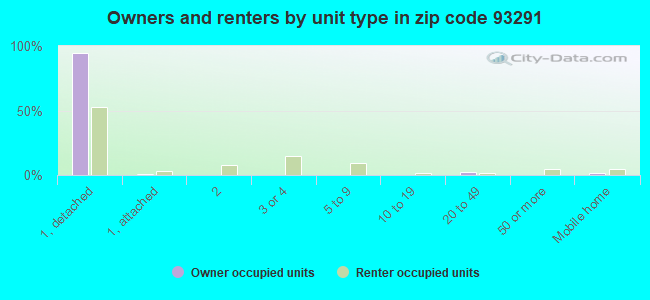
Houses and condos: 19,678 Renter-occupied apartments: 7,747
% of renters here:
41%
State:
44%
March 2022 cost of living index in zip code 93291: 89.1 (less than average, U.S. average is 100)
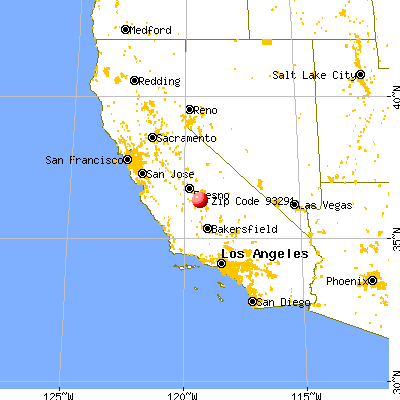
Land area: 84.6 sq. mi. Water area: 0.1 sq. mi.
Population density: 720 people per square mile
(low).
OSM Map
General Map
Google Map
MSN Map
OSM Map
General Map
Google Map
MSN Map
OSM Map
General Map
Google Map
MSN Map
OSM Map
General Map
Google Map
MSN Map
Please wait while loading the map...
Real estate property taxes paid for housing units in 2022:
This zip code:
0.8% ($3,081)
California:
0.7% ($4,831)
Median real estate property taxes paid for housing units with mortgages in 2022: $3,271 (0.8%) Median real estate property taxes paid for housing units with no mortgage in 2022: $2,707 (0.7%)
Averages for the 2020 tax year for zip code 93291, filed in 2021:
Average Adjusted Gross Income (AGI) in 2020: $70,801 (Individual Income Tax Returns)
Here:
$70,801
State:
$95,910
Salary/wage: $58,158 (reported on 86.2% of returns)
Here:
$58,158
State:
$77,331
(% of AGI for various income ranges: 1311.9% for AGIs below $25k, 4016.3% for AGIs $25k-50k, 7589.0% for AGIs $50k-75k, 11062.3% for AGIs $75k-100k, 22383.3% for AGIs $100k-200k, 89555.5% for AGIs over 200k)
Taxable interest for individuals: $1,744 (reported on 30.3% of returns)
This zip code:
$1,744
California:
$2,294
(% of AGI for various income ranges: 7.7% for AGIs below $25k, 10.2% for AGIs $25k-50k, 22.9% for AGIs $50k-75k, 42.6% for AGIs $75k-100k, 151.0% for AGIs $100k-200k, 2684.8% for AGIs over 200k)
Ordinary dividends: $7,733 (reported on 9.9% of returns)
Here:
$7,733
State:
$10,949
(% of AGI for various income ranges: 8.8% for AGIs below $25k, 15.7% for AGIs $25k-50k, 35.4% for AGIs $50k-75k, 76.6% for AGIs $75k-100k, 226.7% for AGIs $100k-200k, 3805.5% for AGIs over 200k)
Net capital gain/loss in AGI: +$32,633 (reported on 11.2% of returns)
Here:
+$32,633
State:
+$49,306
(% of AGI for various income ranges: 5.2% for AGIs below $25k, 10.3% for AGIs $25k-50k, 64.2% for AGIs $50k-75k, 87.6% for AGIs $75k-100k, 435.8% for AGIs $100k-200k, 25048.8% for AGIs over 200k)
Profit/loss from business: +$16,519 (reported on 14.3% of returns)
Here:
+$16,519
State:
+$15,671
(% of AGI for various income ranges: 109.4% for AGIs below $25k, 153.3% for AGIs $25k-50k, 231.5% for AGIs $50k-75k, 205.0% for AGIs $75k-100k, 759.1% for AGIs $100k-200k, 7659.7% for AGIs over 200k)
Taxable individual retirement arrangement distribution: $23,385 (reported on 3.7% of returns)
93291:
$23,385
California:
$23,505
(% of AGI for various income ranges: 15.7% for AGIs below $25k, 28.6% for AGIs $25k-50k, 86.0% for AGIs $50k-75k, 187.4% for AGIs $75k-100k, 425.4% for AGIs $100k-200k, 2340.9% for AGIs over 200k)
Self-employed (Keogh) retirement plans: $27,179 (reported on 0.5% of returns)
93291:
$27,179
California:
$30,163
(% of AGI for various income ranges: 3.4% for AGIs below $25k, 55.4% for AGIs $100k-200k, 803.6% for AGIs over 200k)
Total itemized deductions: $33,603 (reported on 11.7% of returns)
Here:
$33,603
State:
$39,517
(% of AGI for various income ranges: 43.9% for AGIs below $25k, 94.5% for AGIs $25k-50k, 453.9% for AGIs $50k-75k, 928.7% for AGIs $75k-100k, 1946.3% for AGIs $100k-200k, 11209.1% for AGIs over 200k)
Charity contributions: $9,528 (reported on 10.0% of returns)
Here:
$9,528
State:
$12,598
(% of AGI for various income ranges: 3.0% for AGIs below $25k, 10.2% for AGIs $25k-50k, 61.3% for AGIs $50k-75k, 152.9% for AGIs $75k-100k, 435.6% for AGIs $100k-200k, 3864.8% for AGIs over 200k)
Taxes paid: $8,419 (reported on 11.7% of returns)
93291:
$8,419
State:
$8,807
(% of AGI for various income ranges: 6.9% for AGIs below $25k, 20.4% for AGIs $25k-50k, 116.0% for AGIs $50k-75k, 288.0% for AGIs $75k-100k, 604.0% for AGIs $100k-200k, 2067.6% for AGIs over 200k)
Earned income credit: $2,416 (reported on 21.5% of returns)
Here:
$2,416
State:
$2,074
(% of AGI for various income ranges: 130.1% for AGIs below $25k, 114.1% for AGIs $25k-50k, 2.0% for AGIs $50k-75k)
Percentage of individuals using paid preparers for their 2020 taxes: 94.1%
Here:
94%
State:
92%
(% for various income ranges: 92.8% for AGIs below $25k, 94.1% for AGIs $25k-50k, 94.6% for AGIs $50k-75k, 94.3% for AGIs $75k-100k, 95.7% for AGIs $100k-200k, 96.1% for AGIs over 200k)
Averages for the 2012 tax year for zip code 93291, filed in 2013:
Average Adjusted Gross Income (AGI) in 2012: $58,450 (Individual Income Tax Returns)
Here:
$58,450
State:
$72,726
Salary/wage: $45,736 (reported on 88.3% of returns)
Here:
$45,736
State:
$59,079
(% of AGI for various income ranges: 82.1% for AGIs below $25k, 85.8% for AGIs $25k-50k, 82.8% for AGIs $50k-75k, 79.8% for AGIs $75k-100k, 77.9% for AGIs $100k-200k, 40.2% for AGIs over 200k)
Taxable interest for individuals: $2,518 (reported on 29.4% of returns)
This zip code:
$2,518
California:
$2,146
(% of AGI for various income ranges: 0.5% for AGIs below $25k, 0.4% for AGIs $25k-50k, 0.5% for AGIs $50k-75k, 0.4% for AGIs $75k-100k, 1.0% for AGIs $100k-200k, 2.8% for AGIs over 200k)
Ordinary dividends: $5,869 (reported on 10.7% of returns)
Here:
$5,869
State:
$9,308
(% of AGI for various income ranges: 0.5% for AGIs below $25k, 0.5% for AGIs $25k-50k, 0.6% for AGIs $50k-75k, 0.7% for AGIs $75k-100k, 1.0% for AGIs $100k-200k, 1.9% for AGIs over 200k)
Net capital gain/loss in AGI: +$19,719 (reported on 9.7% of returns)
Here:
+$19,719
State:
+$30,460
(% of AGI for various income ranges: 0.4% for AGIs below $25k, 0.2% for AGIs $50k-75k, 0.6% for AGIs $75k-100k, 1.5% for AGIs $100k-200k, 9.5% for AGIs over 200k)
Profit/loss from business: +$21,468 (reported on 14.2% of returns)
Here:
+$21,468
State:
+$17,064
(% of AGI for various income ranges: 7.6% for AGIs below $25k, 3.0% for AGIs $25k-50k, 3.2% for AGIs $50k-75k, 3.5% for AGIs $75k-100k, 4.4% for AGIs $100k-200k, 7.6% for AGIs over 200k)
Taxable individual retirement arrangement distribution: $21,612 (reported on 5.2% of returns)
93291:
$21,612
California:
$19,557
(% of AGI for various income ranges: 1.0% for AGIs below $25k, 1.0% for AGIs $25k-50k, 1.5% for AGIs $50k-75k, 2.0% for AGIs $75k-100k, 2.1% for AGIs $100k-200k, 2.7% for AGIs over 200k)
Self-employment retirement plans: $30,927 (reported on 0.8% of returns)
93291:
$30,927
California:
$24,530
(% of AGI for various income ranges: 0.2% for AGIs $50k-75k, 0.4% for AGIs $100k-200k, 1.0% for AGIs over 200k)
Total itemized deductions: $29,150 (23% of AGI, reported on 31.7% of returns)
Here:
$29,150
State:
$34,004
Here:
22.8% of AGI
State:
22.7% of AGI
(% of AGI for various income ranges: 5.9% for AGIs below $25k, 9.9% for AGIs $25k-50k, 17.5% for AGIs $50k-75k, 19.7% for AGIs $75k-100k, 20.4% for AGIs $100k-200k, 16.4% for AGIs over 200k)
Charity contributions: $4,577 (reported on 26.6% of returns)
Here:
$4,577
State:
$4,659
(% of AGI for various income ranges: 0.4% for AGIs below $25k, 0.9% for AGIs $25k-50k, 1.8% for AGIs $50k-75k, 2.3% for AGIs $75k-100k, 2.6% for AGIs $100k-200k, 2.8% for AGIs over 200k)
Taxes paid: $10,850 (reported on 31.6% of returns)
93291:
$10,850
State:
$14,448
(% of AGI for various income ranges: 1.2% for AGIs below $25k, 2.1% for AGIs $25k-50k, 4.2% for AGIs $50k-75k, 5.4% for AGIs $75k-100k, 7.0% for AGIs $100k-200k, 9.3% for AGIs over 200k)
Earned income credit: $2,654 (reported on 28.5% of returns)
Here:
$2,654
State:
$2,286
(% of AGI for various income ranges: 10.1% for AGIs below $25k, 2.1% for AGIs $25k-50k)
Percentage of individuals using paid preparers for their 2012 taxes: 66.1%
Here:
66%
State:
64%
(% for various income ranges: 63.8% for AGIs below $25k, 64.5% for AGIs $25k-50k, 66.2% for AGIs $50k-75k, 66.0% for AGIs $75k-100k, 73.0% for AGIs $100k-200k, 87.7% for AGIs over 200k)
Averages for the 2004 tax year for zip code 93291, filed in 2005:
Average Adjusted Gross Income (AGI) in 2004: $48,483 (Individual Income Tax Returns)
Here:
$48,483
State:
$58,600
Salary/wage: $38,184 (reported on 87.2% of returns)
Here:
$38,184
State:
$49,455
(% of AGI for various income ranges: 84.5% for AGIs $10k-25k, 85.6% for AGIs $25k-50k, 81.5% for AGIs $50k-75k, 80.1% for AGIs $75k-100k, 49.0% for AGIs over 100k)
Taxable interest for individuals: $2,583 (reported on 36.8% of returns)
This zip code:
$2,583
California:
$2,365
(% of AGI for various income ranges: 0.9% for AGIs $10k-25k, 1.0% for AGIs $25k-50k, 1.0% for AGIs $50k-75k, 1.0% for AGIs $75k-100k, 2.8% for AGIs over 100k)
Taxable dividends: $3,079 (reported on 15.9% of returns)
Here:
$3,079
State:
$4,746
(% of AGI for various income ranges: 0.6% for AGIs $10k-25k, 0.5% for AGIs $25k-50k, 0.8% for AGIs $50k-75k, 1.1% for AGIs $75k-100k, 1.2% for AGIs over 100k)
Net capital gain/loss: +$31,072 (reported on 14.7% of returns)
Here:
+$31,072
State:
+$23,418
(% of AGI for various income ranges: 0.1% for AGIs $10k-25k, 0.8% for AGIs $25k-50k, 1.9% for AGIs $50k-75k, 2.3% for AGIs $75k-100k, 17.2% for AGIs over 100k)
Profit/loss from business: +$24,473 (reported on 14.1% of returns)
Here:
+$24,473
State:
+$16,826
(% of AGI for various income ranges: 5.0% for AGIs $10k-25k, 4.1% for AGIs $25k-50k, 4.3% for AGIs $50k-75k, 5.4% for AGIs $75k-100k, 9.7% for AGIs over 100k)
IRA payment deduction: $3,536 (reported on 1.7% of returns)
93291:
$3,536
California:
$3,192
(% of AGI for various income ranges: 0.1% for AGIs $10k-25k, 0.1% for AGIs $25k-50k, 0.2% for AGIs $50k-75k, 0.2% for AGIs $75k-100k, 0.1% for AGIs over 100k)
Self-employed pension: $26,433 (reported on 1.3% of returns)
Here:
$26,433
California:
$17,688
(% of AGI for various income ranges: 0.1% for AGIs $25k-50k, 0.1% for AGIs $50k-75k, 0.4% for AGIs $75k-100k, 1.3% for AGIs over 100k)
Total itemized deductions: $24,173 (22% of AGI, reported on 32.8% of returns)
Here:
$24,173
State:
$28,113
Here:
22.5% of AGI
State:
25.3% of AGI
(% of AGI for various income ranges: 6.7% for AGIs $10k-25k, 13.8% for AGIs $25k-50k, 20.4% for AGIs $50k-75k, 21.7% for AGIs $75k-100k, 16.5% for AGIs over 100k)
Charity contributions deductions: $4,534 (4% of AGI, reported on 29.5% of returns)
Here:
$4,534
State:
$3,923
Here:
4.0% of AGI
State:
3.3% of AGI
(% of AGI for various income ranges: 0.7% for AGIs $10k-25k, 1.7% for AGIs $25k-50k, 2.9% for AGIs $50k-75k, 3.1% for AGIs $75k-100k, 3.4% for AGIs over 100k)
Total tax: $10,081 (reported on 62.3% of returns)
93291:
$10,081
State:
$10,761
(% of AGI for various income ranges: 2.9% for AGIs $10k-25k, 5.1% for AGIs $25k-50k, 8.0% for AGIs $50k-75k, 9.5% for AGIs $75k-100k, 19.7% for AGIs over 100k)
Earned income credit: $2,096 (reported on 28.3% of returns)
Here:
$2,096
State:
$1,763
Percentage of individuals using paid preparers for their 2004 taxes: 71.1%
Here:
71%
State:
66%
(% for various income ranges: 65.6% for AGIs below $10k, 72.2% for AGIs $10k-25k, 69.5% for AGIs $25k-50k, 69.7% for AGIs $50k-75k, 74.5% for AGIs $75k-100k, 83.0% for AGIs over 100k)
Household received Food Stamps/SNAP in the past 12 months: 4,190 Household did not receive Food Stamps/SNAP in the past 12 months: 14,960
Women who had a birth in the past 12 months: 887 (644 now married, 242 unmarried) Women who did not have a birth in the past 12 months: 14,248 (6,550 now married, 7,661 unmarried)
Housing units in zip code 93291 with a mortgage: 8,231 (587 second mortgage, 122 home equity loan, 196 both second mortgage and home equity loan) Houses without a mortgage: 34
Median monthly owner costs for units with a mortgage: $1,951 Median monthly owner costs for units without a mortgage: $633
Residents with income below the poverty level in 2022:
This zip code:
13.8%
Whole state:
12.2%
Residents with income below 50% of the poverty level in 2022:
This zip code:
4.8%
Whole state:
6.2%
Median number of rooms in houses and condos:
Here:
6.1
State:
6.0
Median number of rooms in apartments:
Here:
4.5
State:
3.9
Notable locations in this zip code not listed on our city pages
Notable locations in zip code 93291: B and D Dairy (A), Cross Creek Dairy (B), Elbow Creek Dairy (C), Jacobus DeGroot Dairy Number 1 (D), Jim Bakker Dairy (E), Red Rose Dairy (F), Shady Acres (G), Bosman Dairy (H), Delta View Farms Dairy (I), Double J Dairy (J), Mellema Dairy (K), Milk Maid Dairy (L), Milky Way Dairy (M), Mineral King Dairy (N), Nunes Brothers Dairy (O), Rocky Road Daries Complex (P), West Creek Dairy (Q), Visalia Golf Club (R), Visalia Fire Department Station 54 (S), Tulare County Fire Department Battalion 1 Goshen Fire Station 7 (T). Display/hide their locations on the map
Churches in zip code 93291 include: Ecclesia Temple Christian Community Church (A), Faith Assembly of God Church (B), Holy Family Roman Catholic Church (C), Latin American Assembly of God Church (D), The Cemetery Chapel (E), Visalia Community Covenant Church (F), Church of God of Prophecy (G), Congregation B'nai David (H), Pentecostal Holiness Church (I). Display/hide their locations on the map
Parks in zip code 93291 include: Lincoln Park (1), Fairview Village Park (2), Summers Park (3), Visalia Oaks Park (4), Mayors Park (5), Memorial Park (6), Village Park (7), Willow Glen Park (8). Display/hide their locations on the map
11,172 married couples with children.
4,380 single-parent households (946 men, 3,434 women).
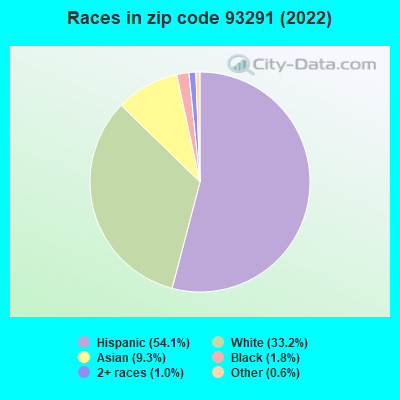
55.1% of residents of 93291 zip code speak English at home.
36.9% of residents speak Spanish at home (66% very well, 14% well, 12% not well, 8% not at all).
1.7% of residents speak other Indo-European language at home (81% very well, 5% well, 10% not well, 4% not at all).
5.1% of residents speak Asian or Pacific Island language at home (66% very well, 18% well, 14% not well, 3% not at all).
1.0% of residents speak other language at home (86% very well, 10% well, 4% not well).
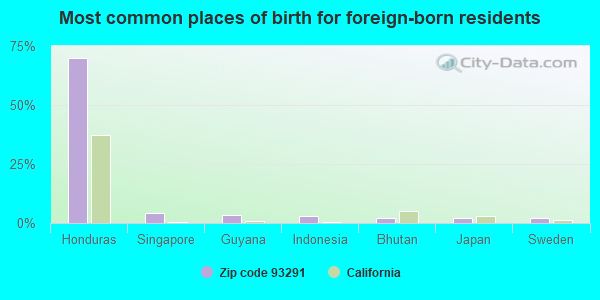
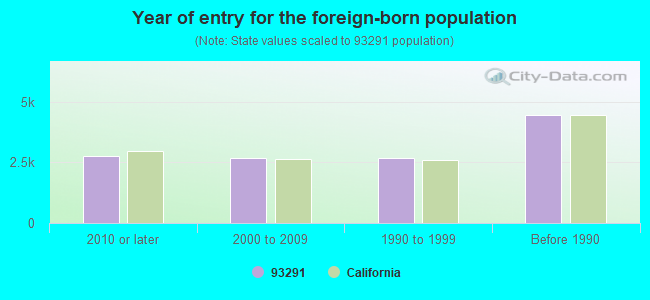
Foreign born population: 11,644 (19.1%) (42.3% of them are naturalized citizens)
Major facilities with environmental interests located in this zip code:
KAWNEER COMPANY INCORPORATED (7200 DOE AVENUE in VISALIA, CA)
STATE MASTER (California - Hazardous Waste Tracking) - HAZARDOU WASTE PROGRAM CRITERIA AND HAZARDOUS AIR POLLUTANT INVENTORY (Inventory of air pollution sources) HAZARDOUS WASTE BIENNIAL REPORTER (Resource Conservation and Recovery Act (tracking hazardous waste)) Large Quantity Generators, more that 1000 kg of hazardous waste/month (Resource Conservation and Recovery Act (tracking hazardous waste)) TRI REPORTER (Tracking of toxic chemicals releasing facilities) Business SIC classification: METAL DOORS, SASH, FRAMES, MOLDING, AND TRIM Business NAICS classification: METAL WINDOW AND DOOR MANUFACTURING.; METAL WINDOW AND DOOR MANUFACTURING. Organizations: KAWNEER CO INC (CONTACT/OPERATOR)
, ALCOA (CONTACT/OWNER)
HELLER PERFORMANCE POLYMERS INCORPORATED (7227 DOE AVE. in VISALIA, CA)
STATE MASTER (California - Hazardous Waste Tracking) - HAZARDOU WASTE PROGRAM CRITERIA AND HAZARDOUS AIR POLLUTANT INVENTORY (Inventory of air pollution sources) Small Quantity Generators, between 100 kg and 1000 kg of hazardous waste/month (Resource Conservation and Recovery Act (tracking hazardous waste)) TSD (Resource Conservation and Recovery Act (tracking hazardous waste)) TRI REPORTER (Tracking of toxic chemicals releasing facilities) Business SIC classification: CUSTOM COMPOUNDING OF PURCHASED PLASTICS RESINS; PLASTICS PRODUCTS Business NAICS classification: CUSTOM COMPOUNDING OF PURCHASED RESINS. Organizations: HELLER PERFORMANCE POLYMERS, INC. (CONTACT/OPERATOR)
MOORE BUSINESS FORMS & SYSTEMS DIVISION (7801 AVE. 304 in VISALIA, CA)
STATE MASTER (California - Hazardous Waste Tracking) - HAZARDOU WASTE PROGRAM CRITERIA AND HAZARDOUS AIR POLLUTANT INVENTORY (Inventory of air pollution sources) Small Quantity Generators, between 100 kg and 1000 kg of hazardous waste/month (Resource Conservation and Recovery Act (tracking hazardous waste)) TRI REPORTER (Tracking of toxic chemicals releasing facilities) Business SIC and NAICS classification: MANIFOLD BUSINESS FORMS Alternative names: MOORE BUSINESS FORMS INC, MOORE NORTH AMERICA
FOREIGN AUTO WORKS (210 NORTH TIPTON STREET in VISALIA, CA)
STATE MASTER (California - Hazardous Waste Tracking) - HAZARDOU WASTE PROGRAM Small Quantity Generators, between 100 kg and 1000 kg of hazardous waste/month (Resource Conservation and Recovery Act (tracking hazardous waste)) - notification Business NAICS classification: GENERAL AUTOMOTIVE REPAIR. Organizations: MARK FRANICH (CONTACT/OWNER)
CAL TRANS (700 E MURRAY in VISALIA, CA)
STATE MASTER (California - Hazardous Waste Tracking) - HAZARDOU WASTE PROGRAM Small Quantity Generators, between 100 kg and 1000 kg of hazardous waste/month (Resource Conservation and Recovery Act (tracking hazardous waste)) - notification Organizations: CALIFORNIA DOT (CONTACT/OWNER)
Alternative names: CALTRANS DISTRICT 6
JIMS FORMAL WEAR (8731 W DOE AVE in VISALIA, CA)
STATE MASTER (California - Hazardous Waste Tracking) - HAZARDOU WASTE PROGRAM Small Quantity Generators, between 100 kg and 1000 kg of hazardous waste/month (Resource Conservation and Recovery Act (tracking hazardous waste)) - notification Organizations: GARY L DAVIS (CONTACT/OWNER)
HIGHLAND ELEMENTARY (701 N. STEVENSON in VISALIA, CA)
(National Center for Education Statistics) - STATE ID-6054613 Organizations: VISALIA UNIFIED (SCHOOL DISTRICT)
FAIRVIEW ELEMENTARY (1051 ROBIN DR. in VISALIA, CA)
(National Center for Education Statistics) - STATE ID-6054589 Organizations: VISALIA UNIFIED (SCHOOL DISTRICT)
JUVENILE COURT SCHOOLS (2637 W. BURRELL AVE. in VISALIA, CA)
(National Center for Education Statistics) - STATE ID-5430061 Organizations: TULARE CO. OFFICE OF EDUCATION (SCHOOL DISTRICT)
HOUSTON ELEMENTARY (1200 N. GIDDINGS in VISALIA, CA)
(National Center for Education Statistics) - STATE ID-6054621 Organizations: VISALIA UNIFIED (SCHOOL DISTRICT)
GREEN ACRES MIDDLE (1147 N. MOONEY BLVD. in VISALIA, CA)
(National Center for Education Statistics) - STATE ID-6054605 Organizations: VISALIA UNIFIED (SCHOOL DISTRICT)
HURLEY ELEMENTARY (6600 WEST HURLEY in VISALIA, CA)
(National Center for Education Statistics) - STATE ID-6110902 Organizations: VISALIA UNIFIED (SCHOOL DISTRICT)
LEYENDEKKER PARCEL (AVENUE 360 NEAR JUNCTION OF ROAD 100 in VISALIA, CA)
(Integrated Compliance Information System) - ICIS-09-2002-0170, FORMAL ENFORCEMENT ACTION, ICIS-09-2004-0352, Business SIC classification: GRAPES
Housing units lacking complete plumbing facilities: 1.4% Housing units lacking complete kitchen facilities: 2.0%
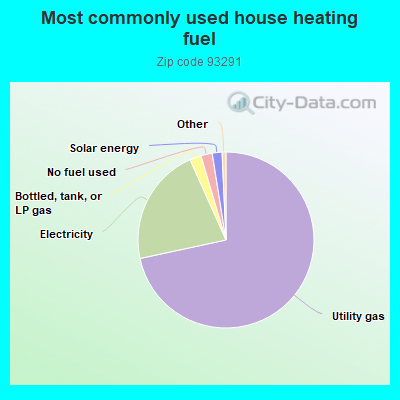
71.7%Utility gas
21.7%Electricity
2.1%Bottled, tank, or LP gas
2.1%No fuel used
1.8%Solar energy
Population in 1990: 46,656.
Place of birth for U.S.-born residents:
This state: 41,082
Northeast: 1,194
Midwest: 1,499
South: 2,186
West: 2,378
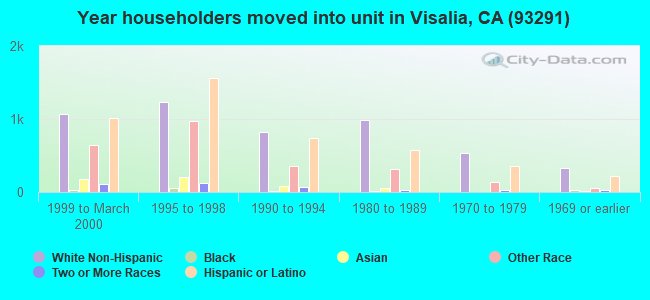
50% of the 93291 zip code residents lived in the same house 5 years ago. Out of people who lived in different houses, 73% lived in this county. Out of people who lived in different counties, 50% lived in California.
91% of the 93291 zip code residents lived in the same house 1 year ago. Out of people who lived in different houses, 75% moved from this county. Out of people who lived in different houses, 21% moved from different county within same state. Out of people who lived in different houses, 1% moved from different state. Out of people who lived in different houses, 2% moved from abroad.
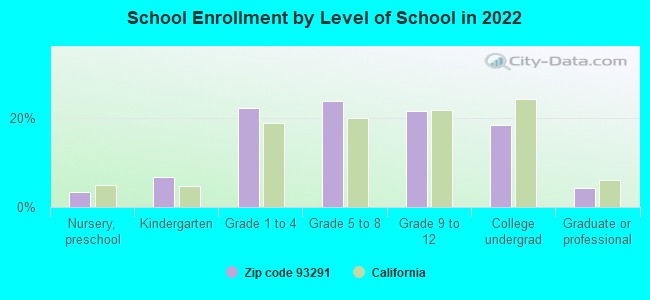
Private vs. public school enrollment:
Students in private schools in grades 1 to 8 (elementary and middle school): 992
Here:
12.4%
California:
10.5%
Students in private schools in grades 9 to 12 (high school): 111
Here:
3.0%
California:
8.5%
Students in private undergraduate colleges: 703
Here:
21.9%
California:
15.9%
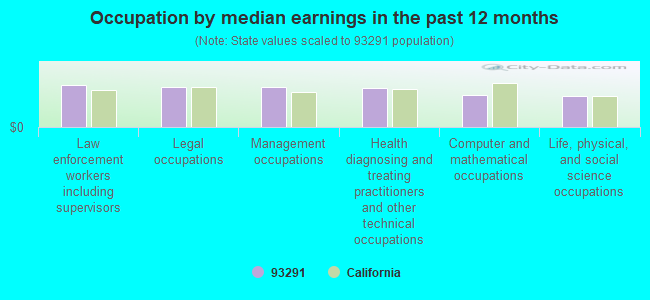
Occupation by median earnings in the past 12 months ($)
101,934Law enforcement workers including supervisors
98,272Legal occupations
96,580Management occupations
94,821Health diagnosing and treating practitioners and other technical occupations
77,665Computer and mathematical occupations
75,781Life, physical, and social science occupations
Companies with biggest federal contracts located in this zip code (VISALIA, CA):
SUSAN NEILL FRESH FRUIT COMPAN (111 S COURT ST STE 209; small business) : $2,719,713 in 87 contractsfrom 1999 to 2002
Contracts for Fruits and Vegetables by Defense Logistics Agency Signed by year:2000: $589,425; 2001: $1,519,162; 2002: $433,001; 2003: $0; 2004: $0; 2005: $0; 2006: $0.
Biggest contracts:
$65,982 with Defense Logistics Agency for Fruits and Vegetables. Signed on 2001-06-12. Completion date: 2001-06-12.
$63,358, same as above.Signed on 2001-07-09. Completion date: 2001-07-09.
$57,479, same as above.Signed on 2001-08-15. Completion date: 2001-08-15.
$48,918, same as above.Signed on 2000-12-08. Completion date: 2000-12-08.
THE TULARE COUNTY SHERIFFS DEP (36712 ROAD 112) : $561,072 in 25 contractsfrom 2000 to 2006
Contracts for Other Professional Services, Surveillance Services, Legal Services by Army, U.S. Army Corps of Engineers - civil program financing only Signed by year:2000: $66,135; 2001: $65,622; 2002: $67,726; 2003: $71,745; 2004: $100,056; 2005: $135,972; 2006: $53,816.
Biggest contracts:
$40,000 with Army for Other Professional Services. Signed on 2005-03-31. Completion date: 2005-09-30.
$40,000 with U.S. Army Corps of Engineers - civil program financing only for Other Professional Services. Signed on 2005-03-31. Completion date: 2005-09-30.
$40,000, same as above.Signed on 2000-02-14. Completion date: 2000-03-16.
$39,745 with U.S. Army Corps of Engineers - civil program financing only for Surveillance Services. Signed on 2003-02-28. Completion date: 2003-01-06.
TLC LINEN (6611 W PERSHING; small business) : $413,446 in 10 contractsfrom 2000 to 2005
Contracts for Laundry and DryCleaning Services by Navy Signed by year:2000: $43,406; 2001: $47,840; 2002: $60,000; 2003: $83,900; 2004: $38,115; 2005: $140,185; 2006: $0.
Biggest contracts:
$115,185 with Navy for Laundry and DryCleaning Services. Signed on 2005-09-27. Completion date: 2006-09-30.
$70,700, same as above.Signed on 2003-10-30. Completion date: 2004-09-30.
$60,000, same as above.Signed on 2002-10-10. Completion date: 2003-09-30.
$47,840, same as above.Signed on 2001-09-29. Completion date: 2002-09-30.
WESTERN UTILITIES TRANSFORMER (1010 N PLAZA DR; small business) : $375,558 in 11 contractsfrom 2003 to 2006
Contracts for Maintenance, Repair and Rebuilding of Equipment -- Electric Wire, and Power and Distribution Equipment, Maintenance, Repair and Rebuilding of Equipment -- Mechanical Power Transmission Equipment, Maintenance, Repair and Rebuilding of Equipment -- Electrical and Electronic Equipment Components, Miscellaneous Electric Power and Distribution Equipment, and moreby Air Force, U.S. Army Corps of Engineers - civil program financing only, Army Signed by year:2000: $0; 2001: $0; 2002: $0; 2003: $37,680; 2004: $0; 2005: $101,523; 2006: $236,355.
Biggest contracts:
$99,432 with Air Force for Maintenance, Repair and Rebuilding of Equipment -- Electric Wire, and Power and Distribution Equipment. Signed on 2006-03-02. Completion date: 2006-03-25.
$65,180, same as above.Signed on 2006-04-17. Completion date: 2006-06-29.
$59,625 with Air Force for Maintenance, Repair and Rebuilding of Equipment -- Mechanical Power Transmission Equipment. Signed on 2005-11-18. Completion date: 2005-12-15.
$55,220 with Air Force for Maintenance, Repair and Rebuilding of Equipment -- Electric Wire, and Power and Distribution Equipment. Signed on 2006-01-27. Completion date: 2006-03-27.
EVANS SALES INC (1115 W CENTER AVE; small business) : $169,241 in 5 contractsfrom 1999 to 2004
Contracts for Fruits and Vegetables by Defense Logistics Agency Signed by year:2000: $0; 2001: $0; 2002: $58,708; 2003: $58,005; 2004: $16,312; 2005: $0; 2006: $0.
Biggest contracts:
$58,708 with Defense Logistics Agency for Fruits and Vegetables. Signed on 2002-05-23. Completion date: 2002-05-23.
$36,216, same as above.Signed on 1999-11-12. Completion date: 1999-11-12.
$29,003, same as above.Signed on 2003-11-20. Completion date: 2003-11-20.
$29,002, same as above.Signed on 2003-11-03. Completion date: 2003-11-03.
EMCOTEK CORPORATION (8206 DOE AVE; small business) : $162,012 in 3 contractsfrom 2000 to 2004
$148,450 with Navy for Equipment and Materials Testing -- Furnace, Steam Plant, and Drying Equipment; and Nuclear Reactors. Signed on 2000-03-28. Completion date: 2000-06-30.
$7,112 with Army for Valves, Nonpowered. Taking place in MD. Signed on 2004-05-13. Completion date: 2004-01-14.
$6,450, same as above.Signed on 2003-12-19. Completion date: 2004-01-14.
TRI-MAG, INC (1601 N CLANCY CT; small business)
$129,660 with Defense Logistics Agency for Filters and Networks. Signed on 2004-02-11. Completion date: 2004-09-11.
EVASHKO, JOHN (212 N FLORAL ST; small business) : $91,187 in 8 contractsfrom 2004 to 2006
Contracts for Miscellaneous Items, Roofing and Siding Materials, Wire and Cable, Electrical, ADP Input/Output and Storage Devices, and moreby Defense Logistics Agency, Navy Signed by year:2000: $0; 2001: $0; 2002: $0; 2003: $0; 2004: $71,143; 2005: $10,744; 2006: $9,300.
Biggest contracts:
$44,983 with Defense Logistics Agency for Miscellaneous Items. Signed on 2004-10-25. Completion date: 2004-11-08.
$12,860 with Defense Logistics Agency for Roofing and Siding Materials. Signed on 2004-11-04. Completion date: 2004-11-18.
$10,513 with Defense Logistics Agency for Wire and Cable, Electrical. Signed on 2004-10-26. Completion date: 2004-11-26.
$9,300 with Navy for ADP Input/Output and Storage Devices. Signed on 2006-03-22. Completion date: 2006-04-10.
CLASSIC CHARTER, INC (1111 N FERNE ST; small business)
$22,480 with Navy for Passenger Motor Charter Service. Signed on 2004-11-23. Completion date: 2004-11-27.
GERARD HOMER & ASSOCIATES STR (735 WEST OAK AVENUE; small business)
$15,610 with U.S. Army Corps of Engineers - civil program financing only for Other Professional Services. Signed on 2001-08-22. Completion date: 2001-09-28.
Top industries in this zip code by the number of employees in 2005:
Health Care and Social Assistance: General Medical and Surgical Hospitals (over 1000 employees: 1 establishment)
Health Care and Social Assistance: Offices of Physicians (except Mental Health Specialists) (250-499: 1, 20-49: 5, 10-19: 8, 5-9: 10, 1-4: 39)
Administrative and Support and Waste Management and Remediation Services: Temporary Help Services (100-249: 2, 50-99: 2, 20-49: 1, 10-19: 1)
Health Care and Social Assistance: Offices of Dentists (50-99: 1, 20-49: 2, 10-19: 13, 5-9: 14, 1-4: 15)
2005 - 2018 National Fire Incident Reporting System (NFIRS) incidents
Based on the data from the years 2005 - 2018 the average number of fires per year is 188. The highest number of fires - 249 took place in 2016, and the least - 68 in 2018. The data has a decreasing trend.
When looking into fire subcategories, the most incidents belonged to: Outside Fires (50.7%), and Structure Fires (30.2%).
Fire incident types reported to NFIRS in Zip Code 93291


 Nearest zip codes: 93277, 93673, 93618, 93615, 93235, 93666.


 Based on the data from the years 2005 - 2018 the average number of fires per year is 188. The highest number of fires - 249 took place in 2016, and the least - 68 in 2018. The data has a decreasing trend.
 When looking into fire subcategories, the most incidents belonged to: Outside Fires (50.7%), and Structure Fires (30.2%).