Estimated zip code population in 2022: 49,741
Zip code population in 2010: 48,731
Zip code population in 2000: 44,577
Houses and condos: 16,364
Renter-occupied apartments: 8,675
% of renters here:
56%State:
44%
March 2022 cost of living index in zip code 93304: 91.3
(less than average, U.S. average is 100)
Land area: 7.6
sq. mi.
Water area: 0.0
sq. mi.
Population density: 6,549 people per square mile (high).
OSM Map
General Map
Google Map
MSN Map
OSM Map
General Map
Google Map
MSN Map
OSM Map
General Map
Google Map
MSN Map
OSM Map
General Map
Google Map
MSN Map
Please wait while loading the map...
Real estate property taxes paid for housing units in 2022:
This zip code:
0.9% ($1,954)California:
0.7% ($4,831)
Median real estate property taxes paid for housing units with mortgages in 2022: $2,064 (0.9%)
Median real estate property taxes paid for housing units with no mortgage in 2022: $1,717 (0.8%)
Profiles of local businesses
Business Search - 14 Million verified businesses
Males: 24,346 Females: 25,395
For population 25 years and over in 93304:
High school or higher: 69.0%Bachelor's degree or higher: 12.2%Graduate or professional degree: 2.9%Unemployed: 8.8%Mean travel time to work (commute): 21.5 minutes
For population 15 years and over in 93304:
Never married: 45.2%Now married: 35.6%Separated: 2.4%Widowed: 5.8%Divorced: 11.0%
Zip code 93304 compared to state average:
Median household income below state average. Median house value significantly below state average. Hispanic race population percentage above state average. Median age significantly below state average. Length of stay since moving in above state average. Percentage of population with a bachelor's degree or higher significantly below state average. 35,076 70.5% Hispanic or Latino 8,033 16.2% White 4,393 8.8% Black 1,044 2.1% Asian 869 1.7% Two or more races 148 0.3% Some other race 110 0.2% American Indian 65 0.1% Native Hawaiian and Other
Data:
Median household income ($)
Median household income (% change since 2000)
Household income diversity
Ratio of average income to average house value (%)
Ratio of average income to average rent
Median household income ($) - White
Median household income ($) - Black or African American
Median household income ($) - Asian
Median household income ($) - Hispanic or Latino
Median household income ($) - American Indian and Alaska Native
Median household income ($) - Multirace
Median household income ($) - Other Race
Median household income for houses/condos with a mortgage ($)
Median household income for apartments without a mortgage ($)
Races - White alone (%)
Races - White alone (% change since 2000)
Races - Black alone (%)
Races - Black alone (% change since 2000)
Races - American Indian alone (%)
Races - American Indian alone (% change since 2000)
Races - Asian alone (%)
Races - Asian alone (% change since 2000)
Races - Hispanic (%)
Races - Hispanic (% change since 2000)
Races - Native Hawaiian and Other Pacific Islander alone (%)
Races - Native Hawaiian and Other Pacific Islander alone (% change since 2000)
Races - Two or more races (%)
Races - Two or more races (% change since 2000)
Races - Other race alone (%)
Races - Other race alone (% change since 2000)
Racial diversity
Unemployment (%)
Unemployment (% change since 2000)
Unemployment (%) - White
Unemployment (%) - Black or African American
Unemployment (%) - Asian
Unemployment (%) - Hispanic or Latino
Unemployment (%) - American Indian and Alaska Native
Unemployment (%) - Multirace
Unemployment (%) - Other Race
Population density (people per square mile)
Population - Males (%)
Population - Females (%)
Population - Males (%) - White
Population - Males (%) - Black or African American
Population - Males (%) - Asian
Population - Males (%) - Hispanic or Latino
Population - Males (%) - American Indian and Alaska Native
Population - Males (%) - Multirace
Population - Males (%) - Other Race
Population - Females (%) - White
Population - Females (%) - Black or African American
Population - Females (%) - Asian
Population - Females (%) - Hispanic or Latino
Population - Females (%) - American Indian and Alaska Native
Population - Females (%) - Multirace
Population - Females (%) - Other Race
Coronavirus confirmed cases (Apr 27, 2024)
Deaths caused by coronavirus (Apr 27, 2024)
Coronavirus confirmed cases (per 100k population) (Apr 27, 2024)
Deaths caused by coronavirus (per 100k population) (Apr 27, 2024)
Daily increase in number of cases (Apr 27, 2024)
Weekly increase in number of cases (Apr 27, 2024)
Cases doubled (in days) (Apr 27, 2024)
Hospitalized patients (Apr 18, 2022)
Negative test results (Apr 18, 2022)
Total test results (Apr 18, 2022)
COVID Vaccine doses distributed (per 100k population) (Sep 19, 2023)
COVID Vaccine doses administered (per 100k population) (Sep 19, 2023)
COVID Vaccine doses distributed (Sep 19, 2023)
COVID Vaccine doses administered (Sep 19, 2023)
Likely homosexual households (%)
Likely homosexual households (% change since 2000)
Likely homosexual households - Lesbian couples (%)
Likely homosexual households - Lesbian couples (% change since 2000)
Likely homosexual households - Gay men (%)
Likely homosexual households - Gay men (% change since 2000)
Cost of living index
Median gross rent ($)
Median contract rent ($)
Median monthly housing costs ($)
Median house or condo value ($)
Median house or condo value ($ change since 2000)
Mean house or condo value by units in structure - 1, detached ($)
Mean house or condo value by units in structure - 1, attached ($)
Mean house or condo value by units in structure - 2 ($)
Mean house or condo value by units in structure by units in structure - 3 or 4 ($)
Mean house or condo value by units in structure - 5 or more ($)
Mean house or condo value by units in structure - Boat, RV, van, etc. ($)
Mean house or condo value by units in structure - Mobile home ($)
Median house or condo value ($) - White
Median house or condo value ($) - Black or African American
Median house or condo value ($) - Asian
Median house or condo value ($) - Hispanic or Latino
Median house or condo value ($) - American Indian and Alaska Native
Median house or condo value ($) - Multirace
Median house or condo value ($) - Other Race
Median resident age
Resident age diversity
Median resident age - Males
Median resident age - Females
Median resident age - White
Median resident age - Black or African American
Median resident age - Asian
Median resident age - Hispanic or Latino
Median resident age - American Indian and Alaska Native
Median resident age - Multirace
Median resident age - Other Race
Median resident age - Males - White
Median resident age - Males - Black or African American
Median resident age - Males - Asian
Median resident age - Males - Hispanic or Latino
Median resident age - Males - American Indian and Alaska Native
Median resident age - Males - Multirace
Median resident age - Males - Other Race
Median resident age - Females - White
Median resident age - Females - Black or African American
Median resident age - Females - Asian
Median resident age - Females - Hispanic or Latino
Median resident age - Females - American Indian and Alaska Native
Median resident age - Females - Multirace
Median resident age - Females - Other Race
Commute - mean travel time to work (minutes)
Travel time to work - Less than 5 minutes (%)
Travel time to work - Less than 5 minutes (% change since 2000)
Travel time to work - 5 to 9 minutes (%)
Travel time to work - 5 to 9 minutes (% change since 2000)
Travel time to work - 10 to 19 minutes (%)
Travel time to work - 10 to 19 minutes (% change since 2000)
Travel time to work - 20 to 29 minutes (%)
Travel time to work - 20 to 29 minutes (% change since 2000)
Travel time to work - 30 to 39 minutes (%)
Travel time to work - 30 to 39 minutes (% change since 2000)
Travel time to work - 40 to 59 minutes (%)
Travel time to work - 40 to 59 minutes (% change since 2000)
Travel time to work - 60 to 89 minutes (%)
Travel time to work - 60 to 89 minutes (% change since 2000)
Travel time to work - 90 or more minutes (%)
Travel time to work - 90 or more minutes (% change since 2000)
Marital status - Never married (%)
Marital status - Now married (%)
Marital status - Separated (%)
Marital status - Widowed (%)
Marital status - Divorced (%)
Median family income ($)
Median family income (% change since 2000)
Median non-family income ($)
Median non-family income (% change since 2000)
Median per capita income ($)
Median per capita income (% change since 2000)
Median family income ($) - White
Median family income ($) - Black or African American
Median family income ($) - Asian
Median family income ($) - Hispanic or Latino
Median family income ($) - American Indian and Alaska Native
Median family income ($) - Multirace
Median family income ($) - Other Race
Median year house/condo built
Median year apartment built
Year house built - Built 2005 or later (%)
Year house built - Built 2000 to 2004 (%)
Year house built - Built 1990 to 1999 (%)
Year house built - Built 1980 to 1989 (%)
Year house built - Built 1970 to 1979 (%)
Year house built - Built 1960 to 1969 (%)
Year house built - Built 1950 to 1959 (%)
Year house built - Built 1940 to 1949 (%)
Year house built - Built 1939 or earlier (%)
Average household size
Household density (households per square mile)
Average household size - White
Average household size - Black or African American
Average household size - Asian
Average household size - Hispanic or Latino
Average household size - American Indian and Alaska Native
Average household size - Multirace
Average household size - Other Race
Occupied housing units (%)
Vacant housing units (%)
Owner occupied housing units (%)
Renter occupied housing units (%)
Vacancy status - For rent (%)
Vacancy status - For sale only (%)
Vacancy status - Rented or sold, not occupied (%)
Vacancy status - For seasonal, recreational, or occasional use (%)
Vacancy status - For migrant workers (%)
Vacancy status - Other vacant (%)
Residents with income below the poverty level (%)
Residents with income below 50% of the poverty level (%)
Children below poverty level (%)
Poor families by family type - Married-couple family (%)
Poor families by family type - Male, no wife present (%)
Poor families by family type - Female, no husband present (%)
Poverty status for native-born residents (%)
Poverty status for foreign-born residents (%)
Poverty among high school graduates not in families (%)
Poverty among people who did not graduate high school not in families (%)
Residents with income below the poverty level (%) - White
Residents with income below the poverty level (%) - Black or African American
Residents with income below the poverty level (%) - Asian
Residents with income below the poverty level (%) - Hispanic or Latino
Residents with income below the poverty level (%) - American Indian and Alaska Native
Residents with income below the poverty level (%) - Multirace
Residents with income below the poverty level (%) - Other Race
Air pollution - Air Quality Index (AQI)
Air pollution - CO
Air pollution - NO2
Air pollution - SO2
Air pollution - Ozone
Air pollution - PM10
Air pollution - PM25
Air pollution - Pb
Crime - Murders per 100,000 population
Crime - Rapes per 100,000 population
Crime - Robberies per 100,000 population
Crime - Assaults per 100,000 population
Crime - Burglaries per 100,000 population
Crime - Thefts per 100,000 population
Crime - Auto thefts per 100,000 population
Crime - Arson per 100,000 population
Crime - City-data.com crime index
Crime - Violent crime index
Crime - Property crime index
Crime - Murders per 100,000 population (5 year average)
Crime - Rapes per 100,000 population (5 year average)
Crime - Robberies per 100,000 population (5 year average)
Crime - Assaults per 100,000 population (5 year average)
Crime - Burglaries per 100,000 population (5 year average)
Crime - Thefts per 100,000 population (5 year average)
Crime - Auto thefts per 100,000 population (5 year average)
Crime - Arson per 100,000 population (5 year average)
Crime - City-data.com crime index (5 year average)
Crime - Violent crime index (5 year average)
Crime - Property crime index (5 year average)
1996 Presidential Elections Results (%) - Democratic Party (Clinton)
1996 Presidential Elections Results (%) - Republican Party (Dole)
1996 Presidential Elections Results (%) - Other
2000 Presidential Elections Results (%) - Democratic Party (Gore)
2000 Presidential Elections Results (%) - Republican Party (Bush)
2000 Presidential Elections Results (%) - Other
2004 Presidential Elections Results (%) - Democratic Party (Kerry)
2004 Presidential Elections Results (%) - Republican Party (Bush)
2004 Presidential Elections Results (%) - Other
2008 Presidential Elections Results (%) - Democratic Party (Obama)
2008 Presidential Elections Results (%) - Republican Party (McCain)
2008 Presidential Elections Results (%) - Other
2012 Presidential Elections Results (%) - Democratic Party (Obama)
2012 Presidential Elections Results (%) - Republican Party (Romney)
2012 Presidential Elections Results (%) - Other
2016 Presidential Elections Results (%) - Democratic Party (Clinton)
2016 Presidential Elections Results (%) - Republican Party (Trump)
2016 Presidential Elections Results (%) - Other
2020 Presidential Elections Results (%) - Democratic Party (Biden)
2020 Presidential Elections Results (%) - Republican Party (Trump)
2020 Presidential Elections Results (%) - Other
Ancestries Reported - Arab (%)
Ancestries Reported - Czech (%)
Ancestries Reported - Danish (%)
Ancestries Reported - Dutch (%)
Ancestries Reported - English (%)
Ancestries Reported - French (%)
Ancestries Reported - French Canadian (%)
Ancestries Reported - German (%)
Ancestries Reported - Greek (%)
Ancestries Reported - Hungarian (%)
Ancestries Reported - Irish (%)
Ancestries Reported - Italian (%)
Ancestries Reported - Lithuanian (%)
Ancestries Reported - Norwegian (%)
Ancestries Reported - Polish (%)
Ancestries Reported - Portuguese (%)
Ancestries Reported - Russian (%)
Ancestries Reported - Scotch-Irish (%)
Ancestries Reported - Scottish (%)
Ancestries Reported - Slovak (%)
Ancestries Reported - Subsaharan African (%)
Ancestries Reported - Swedish (%)
Ancestries Reported - Swiss (%)
Ancestries Reported - Ukrainian (%)
Ancestries Reported - United States (%)
Ancestries Reported - Welsh (%)
Ancestries Reported - West Indian (%)
Ancestries Reported - Other (%)
Educational Attainment - No schooling completed (%)
Educational Attainment - Less than high school (%)
Educational Attainment - High school or equivalent (%)
Educational Attainment - Less than 1 year of college (%)
Educational Attainment - 1 or more years of college (%)
Educational Attainment - Associate degree (%)
Educational Attainment - Bachelor's degree (%)
Educational Attainment - Master's degree (%)
Educational Attainment - Professional school degree (%)
Educational Attainment - Doctorate degree (%)
School Enrollment - Nursery, preschool (%)
School Enrollment - Kindergarten (%)
School Enrollment - Grade 1 to 4 (%)
School Enrollment - Grade 5 to 8 (%)
School Enrollment - Grade 9 to 12 (%)
School Enrollment - College undergrad (%)
School Enrollment - Graduate or professional (%)
School Enrollment - Not enrolled in school (%)
School enrollment - Public schools (%)
School enrollment - Private schools (%)
School enrollment - Not enrolled (%)
Median number of rooms in houses and condos
Median number of rooms in apartments
Housing units lacking complete plumbing facilities (%)
Housing units lacking complete kitchen facilities (%)
Density of houses
Urban houses (%)
Rural houses (%)
Households with people 60 years and over (%)
Households with people 65 years and over (%)
Households with people 75 years and over (%)
Households with one or more nonrelatives (%)
Households with no nonrelatives (%)
Population in households (%)
Family households (%)
Nonfamily households (%)
Population in families (%)
Family households with own children (%)
Median number of bedrooms in owner occupied houses
Mean number of bedrooms in owner occupied houses
Median number of bedrooms in renter occupied houses
Mean number of bedrooms in renter occupied houses
Median number of vehichles in owner occupied houses
Mean number of vehichles in owner occupied houses
Median number of vehichles in renter occupied houses
Mean number of vehichles in renter occupied houses
Mortgage status - with mortgage (%)
Mortgage status - with second mortgage (%)
Mortgage status - with home equity loan (%)
Mortgage status - with both second mortgage and home equity loan (%)
Mortgage status - without a mortgage (%)
Average family size
Average family size - White
Average family size - Black or African American
Average family size - Asian
Average family size - Hispanic or Latino
Average family size - American Indian and Alaska Native
Average family size - Multirace
Average family size - Other Race
Geographical mobility - Same house 1 year ago (%)
Geographical mobility - Moved within same county (%)
Geographical mobility - Moved from different county within same state (%)
Geographical mobility - Moved from different state (%)
Geographical mobility - Moved from abroad (%)
Place of birth - Born in state of residence (%)
Place of birth - Born in other state (%)
Place of birth - Native, outside of US (%)
Place of birth - Foreign born (%)
Housing units in structures - 1, detached (%)
Housing units in structures - 1, attached (%)
Housing units in structures - 2 (%)
Housing units in structures - 3 or 4 (%)
Housing units in structures - 5 to 9 (%)
Housing units in structures - 10 to 19 (%)
Housing units in structures - 20 to 49 (%)
Housing units in structures - 50 or more (%)
Housing units in structures - Mobile home (%)
Housing units in structures - Boat, RV, van, etc. (%)
House/condo owner moved in on average (years ago)
Renter moved in on average (years ago)
Year householder moved into unit - Moved in 1999 to March 2000 (%)
Year householder moved into unit - Moved in 1995 to 1998 (%)
Year householder moved into unit - Moved in 1990 to 1994 (%)
Year householder moved into unit - Moved in 1980 to 1989 (%)
Year householder moved into unit - Moved in 1970 to 1979 (%)
Year householder moved into unit - Moved in 1969 or earlier (%)
Means of transportation to work - Drove car alone (%)
Means of transportation to work - Carpooled (%)
Means of transportation to work - Public transportation (%)
Means of transportation to work - Bus or trolley bus (%)
Means of transportation to work - Streetcar or trolley car (%)
Means of transportation to work - Subway or elevated (%)
Means of transportation to work - Railroad (%)
Means of transportation to work - Ferryboat (%)
Means of transportation to work - Taxicab (%)
Means of transportation to work - Motorcycle (%)
Means of transportation to work - Bicycle (%)
Means of transportation to work - Walked (%)
Means of transportation to work - Other means (%)
Working at home (%)
Industry diversity
Most Common Industries - Agriculture, forestry, fishing and hunting, and mining (%)
Most Common Industries - Agriculture, forestry, fishing and hunting (%)
Most Common Industries - Mining, quarrying, and oil and gas extraction (%)
Most Common Industries - Construction (%)
Most Common Industries - Manufacturing (%)
Most Common Industries - Wholesale trade (%)
Most Common Industries - Retail trade (%)
Most Common Industries - Transportation and warehousing, and utilities (%)
Most Common Industries - Transportation and warehousing (%)
Most Common Industries - Utilities (%)
Most Common Industries - Information (%)
Most Common Industries - Finance and insurance, and real estate and rental and leasing (%)
Most Common Industries - Finance and insurance (%)
Most Common Industries - Real estate and rental and leasing (%)
Most Common Industries - Professional, scientific, and management, and administrative and waste management services (%)
Most Common Industries - Professional, scientific, and technical services (%)
Most Common Industries - Management of companies and enterprises (%)
Most Common Industries - Administrative and support and waste management services (%)
Most Common Industries - Educational services, and health care and social assistance (%)
Most Common Industries - Educational services (%)
Most Common Industries - Health care and social assistance (%)
Most Common Industries - Arts, entertainment, and recreation, and accommodation and food services (%)
Most Common Industries - Arts, entertainment, and recreation (%)
Most Common Industries - Accommodation and food services (%)
Most Common Industries - Other services, except public administration (%)
Most Common Industries - Public administration (%)
Occupation diversity
Most Common Occupations - Management, business, science, and arts occupations (%)
Most Common Occupations - Management, business, and financial occupations (%)
Most Common Occupations - Management occupations (%)
Most Common Occupations - Business and financial operations occupations (%)
Most Common Occupations - Computer, engineering, and science occupations (%)
Most Common Occupations - Computer and mathematical occupations (%)
Most Common Occupations - Architecture and engineering occupations (%)
Most Common Occupations - Life, physical, and social science occupations (%)
Most Common Occupations - Education, legal, community service, arts, and media occupations (%)
Most Common Occupations - Community and social service occupations (%)
Most Common Occupations - Legal occupations (%)
Most Common Occupations - Education, training, and library occupations (%)
Most Common Occupations - Arts, design, entertainment, sports, and media occupations (%)
Most Common Occupations - Healthcare practitioners and technical occupations (%)
Most Common Occupations - Health diagnosing and treating practitioners and other technical occupations (%)
Most Common Occupations - Health technologists and technicians (%)
Most Common Occupations - Service occupations (%)
Most Common Occupations - Healthcare support occupations (%)
Most Common Occupations - Protective service occupations (%)
Most Common Occupations - Fire fighting and prevention, and other protective service workers including supervisors (%)
Most Common Occupations - Law enforcement workers including supervisors (%)
Most Common Occupations - Food preparation and serving related occupations (%)
Most Common Occupations - Building and grounds cleaning and maintenance occupations (%)
Most Common Occupations - Personal care and service occupations (%)
Most Common Occupations - Sales and office occupations (%)
Most Common Occupations - Sales and related occupations (%)
Most Common Occupations - Office and administrative support occupations (%)
Most Common Occupations - Natural resources, construction, and maintenance occupations (%)
Most Common Occupations - Farming, fishing, and forestry occupations (%)
Most Common Occupations - Construction and extraction occupations (%)
Most Common Occupations - Installation, maintenance, and repair occupations (%)
Most Common Occupations - Production, transportation, and material moving occupations (%)
Most Common Occupations - Production occupations (%)
Most Common Occupations - Transportation occupations (%)
Most Common Occupations - Material moving occupations (%)
People in Group quarters - Institutionalized population (%)
People in Group quarters - Correctional institutions (%)
People in Group quarters - Federal prisons and detention centers (%)
People in Group quarters - Halfway houses (%)
People in Group quarters - Local jails and other confinement facilities (including police lockups) (%)
People in Group quarters - Military disciplinary barracks (%)
People in Group quarters - State prisons (%)
People in Group quarters - Other types of correctional institutions (%)
People in Group quarters - Nursing homes (%)
People in Group quarters - Hospitals/wards, hospices, and schools for the handicapped (%)
People in Group quarters - Hospitals/wards and hospices for chronically ill (%)
People in Group quarters - Hospices or homes for chronically ill (%)
People in Group quarters - Military hospitals or wards for chronically ill (%)
People in Group quarters - Other hospitals or wards for chronically ill (%)
People in Group quarters - Hospitals or wards for drug/alcohol abuse (%)
People in Group quarters - Mental (Psychiatric) hospitals or wards (%)
People in Group quarters - Schools, hospitals, or wards for the mentally retarded (%)
People in Group quarters - Schools, hospitals, or wards for the physically handicapped (%)
People in Group quarters - Institutions for the deaf (%)
People in Group quarters - Institutions for the blind (%)
People in Group quarters - Orthopedic wards and institutions for the physically handicapped (%)
People in Group quarters - Wards in general hospitals for patients who have no usual home elsewhere (%)
People in Group quarters - Wards in military hospitals for patients who have no usual home elsewhere (%)
People in Group quarters - Juvenile institutions (%)
People in Group quarters - Long-term care (%)
People in Group quarters - Homes for abused, dependent, and neglected children (%)
People in Group quarters - Residential treatment centers for emotionally disturbed children (%)
People in Group quarters - Training schools for juvenile delinquents (%)
People in Group quarters - Short-term care, detention or diagnostic centers for delinquent children (%)
People in Group quarters - Type of juvenile institution unknown (%)
People in Group quarters - Noninstitutionalized population (%)
People in Group quarters - College dormitories (includes college quarters off campus) (%)
People in Group quarters - Military quarters (%)
People in Group quarters - On base (%)
People in Group quarters - Barracks, unaccompanied personnel housing (UPH), (Enlisted/Officer), ;and similar group living quarters for military personnel (%)
People in Group quarters - Transient quarters for temporary residents (%)
People in Group quarters - Military ships (%)
People in Group quarters - Group homes (%)
People in Group quarters - Homes or halfway houses for drug/alcohol abuse (%)
People in Group quarters - Homes for the mentally ill (%)
People in Group quarters - Homes for the mentally retarded (%)
People in Group quarters - Homes for the physically handicapped (%)
People in Group quarters - Other group homes (%)
People in Group quarters - Religious group quarters (%)
People in Group quarters - Dormitories (%)
People in Group quarters - Agriculture workers' dormitories on farms (%)
People in Group quarters - Job Corps and vocational training facilities (%)
People in Group quarters - Other workers' dormitories (%)
People in Group quarters - Crews of maritime vessels (%)
People in Group quarters - Other nonhousehold living situations (%)
People in Group quarters - Other noninstitutional group quarters (%)
Residents speaking English at home (%)
Residents speaking English at home - Born in the United States (%)
Residents speaking English at home - Native, born elsewhere (%)
Residents speaking English at home - Foreign born (%)
Residents speaking Spanish at home (%)
Residents speaking Spanish at home - Born in the United States (%)
Residents speaking Spanish at home - Native, born elsewhere (%)
Residents speaking Spanish at home - Foreign born (%)
Residents speaking other language at home (%)
Residents speaking other language at home - Born in the United States (%)
Residents speaking other language at home - Native, born elsewhere (%)
Residents speaking other language at home - Foreign born (%)
Class of Workers - Employee of private company (%)
Class of Workers - Self-employed in own incorporated business (%)
Class of Workers - Private not-for-profit wage and salary workers (%)
Class of Workers - Local government workers (%)
Class of Workers - State government workers (%)
Class of Workers - Federal government workers (%)
Class of Workers - Self-employed workers in own not incorporated business and Unpaid family workers (%)
House heating fuel used in houses and condos - Utility gas (%)
House heating fuel used in houses and condos - Bottled, tank, or LP gas (%)
House heating fuel used in houses and condos - Electricity (%)
House heating fuel used in houses and condos - Fuel oil, kerosene, etc. (%)
House heating fuel used in houses and condos - Coal or coke (%)
House heating fuel used in houses and condos - Wood (%)
House heating fuel used in houses and condos - Solar energy (%)
House heating fuel used in houses and condos - Other fuel (%)
House heating fuel used in houses and condos - No fuel used (%)
House heating fuel used in apartments - Utility gas (%)
House heating fuel used in apartments - Bottled, tank, or LP gas (%)
House heating fuel used in apartments - Electricity (%)
House heating fuel used in apartments - Fuel oil, kerosene, etc. (%)
House heating fuel used in apartments - Coal or coke (%)
House heating fuel used in apartments - Wood (%)
House heating fuel used in apartments - Solar energy (%)
House heating fuel used in apartments - Other fuel (%)
House heating fuel used in apartments - No fuel used (%)
Armed forces status - In Armed Forces (%)
Armed forces status - Civilian (%)
Armed forces status - Civilian - Veteran (%)
Armed forces status - Civilian - Nonveteran (%)
Fatal accidents locations in years 2005-2021
Fatal accidents locations in 2005
Fatal accidents locations in 2006
Fatal accidents locations in 2007
Fatal accidents locations in 2008
Fatal accidents locations in 2009
Fatal accidents locations in 2010
Fatal accidents locations in 2011
Fatal accidents locations in 2012
Fatal accidents locations in 2013
Fatal accidents locations in 2014
Fatal accidents locations in 2015
Fatal accidents locations in 2016
Fatal accidents locations in 2017
Fatal accidents locations in 2018
Fatal accidents locations in 2019
Fatal accidents locations in 2020
Fatal accidents locations in 2021
Alcohol use - People drinking some alcohol every month (%)
Alcohol use - People not drinking at all (%)
Alcohol use - Average days/month drinking alcohol
Alcohol use - Average drinks/week
Alcohol use - Average days/year people drink much
Audiometry - Average condition of hearing (%)
Audiometry - People that can hear a whisper from across a quiet room (%)
Audiometry - People that can hear normal voice from across a quiet room (%)
Audiometry - Ears ringing, roaring, buzzing (%)
Audiometry - Had a job exposure to loud noise (%)
Audiometry - Had off-work exposure to loud noise (%)
Blood Pressure & Cholesterol - Has high blood pressure (%)
Blood Pressure & Cholesterol - Checking blood pressure at home (%)
Blood Pressure & Cholesterol - Frequently checking blood cholesterol (%)
Blood Pressure & Cholesterol - Has high cholesterol level (%)
Consumer Behavior - Money monthly spent on food at supermarket/grocery store
Consumer Behavior - Money monthly spent on food at other stores
Consumer Behavior - Money monthly spent on eating out
Consumer Behavior - Money monthly spent on carryout/delivered foods
Consumer Behavior - Income spent on food at supermarket/grocery store (%)
Consumer Behavior - Income spent on food at other stores (%)
Consumer Behavior - Income spent on eating out (%)
Consumer Behavior - Income spent on carryout/delivered foods (%)
Current Health Status - General health condition (%)
Current Health Status - Blood donors (%)
Current Health Status - Has blood ever tested for HIV virus (%)
Current Health Status - Left-handed people (%)
Dermatology - People using sunscreen (%)
Diabetes - Diabetics (%)
Diabetes - Had a blood test for high blood sugar (%)
Diabetes - People taking insulin (%)
Diet Behavior & Nutrition - Diet health (%)
Diet Behavior & Nutrition - Milk product consumption (# of products/month)
Diet Behavior & Nutrition - Meals not home prepared (#/week)
Diet Behavior & Nutrition - Meals from fast food or pizza place (#/week)
Diet Behavior & Nutrition - Ready-to-eat foods (#/month)
Diet Behavior & Nutrition - Frozen meals/pizza (#/month)
Drug Use - People that ever used marijuana or hashish (%)
Drug Use - Ever used hard drugs (%)
Drug Use - Ever used any form of cocaine (%)
Drug Use - Ever used heroin (%)
Drug Use - Ever used methamphetamine (%)
Health Insurance - People covered by health insurance (%)
Kidney Conditions-Urology - Avg. # of times urinating at night
Medical Conditions - People with asthma (%)
Medical Conditions - People with anemia (%)
Medical Conditions - People with psoriasis (%)
Medical Conditions - People with overweight (%)
Medical Conditions - Elderly people having difficulties in thinking or remembering (%)
Medical Conditions - People who ever received blood transfusion (%)
Medical Conditions - People having trouble seeing even with glass/contacts (%)
Medical Conditions - People with arthritis (%)
Medical Conditions - People with gout (%)
Medical Conditions - People with congestive heart failure (%)
Medical Conditions - People with coronary heart disease (%)
Medical Conditions - People with angina pectoris (%)
Medical Conditions - People who ever had heart attack (%)
Medical Conditions - People who ever had stroke (%)
Medical Conditions - People with emphysema (%)
Medical Conditions - People with thyroid problem (%)
Medical Conditions - People with chronic bronchitis (%)
Medical Conditions - People with any liver condition (%)
Medical Conditions - People who ever had cancer or malignancy (%)
Mental Health - People who have little interest in doing things (%)
Mental Health - People feeling down, depressed, or hopeless (%)
Mental Health - People who have trouble sleeping or sleeping too much (%)
Mental Health - People feeling tired or having little energy (%)
Mental Health - People with poor appetite or overeating (%)
Mental Health - People feeling bad about themself (%)
Mental Health - People who have trouble concentrating on things (%)
Mental Health - People moving or speaking slowly or too fast (%)
Mental Health - People having thoughts they would be better off dead (%)
Oral Health - Average years since last visit a dentist
Oral Health - People embarrassed because of mouth (%)
Oral Health - People with gum disease (%)
Oral Health - General health of teeth and gums (%)
Oral Health - Average days a week using dental floss/device
Oral Health - Average days a week using mouthwash for dental problem
Oral Health - Average number of teeth
Pesticide Use - Households using pesticides to control insects (%)
Pesticide Use - Households using pesticides to kill weeds (%)
Physical Activity - People doing vigorous-intensity work activities (%)
Physical Activity - People doing moderate-intensity work activities (%)
Physical Activity - People walking or bicycling (%)
Physical Activity - People doing vigorous-intensity recreational activities (%)
Physical Activity - People doing moderate-intensity recreational activities (%)
Physical Activity - Average hours a day doing sedentary activities
Physical Activity - Average hours a day watching TV or videos
Physical Activity - Average hours a day using computer
Physical Functioning - People having limitations keeping them from working (%)
Physical Functioning - People limited in amount of work they can do (%)
Physical Functioning - People that need special equipment to walk (%)
Physical Functioning - People experiencing confusion/memory problems (%)
Physical Functioning - People requiring special healthcare equipment (%)
Prescription Medications - Average number of prescription medicines taking
Preventive Aspirin Use - Adults 40+ taking low-dose aspirin (%)
Reproductive Health - Vaginal deliveries (%)
Reproductive Health - Cesarean deliveries (%)
Reproductive Health - Deliveries resulted in a live birth (%)
Reproductive Health - Pregnancies resulted in a delivery (%)
Reproductive Health - Women breastfeeding newborns (%)
Reproductive Health - Women that had a hysterectomy (%)
Reproductive Health - Women that had both ovaries removed (%)
Reproductive Health - Women that have ever taken birth control pills (%)
Reproductive Health - Women taking birth control pills (%)
Reproductive Health - Women that have ever used Depo-Provera or injectables (%)
Reproductive Health - Women that have ever used female hormones (%)
Sexual Behavior - People 18+ that ever had sex (vaginal, anal, or oral) (%)
Sexual Behavior - Males 18+ that ever had vaginal sex with a woman (%)
Sexual Behavior - Males 18+ that ever performed oral sex on a woman (%)
Sexual Behavior - Males 18+ that ever had anal sex with a woman (%)
Sexual Behavior - Males 18+ that ever had any sex with a man (%)
Sexual Behavior - Females 18+ that ever had vaginal sex with a man (%)
Sexual Behavior - Females 18+ that ever performed oral sex on a man (%)
Sexual Behavior - Females 18+ that ever had anal sex with a man (%)
Sexual Behavior - Females 18+ that ever had any kind of sex with a woman (%)
Sexual Behavior - Average age people first had sex
Sexual Behavior - Average number of female sex partners in lifetime (males 18+)
Sexual Behavior - Average number of female vaginal sex partners in lifetime (males 18+)
Sexual Behavior - Average age people first performed oral sex on a woman (18+)
Sexual Behavior - Average number of woman performed oral sex on in lifetime (18+)
Sexual Behavior - Average number of male sex partners in lifetime (males 18+)
Sexual Behavior - Average number of male anal sex partners in lifetime (males 18+)
Sexual Behavior - Average age people first performed oral sex on a man (18+)
Sexual Behavior - Average number of male oral sex partners in lifetime (18+)
Sexual Behavior - People using protection when performing oral sex (%)
Sexual Behavior - Average number of times people have vaginal or anal sex a year
Sexual Behavior - People having sex without condom (%)
Sexual Behavior - Average number of male sex partners in lifetime (females 18+)
Sexual Behavior - Average number of male vaginal sex partners in lifetime (females 18+)
Sexual Behavior - Average number of female sex partners in lifetime (females 18+)
Sexual Behavior - Circumcised males 18+ (%)
Sleep Disorders - Average hours sleeping at night
Sleep Disorders - People that has trouble sleeping (%)
Smoking-Cigarette Use - People smoking cigarettes (%)
Taste & Smell - People 40+ having problems with smell (%)
Taste & Smell - People 40+ having problems with taste (%)
Taste & Smell - People 40+ that ever had wisdom teeth removed (%)
Taste & Smell - People 40+ that ever had tonsils teeth removed (%)
Taste & Smell - People 40+ that ever had a loss of consciousness because of a head injury (%)
Taste & Smell - People 40+ that ever had a broken nose or other serious injury to face or skull (%)
Taste & Smell - People 40+ that ever had two or more sinus infections (%)
Weight - Average height (inches)
Weight - Average weight (pounds)
Weight - Average BMI
Weight - People that are obese (%)
Weight - People that ever were obese (%)
Weight - People trying to lose weight (%)
100%
urban population.
Estimated median house/condo value in 2022: $227,485
93304:
$227,485California:
$715,900
Median resident age: This zip code:
29.8 yearsCalifornia median age:
37.9 years
Average household size: This zip code:
3.2 peopleCalifornia:
2.8 people
Averages for the 2020 tax year for zip code 93304, filed in 2021:
Average Adjusted Gross Income (AGI) in 2020: $35,209 (Individual Income Tax Returns) Here:
$35,209State:
$95,910
Salary/wage: $32,045 (reported on 84.4% of returns )Here:
$32,045State:
$77,331
(% of AGI for various income ranges: 1230.0% for AGIs below $25k , 3837.8% for AGIs $25k-50k , 7805.8% for AGIs $50k-75k , 11564.4% for AGIs $75k-100k , 17876.9% for AGIs $100k-200k ) Taxable interest for individuals: $303 (reported on 15.3% of returns )This zip code:
$303California:
$2,294
(% of AGI for various income ranges: 2.5% for AGIs below $25k , 2.6% for AGIs $25k-50k , 8.2% for AGIs $50k-75k , 20.6% for AGIs $75k-100k , 48.6% for AGIs $100k-200k ) Ordinary dividends: $2,556 (reported on 2.3% of returns )(% of AGI for various income ranges: 2.0% for AGIs below $25k , 2.5% for AGIs $25k-50k , 14.8% for AGIs $50k-75k , 33.8% for AGIs $75k-100k , 114.0% for AGIs $100k-200k ) Net capital gain/loss in AGI: +$7,316 (reported on 3.1% of returns )Here:
+$7,316State:
+$49,306
(% of AGI for various income ranges: 0.3% for AGIs below $25k , 0.5% for AGIs $25k-50k , 18.7% for AGIs $50k-75k , 50.2% for AGIs $75k-100k , 458.3% for AGIs $100k-200k ) Profit/loss from business: +$9,144 (reported on 14.7% of returns )Here:
+$9,144State:
+$15,671
(% of AGI for various income ranges: 174.4% for AGIs below $25k , 157.4% for AGIs $25k-50k , 195.2% for AGIs $50k-75k , 161.4% for AGIs $75k-100k , 1071.1% for AGIs $100k-200k ) Taxable individual retirement arrangement distribution: $13,102 (reported on 1.9% of returns )93304:
$13,102California:
$23,505
(% of AGI for various income ranges: 12.6% for AGIs below $25k , 14.4% for AGIs $25k-50k , 40.1% for AGIs $50k-75k , 169.1% for AGIs $75k-100k , 541.1% for AGIs $100k-200k ) Total itemized deductions: $24,088 (reported on 2.7% of returns )Here:
$24,088State:
$39,517
(% of AGI for various income ranges: 14.1% for AGIs below $25k , 42.1% for AGIs $25k-50k , 195.8% for AGIs $50k-75k , 392.5% for AGIs $75k-100k , 843.7% for AGIs $100k-200k ) Charity contributions: $5,711 (reported on 2.1% of returns )(% of AGI for various income ranges: 0.9% for AGIs below $25k , 5.7% for AGIs $25k-50k , 30.1% for AGIs $50k-75k , 58.9% for AGIs $75k-100k , 224.6% for AGIs $100k-200k ) Taxes paid: $6,660 (reported on 2.6% of returns )(% of AGI for various income ranges: 2.1% for AGIs below $25k , 8.8% for AGIs $25k-50k , 55.9% for AGIs $50k-75k , 130.9% for AGIs $75k-100k , 272.0% for AGIs $100k-200k ) Earned income credit: $2,576 (reported on 32.9% of returns )(% of AGI for various income ranges: 164.1% for AGIs below $25k , 124.8% for AGIs $25k-50k , 2.8% for AGIs $50k-75k ) Percentage of individuals using paid preparers for their 2020 taxes: 92.7%(% for various income ranges: 92.0% for AGIs below $25k , 94.1% for AGIs $25k-50k , 92.9% for AGIs $50k-75k , 90.6% for AGIs $75k-100k , 91.0% for AGIs $100k-200k , 100.0% for AGIs over 200k )
Averages for the 2012 tax year for zip code 93304, filed in 2013:
Average Adjusted Gross Income (AGI) in 2012: $31,001 (Individual Income Tax Returns) Here:
$31,001State:
$72,726
Salary/wage: $28,763 (reported on 86.6% of returns )Here:
$28,763State:
$59,079
(% of AGI for various income ranges: 78.2% for AGIs below $25k , 86.5% for AGIs $25k-50k , 86.0% for AGIs $50k-75k , 79.9% for AGIs $75k-100k , 77.2% for AGIs $100k-200k , 35.3% for AGIs over 200k ) Taxable interest for individuals: $570 (reported on 15.6% of returns )This zip code:
$570California:
$2,146
(% of AGI for various income ranges: 0.2% for AGIs below $25k , 0.2% for AGIs $25k-50k , 0.3% for AGIs $50k-75k , 0.3% for AGIs $75k-100k , 0.2% for AGIs $100k-200k , 1.4% for AGIs over 200k ) Ordinary dividends: $4,273 (reported on 3.5% of returns )(% of AGI for various income ranges: 0.3% for AGIs below $25k , 0.2% for AGIs $25k-50k , 0.2% for AGIs $50k-75k , 0.3% for AGIs $75k-100k , 0.8% for AGIs $100k-200k , 4.4% for AGIs over 200k ) Net capital gain/loss in AGI: +$6,779 (reported on 2.6% of returns )Here:
+$6,779State:
+$30,460
(% of AGI for various income ranges: 0.9% for AGIs $100k-200k , 11.3% for AGIs over 200k ) Profit/loss from business: +$9,826 (reported on 15.3% of returns )Here:
+$9,826State:
+$17,064
(% of AGI for various income ranges: 12.1% for AGIs below $25k , 2.9% for AGIs $25k-50k , 1.4% for AGIs $50k-75k , 1.3% for AGIs $75k-100k , 5.8% for AGIs $100k-200k ) Taxable individual retirement arrangement distribution: $10,042 (reported on 2.8% of returns )93304:
$10,042California:
$19,557
(% of AGI for various income ranges: 0.6% for AGIs below $25k , 0.7% for AGIs $25k-50k , 0.9% for AGIs $50k-75k , 1.7% for AGIs $75k-100k , 1.9% for AGIs $100k-200k ) Total itemized deductions: $18,644 (27% of AGI, reported on 15.6% of returns )Here:
$18,644State:
$34,004
Here:
26.9% of AGIState:
22.7% of AGI
(% of AGI for various income ranges: 3.1% for AGIs below $25k , 7.4% for AGIs $25k-50k , 11.8% for AGIs $50k-75k , 14.8% for AGIs $75k-100k , 15.8% for AGIs $100k-200k , 17.9% for AGIs over 200k ) Charity contributions: $2,681 (reported on 12.2% of returns )(% of AGI for various income ranges: 0.2% for AGIs below $25k , 0.7% for AGIs $25k-50k , 1.2% for AGIs $50k-75k , 1.7% for AGIs $75k-100k , 2.4% for AGIs $100k-200k , 2.5% for AGIs over 200k ) Taxes paid: $5,407 (reported on 15.5% of returns )93304:
$5,407State:
$14,448
(% of AGI for various income ranges: 0.6% for AGIs below $25k , 1.6% for AGIs $25k-50k , 3.0% for AGIs $50k-75k , 4.3% for AGIs $75k-100k , 5.7% for AGIs $100k-200k , 9.8% for AGIs over 200k ) Earned income credit: $2,808 (reported on 40.5% of returns )(% of AGI for various income ranges: 12.3% for AGIs below $25k , 2.1% for AGIs $25k-50k ) Percentage of individuals using paid preparers for their 2012 taxes: 68.3%(% for various income ranges: 66.2% for AGIs below $25k , 69.4% for AGIs $25k-50k , 71.8% for AGIs $50k-75k , 73.6% for AGIs $75k-100k , 77.3% for AGIs $100k-200k , 83.3% for AGIs over 200k )
Averages for the 2004 tax year for zip code 93304, filed in 2005:
Average Adjusted Gross Income (AGI) in 2004: $28,811 (Individual Income Tax Returns) Here:
$28,811State:
$58,600
Salary/wage: $26,756 (reported on 87.8% of returns )Here:
$26,756State:
$49,455
(% of AGI for various income ranges: 83.5% for AGIs below $10k , 82.9% for AGIs $10k-25k , 87.6% for AGIs $25k-50k , 85.7% for AGIs $50k-75k , 80.8% for AGIs $75k-100k , 54.2% for AGIs over 100k ) Taxable interest for individuals: $972 (reported on 25.8% of returns )This zip code:
$972California:
$2,365
(% of AGI for various income ranges: 1.4% for AGIs below $10k , 0.7% for AGIs $10k-25k , 0.5% for AGIs $25k-50k , 0.6% for AGIs $50k-75k , 1.1% for AGIs $75k-100k , 2.3% for AGIs over 100k ) Taxable dividends: $1,985 (reported on 6.3% of returns )(% of AGI for various income ranges: 0.9% for AGIs below $10k , 0.3% for AGIs $10k-25k , 0.2% for AGIs $25k-50k , 0.3% for AGIs $50k-75k , 0.6% for AGIs $75k-100k , 1.3% for AGIs over 100k ) Net capital gain/loss: +$11,603 (reported on 5.5% of returns )Here:
+$11,603State:
+$23,418
(% of AGI for various income ranges: -0.3% for AGIs below $10k , 0.1% for AGIs $10k-25k , 0.4% for AGIs $25k-50k , 0.9% for AGIs $50k-75k , 2.9% for AGIs $75k-100k , 14.0% for AGIs over 100k ) Profit/loss from business: +$7,994 (reported on 13.9% of returns )Here:
+$7,994State:
+$16,826
(% of AGI for various income ranges: 12.5% for AGIs below $10k , 6.9% for AGIs $10k-25k , 2.5% for AGIs $25k-50k , 1.9% for AGIs $50k-75k , 1.7% for AGIs $75k-100k , 4.3% for AGIs over 100k ) Profit/loss from farming: +$27,769 (reported on 0.1% of returns )
Here : State :
IRA payment deduction: $2,589 (reported on 1.2% of returns )93304:
$2,589California:
$3,192
(% of AGI for various income ranges: 0.1% for AGIs $10k-25k , 0.1% for AGIs $25k-50k , 0.1% for AGIs $50k-75k , 0.2% for AGIs $75k-100k , 0.1% for AGIs over 100k ) Self-employed pension: $13,789 (reported on 0.1% of returns )Here:
$13,789California:
$17,688
Total itemized deductions: $16,023 (29% of AGI, reported on 23.2% of returns )Here:
$16,023State:
$28,113
Here:
28.6% of AGIState:
25.3% of AGI
(% of AGI for various income ranges: 6.8% for AGIs below $10k , 5.9% for AGIs $10k-25k , 13.2% for AGIs $25k-50k , 17.7% for AGIs $50k-75k , 17.6% for AGIs $75k-100k , 15.1% for AGIs over 100k ) Charity contributions deductions: $2,414 (4% of AGI, reported on 20.4% of returns )Here:
4.2% of AGIState:
3.3% of AGI
(% of AGI for various income ranges: 0.4% for AGIs below $10k , 0.6% for AGIs $10k-25k , 1.5% for AGIs $25k-50k , 2.4% for AGIs $50k-75k , 2.7% for AGIs $75k-100k , 2.7% for AGIs over 100k ) Total tax: $3,345 (reported on 57.9% of returns )93304:
$3,345State:
$10,761
(% of AGI for various income ranges: 2.8% for AGIs below $10k , 3.0% for AGIs $10k-25k , 4.7% for AGIs $25k-50k , 7.7% for AGIs $50k-75k , 9.9% for AGIs $75k-100k , 16.5% for AGIs over 100k ) Earned income credit: $2,108 (reported on 37.5% of returns )Percentage of individuals using paid preparers for their 2004 taxes: 72.8%(% for various income ranges: 68.1% for AGIs below $10k , 74.5% for AGIs $10k-25k , 72.8% for AGIs $25k-50k , 73.6% for AGIs $50k-75k , 74.8% for AGIs $75k-100k , 81.2% for AGIs over 100k )
Estimated median household income in 2022: This zip code:
$50,140California:
$91,551
Nearest zip codes: 93309 ,
93301 ,
93305 ,
93312 ,
93307 ,
93241 .
Bakersfield Zip Code Map
Percentage of family households: This zip code:
53.9%California:
46.8%
Percentage of households with unmarried partners: This zip code:
10.5%California:
48.1%
Likely homosexual households (counted as self-reported same-sex unmarried-partner households)
Lesbian couples: 0.0% of all households Gay men: 0.0% of all households
Household received Food Stamps/SNAP in the past 12 months: 5,732Household did not receive Food Stamps/SNAP in the past 12 months: 10,541
Women who had a birth in the past 12 months: 890 (414 now married , 480 unmarried) Women who did not have a birth in the past 12 months: 11,682 (3,757 now married , 7,961 unmarried)
Housing units in zip code 93304 with a mortgage: 4,390 (190
second mortgage , 16
home equity loan , 94
both second mortgage and home equity loan )
Houses without a mortgage: 42
Median monthly owner costs for units with a mortgage: $1,378
Median monthly owner costs for units without a mortgage: $517
Residents with income below the poverty level in 2022:
This zip code:
25.9%Whole state:
12.2%
Residents with income below 50% of the poverty level in 2022:
This zip code:
17.0%Whole state:
6.2%
Median number of rooms in houses and condos: Median number of rooms in apartments: Notable locations in this zip code not listed on our city pages
Click to draw/clear zip code borders Notable locations in zip code 93304: (A) , Kern County General Services Building (B) , Bakersfield Fire Department Station 6 (C) , Eleanor N Wilson Branch Kern County Library (D) . Display/hide their locations on the map
Shopping Centers: (1) , Valley Plaza Shopping Center (2) , The Village Center Shopping Center (3) , Brundage Square Shopping Center (4) , Benton Park Shopping Center (5) , White Lane Plaza Shopping Center (6) . Display/hide their locations on the map
Churches in zip code 93304 include: (A) , First Church of the Nazarene (B) , Plaza Christian Church (C) , Abundant Life Church (D) , Fellowship to Christ Church (E) , Reorganized Church of Jesus Christ of Latter Day Saints (F) , Vintage Christian Center (G) , Bakersfield Bible Church (H) , Bakersfield New Life Center (I) . Display/hide their locations on the map
Parks in zip code 93304 include: (1) , Lowell Park (2) , Planz Park (3) , Wayside Park (4) , Wilson Park (5) . Display/hide their locations on the map
Tourist attractions (not listed on the city page) :
Year house built (houses)
32 2020 or later214 2010 to 2019620 2000 to 2009883 1990 to 19991,935 1980 to 19892,705 1970 to 19792,446 1960 to 19693,852 1950 to 19591,519 1940 to 19491,737 1939 or earlier
Zip code 93304 household income distribution in 2022 977 Less than $10,0001,600 $10,000 to $14,999620 $15,000 to $19,999599 $20,000 to $24,999840 $25,000 to $29,999920 $30,000 to $34,999667 $35,000 to $39,999986 $40,000 to $44,999500 $45,000 to $49,9991,560 $50,000 to $59,9991,385 $60,000 to $74,9992,015 $75,000 to $99,9991,067 $100,000 to $124,999623 $125,000 to $149,999562 $150,000 to $199,999547 $200,000 or moreEstimate of home value of owner-occupied houses/condos in 2022 in zip code 93304 45 Less than $10,00022 $10,000 to $14,99912 $15,000 to $19,99924 $25,000 to $29,99926 $30,000 to $34,9992 $35,000 to $39,99947 $40,000 to $49,999107 $50,000 to $59,99915 $60,000 to $69,99977 $70,000 to $79,99942 $80,000 to $89,999161 $90,000 to $99,999156 $100,000 to $124,999309 $125,000 to $149,999596 $150,000 to $174,999701 $175,000 to $199,9991,285 $200,000 to $249,999719 $250,000 to $299,999401 $300,000 to $399,999107 $400,000 to $499,99993 $500,000 to $749,99983 $750,000 to $999,99934 $1,000,000 to $1,499,9995 $2,000,000 or moreRent paid by renters in 2022 in zip code 93304 31 Less than $10012 $150 to $199339 $200 to $24973 $250 to $29983 $300 to $34973 $350 to $39935 $400 to $44976 $450 to $499389 $500 to $549121 $550 to $599456 $600 to $649330 $650 to $699777 $700 to $749278 $750 to $7991,632 $800 to $8991,122 $900 to $9991,762 $1,000 to $1,249618 $1,250 to $1,499255 $1,500 to $1,99952 $2,000 to $2,49914 $3,000 to $3,499125 No cash rent
Median gross rent in 2022: $1,125.
Median price asked for vacant for-sale houses and condos in 2022: $187,898.
Estimated median house (or condo) value in 2022 for: White Non-Hispanic householders: $234,711Black or African American householders: $221,126American Indian or Alaska Native householders: $249,453Asian householders: $266,796Native Hawaiian and other Pacific Islander householders: $230,086Some other race householders: $224,883Two or more races householders: $226,907Hispanic or Latino householders: $222,571Estimated median house or condo value in 2022: $227,485
93304:
$227,485California:
$715,900
Lower value quartile - upper value quartile: $185,424 - $282,685
Mean price in 2022: Detached houses: $364,651Here:
$364,651State:
$988,808
Townhouses or other attached units: $167,726Here:
$167,726State:
$838,546
In 2-unit structures: $495,923Here:
$495,923State:
$1,138,100
In 3-to-4-unit structures: $135,470Here:
$135,470State:
$824,253
In 5-or-more-unit structures: $308,214Here:
$308,214State:
$730,996
Mobile homes: $43,087Here:
$43,087State:
$184,506
Housing units in structures:
One, detached: 11,154One, attached: 464Two: 5313 or 4: 1,1285 to 9: 56210 to 19: 53120 to 49: 38850 or more: 680Mobile homes: 887Unemployment : 8.8%
Means of transportation to work in zip code 93304 76.8% 14,828 Drove a car alone13.8% 2,658 Carpooled0.6% 107 Bus or trolley bus0.1% 27 Subway or elevated0.2% 35 Taxi0.2% 43 Motorcycle0.1% 21 Bicycle1.2% 224 Walked1.2% 236 Other means3.3% 633 Worked at homeTravel time to work (commute) in zip code 93304 250 Less than 5 minutes1,738 5 to 9 minutes2,765 10 to 14 minutes4,347 15 to 19 minutes3,616 20 to 24 minutes903 25 to 29 minutes2,773 30 to 34 minutes139 35 to 39 minutes303 40 to 44 minutes364 45 to 59 minutes382 60 to 89 minutes447 90 or more minutes
Percentage of zip code residents living and working in this county: 96.3%
Household type by relationship:
Households: 49,741
Male householders: 6,818 (1,811 living alone ), Female householders: 8,676 (1,954 living alone )5,544 spouses (5,515 opposite-sex spouses ), 2,106 unmarried partners , (2,059 opposite-sex unmarried partners ), 18,141 children (16,668 natural , 405 adopted , 1,056 stepchildren ), 1,807 grandchildren , 983 brothers or sisters , 1,290 parents , 19 foster children , 2,366 other relatives , 1,506 non-relatives In group quarters: 407 (-1 institutionalized population )
Size of family households: 3,124 2-persons , 2,222 3-persons , 2,123 4-persons , 1,665 5-persons , 940 6-persons , 686 7-or-more-persons
Size of nonfamily households: 3,763 1-person , 813 2-persons , 72 3-persons , 23 7-or-more-persons
5,505 married couples with children. single-parent households (2,104 men , 4,494 women ).
47.5% of residents of 93304 zip code speak English at home. of residents speak Spanish at home (63% very well, 16% well, 13% not well, 9% not at all ).of residents speak other Indo-European language at home (62% very well, 12% well, 27% not well ).of residents speak Asian or Pacific Island language at home (60% very well, 23% well, 16% not well, 1% not at all ).of residents speak other language at home (59% very well, 41% well ).
Foreign born population: 10,578 (21.3%)
(35.1%
of them are naturalized citizens )
This zip code:
21.3%Whole state:
26.7%
82% Honduras 4% Costa Rica 3% Malaysia 1% Burma (Myanmar) 1% El Salvador 1% Mexico 1% Uruguay 2% American 1% German 1% English 1% Irish 0% African 0% European 0% Belizean
Year of entry for the foreign-born population
1,699 2010 or later 2,501 2000 to 2009 2,108 1990 to 1999 4,639 Before 1990
There are
131 Medical Specialists in Zip Code 93304 .
Major facilities with environmental interests located in this zip code:
ENNIS PAINT (200 2ND ST in BAKERSFIELD, CA)
(Integrated Compliance Information System) - ICIS-09-2005-0274, ENFORCEMENT/COMPLIANCE ACTIVITY FORMAL ENFORCEMENT ACTION (Integrated Compliance Information System) - ICIS-09-2005-0274, ENFORCEMENT/COMPLIANCE ACTIVITY COMPLIANCE ACTIVITY (Tracking inspections of insecticide, fungicide, and rodenticide, and toxic substances) TRI REPORTER (Tracking of toxic chemicals releasing facilities)
IDEAL CLEANERS (3070 BRUNDAGE LN in BAKERSFIELD, CA)
STATE MASTER (California - Hazardous Waste Tracking) - HAZARDOU WASTE PROGRAM CRITERIA AND HAZARDOUS AIR POLLUTANT INVENTORY (Inventory of air pollution sources) Small Quantity Generators, between 100 kg and 1000 kg of hazardous waste/month (Resource Conservation and Recovery Act (tracking hazardous waste)) - notification Business SIC classification: DRYCLEANING PLANTS, EXCEPT RUG CLEANINGOrganizations: CLAYTON KENNEDY (CONTACT/OWNER)
NEW CITY CLEANERS (1021 8TH ST in BAKERSFIELD, CA)
STATE MASTER (California - Hazardous Waste Tracking) - HAZARDOU WASTE PROGRAM Small Quantity Generators, between 100 kg and 1000 kg of hazardous waste/month (Resource Conservation and Recovery Act (tracking hazardous waste))
CHEVRON STATION NO 98109 (1131 OAK ST in BAKERSFIELD, CA)
STATE MASTER (California - Hazardous Waste Tracking) - HAZARDOU WASTE PROGRAM Small Quantity Generators, between 100 kg and 1000 kg of hazardous waste/month (Resource Conservation and Recovery Act (tracking hazardous waste)) - notification Organizations: CHEVRON PRODUCTS CO (CONTACT/OWNER)
EVERGREEN ELEMENTARY (2600 ROSE MARIE DR. in BAKERSFIELD, CA)
(National Center for Education Statistics) - STATE ID-6008874 Organizations: BAKERSFIELD CITY ELEMENTARY (SCHOOL DISTRICT)
EMERSON MIDDLE (801 FOURTH ST. in BAKERSFIELD, CA)
(National Center for Education Statistics) - STATE ID-6008916 Organizations: BAKERSFIELD CITY ELEMENTARY (SCHOOL DISTRICT)
KENDRICK (W.A.) ELEMENTARY (2200 FAITH AVE. in BAKERSFIELD, CA)
(National Center for Education Statistics) - STATE ID-6108468 Organizations: GREENFIELD UNION ELEMENTARY (SCHOOL DISTRICT)
JOHNSON (RAFER) CENTER (1001 TENTH ST. in BAKERSFIELD, CA)
(National Center for Education Statistics) - STATE ID-6009112 Organizations: BAKERSFIELD CITY ELEMENTARY (SCHOOL DISTRICT)
FRANK WEST ELEMENTARY (2400 BENTON ST. in BAKERSFIELD, CA)
(National Center for Education Statistics) - STATE ID-6008924 Organizations: BAKERSFIELD CITY ELEMENTARY (SCHOOL DISTRICT)
MCKINLEY ELEMENTARY (601 FOURTH ST. in BAKERSFIELD, CA)
(National Center for Education Statistics) - STATE ID-6009070 Organizations: BAKERSFIELD CITY ELEMENTARY (SCHOOL DISTRICT)
NEIRAS BODY WORKS (1001 CALIFORNIA AVE in BAKERSFIELD, CA)
(Resource Conservation and Recovery Act (tracking hazardous waste)) Organizations: NEIRA SAM (CONTACT/OWNER)
LUBE & BRAKE SHOP THE (612 WIBLE RD in BAKERSFIELD, CA)
Small Quantity Generators, between 100 kg and 1000 kg of hazardous waste/month (Resource Conservation and Recovery Act (tracking hazardous waste)) - notification Business NAICS classification: OTHER AUTOMOTIVE MECHANICAL AND ELECTRICAL REPAIR AND MAINTENANCE.Organizations: HARRY HACKNEY (CONTACT/OWNER)
LINER PEST CONTROL INC (1018 BRUDAGE LANE in BAKERSFIELD, CA)
Small Quantity Generators, between 100 kg and 1000 kg of hazardous waste/month (Resource Conservation and Recovery Act (tracking hazardous waste)) - notification Organizations: RAYMOND K LINER (CONTACT/OWNER)
Housing units lacking complete plumbing facilities: 0.5%
Housing units lacking complete kitchen facilities: 2.6%
57.6% Utility gas 35.4% Electricity 3.4% No fuel used 1.8% Solar energy 1.0% Bottled, tank, or LP gas 0.8% Wood
Population in 1990: 41,870. Population change in the 1990s: +2,707 (+6.5%).
Place of birth for U.S.-born residents:
This state: 34,486Northeast: 427Midwest: 1,135South: 1,772West: 905
50% of the 93304 zip code residents lived in the same house 5 years ago.
Out of people who lived in different houses, 79% lived in this county.
Out of people who lived in different counties, 50% lived in California.
92% of the 93304 zip code residents lived in the same house 1 year ago.
Out of people who lived in different houses, 75% moved from this county.
Out of people who lived in different houses, 16% moved from different county within same state.
Out of people who lived in different houses, 4% moved from different state.
Out of people who lived in different houses, 5% moved from abroad.
Private vs. public school enrollment:
Students in private schools in grades 1 to 8 (elementary and middle school): 219
Here:
3.5%California:
10.5%
Students in private schools in grades 9 to 12 (high school): 120
Students in private undergraduate colleges: 449
Here:
21.6%California:
15.9%
Occupation by median earnings in the past 12 months ($)
79,756 Health diagnosing and treating practitioners and other technical occupations 70,617 Life, physical, and social science occupations 58,999 Law enforcement workers including supervisors 52,706 Business and financial operations occupations 50,499 Management occupations 49,967 Community and social service occupations
Companies with federal contracts located in this zip code:
ELECTRONIC SERVICES (3035 WILSON RD in BAKERSFIELD, CA; small business)
$10,928 with Air Force for Phonographs, Radio and Television Sets: Home Type. Signed on 2005-09-27. Completion date: 2005-10-21.
Top industries in this zip code by the number of employees in 2005:
Accommodation and Food Services: Limited-Service Restaurants (50-99 employees: 2 establishments, 20-49 employees: 13 establishments, 10-19 employees: 8 establishments, 5-9 employees: 2 establishments, 1-4 employees: 9 establishments)Accommodation and Food Services: Full-Service Restaurants (50-99: 2, 20-49: 5, 10-19: 7, 5-9: 8, 1-4: 6)Accommodation and Food Services: Snack and Nonalcoholic Beverage Bars (50-99: 1, 20-49: 1, 10-19: 3, 5-9: 4)Health Care and Social Assistance: Nursing Care Facilities (100-249: 1)
People in group quarters in 2010:
174 people in nursing facilities/skilled-nursing facilities
130 people in group homes intended for adults
32 people in other noninstitutional facilities
30 people in local jails and other municipal confinement facilities
26 people in emergency and transitional shelters (with sleeping facilities) for people experiencing homelessness
23 people in group homes for juveniles (non-correctional)
12 people in residential treatment centers for juveniles (non-correctional)
6 people in correctional residential facilities
6 people in workers' group living quarters and job corps centers
People in group quarters in 2000:
98 people in hospitals/wards and hospices for chronically ill
98 people in other hospitals or wards for chronically ill
83 people in nursing homes
70 people in halfway houses
68 people in other noninstitutional group quarters
38 people in homes or halfway houses for drug/alcohol abuse
28 people in homes for the mentally retarded
25 people in other group homes
21 people in other nonhousehold living situations
9 people in religious group quarters
8 people in homes for the physically handicapped
5 people in homes for the mentally ill
Fatal accident statistics in 2014:
Fatal accident count: 7Vehicles involved in fatal accidents: 13Fatal accidents caused by drunken drivers: 2Fatalities: 7Persons involved in fatal accidents: 13Pedestrians involved in fatal accidents: 2
Fatal accident statistics in 2013:
Fatal accident count: 11Vehicles involved in fatal accidents: 14Fatal accidents caused by drunken drivers: 3Fatalities: 11Persons involved in fatal accidents: 20Pedestrians involved in fatal accidents: 7
Home Mortgage Disclosure Act Aggregated Statistics For Year 2009(Based on 14 full and 6 partial tracts) A) FHA, FSA/RHS & VA B) Conventional C) Refinancings D) Home Improvement Loans E) Loans on Dwellings For 5+ Families F) Non-occupant Loans on G) Loans On Manufactured Number Average Value Number Average Value Number Average Value Number Average Value Number Average Value Number Average Value Number Average Value
LOANS ORIGINATED 463 $93,289 230 $70,068 191 $116,844 25 $44,391 4 $194,610 182 $68,264 0 $0 APPLICATIONS APPROVED, NOT ACCEPTED 53 $98,233 31 $73,107 29 $111,505 4 $45,932 0 $0 28 $85,678 2 $39,375 APPLICATIONS DENIED 91 $106,438 85 $76,978 284 $125,853 40 $44,876 0 $0 79 $76,500 10 $93,488 APPLICATIONS WITHDRAWN 117 $102,693 55 $79,525 123 $130,133 16 $50,185 0 $0 57 $83,411 0 $0 FILES CLOSED FOR INCOMPLETENESS 12 $104,975 12 $102,487 36 $122,086 4 $162,945 0 $0 14 $122,126 0 $0
Aggregated Statistics For Year 2008(Based on 14 full and 6 partial tracts) A) FHA, FSA/RHS & VA B) Conventional C) Refinancings D) Home Improvement Loans E) Loans on Dwellings For 5+ Families F) Non-occupant Loans on G) Loans On Manufactured Number Average Value Number Average Value Number Average Value Number Average Value Number Average Value Number Average Value Number Average Value
LOANS ORIGINATED 336 $124,927 300 $104,776 490 $127,785 69 $54,623 13 $626,021 254 $109,672 3 $61,950 APPLICATIONS APPROVED, NOT ACCEPTED 21 $136,440 58 $142,828 150 $148,060 22 $78,837 2 $544,500 55 $142,734 8 $68,459 APPLICATIONS DENIED 66 $129,733 152 $142,840 873 $170,858 126 $59,214 2 $138,195 236 $158,427 6 $64,710 APPLICATIONS WITHDRAWN 66 $135,914 60 $180,719 189 $158,306 31 $135,541 2 $162,375 61 $153,310 1 $96,730 FILES CLOSED FOR INCOMPLETENESS 8 $115,089 26 $166,287 68 $165,243 8 $50,938 1 $637,100 27 $140,648 0 $0
Aggregated Statistics For Year 2007(Based on 14 full and 6 partial tracts) A) FHA, FSA/RHS & VA B) Conventional C) Refinancings D) Home Improvement Loans E) Loans on Dwellings For 5+ Families F) Non-occupant Loans on G) Loans On Manufactured Number Average Value Number Average Value Number Average Value Number Average Value Number Average Value Number Average Value Number Average Value
LOANS ORIGINATED 46 $197,352 653 $148,328 2,138 $164,446 366 $104,071 11 $798,179 610 $170,194 13 $89,602 APPLICATIONS APPROVED, NOT ACCEPTED 1 $182,920 174 $165,051 596 $169,574 50 $89,203 0 $0 129 $182,334 9 $51,822 APPLICATIONS DENIED 25 $187,090 555 $154,807 2,074 $192,246 270 $104,786 4 $235,138 459 $187,885 31 $62,575 APPLICATIONS WITHDRAWN 12 $175,300 213 $136,232 930 $180,866 94 $143,091 6 $297,013 206 $178,131 8 $40,272 FILES CLOSED FOR INCOMPLETENESS 0 $0 51 $184,804 295 $195,319 18 $128,585 0 $0 53 $196,015 3 $71,650
Aggregated Statistics For Year 2006(Based on 14 full and 6 partial tracts) A) FHA, FSA/RHS & VA B) Conventional C) Refinancings D) Home Improvement Loans E) Loans on Dwellings For 5+ Families F) Non-occupant Loans on G) Loans On Manufactured Number Average Value Number Average Value Number Average Value Number Average Value Number Average Value Number Average Value Number Average Value
LOANS ORIGINATED 47 $190,426 2,129 $136,210 3,386 $165,097 460 $114,828 21 $1,187,943 890 $165,687 22 $78,213 APPLICATIONS APPROVED, NOT ACCEPTED 5 $180,938 515 $135,031 731 $175,412 90 $107,910 0 $0 221 $162,412 20 $63,120 APPLICATIONS DENIED 7 $214,499 1,043 $142,563 2,322 $178,048 461 $110,034 7 $408,571 453 $172,477 27 $80,062 APPLICATIONS WITHDRAWN 7 $176,000 554 $141,727 1,887 $174,641 170 $131,349 2 $289,100 228 $167,743 5 $66,950 FILES CLOSED FOR INCOMPLETENESS 0 $0 124 $148,828 351 $176,556 29 $94,951 3 $685,070 60 $202,965 0 $0
Aggregated Statistics For Year 2005(Based on 14 full and 6 partial tracts) A) FHA, FSA/RHS & VA B) Conventional C) Refinancings D) Home Improvement Loans E) Loans on Dwellings For 5+ Families F) Non-occupant Loans on G) Loans On Manufactured Number Average Value Number Average Value Number Average Value Number Average Value Number Average Value Number Average Value Number Average Value
LOANS ORIGINATED 22 $141,720 3,151 $135,190 4,347 $142,171 440 $116,171 23 $903,241 1,346 $161,713 32 $62,724 APPLICATIONS APPROVED, NOT ACCEPTED 2 $76,760 518 $129,199 676 $136,818 64 $95,404 0 $0 211 $138,609 17 $78,283 APPLICATIONS DENIED 11 $134,837 1,144 $139,355 2,133 $139,108 362 $87,992 2 $294,085 445 $156,948 49 $76,127 APPLICATIONS WITHDRAWN 16 $126,748 811 $145,146 2,060 $140,916 244 $130,862 7 $794,194 327 $153,949 4 $42,668 FILES CLOSED FOR INCOMPLETENESS 0 $0 95 $131,937 357 $129,371 23 $80,389 0 $0 58 $130,614 0 $0
Aggregated Statistics For Year 2004(Based on 14 full and 6 partial tracts) A) FHA, FSA/RHS & VA B) Conventional C) Refinancings D) Home Improvement Loans E) Loans on Dwellings For 5+ Families F) Non-occupant Loans on G) Loans On Manufactured Number Average Value Number Average Value Number Average Value Number Average Value Number Average Value Number Average Value Number Average Value
LOANS ORIGINATED 221 $116,430 2,315 $103,134 3,199 $105,402 316 $76,404 43 $683,420 1,076 $108,121 15 $52,925 APPLICATIONS APPROVED, NOT ACCEPTED 33 $113,042 414 $113,876 740 $103,534 65 $62,534 0 $0 163 $108,664 10 $51,138 APPLICATIONS DENIED 30 $114,939 794 $100,002 2,487 $102,622 414 $65,508 7 $578,971 329 $99,436 30 $68,584 APPLICATIONS WITHDRAWN 33 $118,548 428 $106,296 1,674 $102,583 144 $76,010 11 $373,003 205 $108,721 5 $104,664 FILES CLOSED FOR INCOMPLETENESS 6 $105,672 79 $98,966 287 $105,491 17 $46,024 0 $0 55 $99,011 0 $0
Aggregated Statistics For Year 2003(Based on 14 full and 6 partial tracts) A) FHA, FSA/RHS & VA B) Conventional C) Refinancings D) Home Improvement Loans E) Loans on Dwellings For 5+ Families F) Non-occupant Loans on Number Average Value Number Average Value Number Average Value Number Average Value Number Average Value Number Average Value
LOANS ORIGINATED 551 $94,660 1,380 $84,381 3,071 $82,613 77 $31,374 55 $588,215 819 $81,656 APPLICATIONS APPROVED, NOT ACCEPTED 56 $97,846 219 $85,194 513 $82,483 20 $35,183 0 $0 147 $84,921 APPLICATIONS DENIED 87 $92,099 407 $81,720 2,177 $84,484 140 $21,744 4 $498,200 253 $76,353 APPLICATIONS WITHDRAWN 65 $83,242 194 $79,458 1,276 $86,411 14 $28,172 2 $2,855,680 137 $82,137 FILES CLOSED FOR INCOMPLETENESS 18 $82,596 57 $93,675 195 $80,793 3 $17,297 0 $0 32 $81,143
Aggregated Statistics For Year 2002(Based on 14 full and 6 partial tracts) A) FHA, FSA/RHS & VA B) Conventional C) Refinancings D) Home Improvement Loans E) Loans on Dwellings For 5+ Families F) Non-occupant Loans on Number Average Value Number Average Value Number Average Value Number Average Value Number Average Value Number Average Value
LOANS ORIGINATED 871 $77,094 821 $64,931 1,478 $75,853 81 $24,929 18 $567,047 401 $71,790 APPLICATIONS APPROVED, NOT ACCEPTED 56 $86,717 95 $58,955 257 $75,938 15 $15,029 0 $0 38 $70,623 APPLICATIONS DENIED 113 $80,403 218 $62,644 1,444 $75,479 179 $21,474 9 $781,054 125 $61,237 APPLICATIONS WITHDRAWN 125 $76,285 147 $77,380 639 $77,417 25 $13,789 3 $790,027 81 $70,922 FILES CLOSED FOR INCOMPLETENESS 10 $69,106 37 $90,632 139 $70,486 2 $59,975 0 $0 22 $78,908
Aggregated Statistics For Year 2001(Based on 14 full and 6 partial tracts) A) FHA, FSA/RHS & VA B) Conventional C) Refinancings D) Home Improvement Loans E) Loans on Dwellings For 5+ Families F) Non-occupant Loans on Number Average Value Number Average Value Number Average Value Number Average Value Number Average Value Number Average Value
LOANS ORIGINATED 971 $73,482 659 $42,464 1,025 $69,395 112 $19,407 15 $184,231 284 $62,772 APPLICATIONS APPROVED, NOT ACCEPTED 43 $84,508 62 $48,670 174 $65,677 13 $12,969 2 $336,600 21 $48,077 APPLICATIONS DENIED 73 $79,045 146 $60,280 1,035 $62,312 256 $14,013 0 $0 101 $52,033 APPLICATIONS WITHDRAWN 110 $73,669 112 $54,559 585 $71,218 47 $27,524 0 $0 52 $76,133 FILES CLOSED FOR INCOMPLETENESS 16 $85,702 25 $28,851 319 $84,106 28 $27,703 0 $0 18 $67,977
Aggregated Statistics For Year 2000(Based on 14 full and 6 partial tracts) A) FHA, FSA/RHS & VA B) Conventional C) Refinancings D) Home Improvement Loans E) Loans on Dwellings For 5+ Families F) Non-occupant Loans on Number Average Value Number Average Value Number Average Value Number Average Value Number Average Value Number Average Value
LOANS ORIGINATED 1,003 $74,044 603 $42,251 392 $55,625 81 $23,150 10 $379,235 153 $50,794 APPLICATIONS APPROVED, NOT ACCEPTED 21 $80,018 50 $45,972 99 $53,985 64 $23,504 0 $0 23 $39,857 APPLICATIONS DENIED 79 $74,948 172 $56,476 840 $51,366 217 $21,801 6 $1,334,343 102 $49,996 APPLICATIONS WITHDRAWN 97 $72,998 116 $43,718 437 $51,517 30 $18,185 0 $0 52 $50,534 FILES CLOSED FOR INCOMPLETENESS 18 $87,578 17 $67,959 71 $56,108 3 $34,097 2 $1,794,420 10 $55,412
Aggregated Statistics For Year 1999(Based on 5 full and 5 partial tracts) A) FHA, FSA/RHS & VA B) Conventional C) Refinancings D) Home Improvement Loans E) Loans on Dwellings For 5+ Families F) Non-occupant Loans on Number Average Value Number Average Value Number Average Value Number Average Value Number Average Value Number Average Value
LOANS ORIGINATED 406 $72,147 165 $42,567 404 $61,762 51 $24,980 9 $253,554 114 $49,014 APPLICATIONS APPROVED, NOT ACCEPTED 17 $64,446 15 $62,556 89 $58,437 35 $26,509 1 $105,680 19 $44,082 APPLICATIONS DENIED 28 $69,236 49 $60,367 467 $56,121 103 $21,593 2 $203,690 49 $55,526 APPLICATIONS WITHDRAWN 30 $68,715 48 $54,151 301 $62,157 19 $18,957 1 $73,130 46 $62,635 FILES CLOSED FOR INCOMPLETENESS 7 $69,896 9 $62,460 76 $62,936 2 $15,205 1 $78,720 10 $58,007
Private Mortgage Insurance Companies Aggregated Statistics For Year 2009(Based on 12 full and 6 partial tracts) A) Conventional B) Refinancings Number Average Value Number Average Value
LOANS ORIGINATED 23 $87,709 1 $186,360 APPLICATIONS APPROVED, NOT ACCEPTED 5 $99,700 0 $0 APPLICATIONS DENIED 14 $84,353 0 $0 APPLICATIONS WITHDRAWN 0 $0 0 $0 FILES CLOSED FOR INCOMPLETENESS 4 $127,808 0 $0
Aggregated Statistics For Year 2008(Based on 14 full and 6 partial tracts) A) Conventional B) Refinancings C) Non-occupant Loans on Number Average Value Number Average Value Number Average Value
LOANS ORIGINATED 115 $146,952 36 $198,599 31 $153,311 APPLICATIONS APPROVED, NOT ACCEPTED 64 $191,277 52 $213,223 17 $180,458 APPLICATIONS DENIED 33 $121,220 14 $212,139 25 $147,763 APPLICATIONS WITHDRAWN 2 $149,445 10 $237,248 2 $156,950 FILES CLOSED FOR INCOMPLETENESS 5 $130,210 2 $156,950 2 $156,950
Aggregated Statistics For Year 2007(Based on 14 full and 6 partial tracts) A) Conventional B) Refinancings C) Non-occupant Loans on Number Average Value Number Average Value Number Average Value
LOANS ORIGINATED 177 $202,638 137 $224,013 38 $174,057 APPLICATIONS APPROVED, NOT ACCEPTED 39 $198,263 43 $222,906 10 $187,628 APPLICATIONS DENIED 9 $207,028 15 $226,024 6 $180,577 APPLICATIONS WITHDRAWN 4 $195,762 4 $233,998 3 $198,133 FILES CLOSED FOR INCOMPLETENESS 2 $194,920 2 $223,390 0 $0
Aggregated Statistics For Year 2006(Based on 14 full and 6 partial tracts) A) Conventional B) Refinancings C) Non-occupant Loans on D) Loans On Manufactured Number Average Value Number Average Value Number Average Value Number Average Value
LOANS ORIGINATED 63 $209,092 64 $223,484 16 $192,076 1 $87,060 APPLICATIONS APPROVED, NOT ACCEPTED 14 $164,061 24 $220,565 9 $202,249 0 $0 APPLICATIONS DENIED 2 $254,880 1 $213,690 1 $213,690 0 $0 APPLICATIONS WITHDRAWN 5 $227,772 7 $244,101 0 $0 0 $0 FILES CLOSED FOR INCOMPLETENESS 2 $88,110 0 $0 0 $0 0 $0
Aggregated Statistics For Year 2005(Based on 14 full and 6 partial tracts) A) Conventional B) Refinancings C) Non-occupant Loans on Number Average Value Number Average Value Number Average Value
LOANS ORIGINATED 127 $181,369 88 $194,058 38 $166,214 APPLICATIONS APPROVED, NOT ACCEPTED 29 $150,050 13 $125,968 5 $111,900 APPLICATIONS DENIED 8 $174,579 16 $273,374 10 $288,268 APPLICATIONS WITHDRAWN 12 $147,555 10 $169,238 7 $138,519 FILES CLOSED FOR INCOMPLETENESS 3 $164,493 0 $0 1 $134,600
Aggregated Statistics For Year 2004(Based on 14 full and 6 partial tracts) A) Conventional B) Refinancings C) Non-occupant Loans on D) Loans On Manufactured Number Average Value Number Average Value Number Average Value Number Average Value
LOANS ORIGINATED 389 $127,245 130 $118,690 126 $113,544 1 $45,730 APPLICATIONS APPROVED, NOT ACCEPTED 108 $149,774 31 $103,572 23 $105,654 0 $0 APPLICATIONS DENIED 16 $143,265 0 $0 8 $138,068 0 $0 APPLICATIONS WITHDRAWN 87 $197,767 9 $98,397 8 $159,664 0 $0 FILES CLOSED FOR INCOMPLETENESS 2 $129,310 5 $100,364 0 $0 0 $0
Aggregated Statistics For Year 2003(Based on 14 full and 6 partial tracts) A) Conventional B) Refinancings C) Non-occupant Loans on Number Average Value Number Average Value Number Average Value
LOANS ORIGINATED 434 $100,448 270 $91,816 136 $90,593 APPLICATIONS APPROVED, NOT ACCEPTED 76 $121,316 66 $84,273 22 $94,406 APPLICATIONS DENIED 27 $98,719 4 $95,708 23 $89,622 APPLICATIONS WITHDRAWN 40 $129,769 8 $114,715 5 $74,476 FILES CLOSED FOR INCOMPLETENESS 7 $90,506 2 $104,610 2 $91,965
Aggregated Statistics For Year 2002(Based on 14 full and 6 partial tracts) A) Conventional B) Refinancings C) Non-occupant Loans on Number Average Value Number Average Value Number Average Value
LOANS ORIGINATED 357 $98,839 196 $90,781 108 $83,817 APPLICATIONS APPROVED, NOT ACCEPTED 65 $124,466 41 $92,350 7 $95,950 APPLICATIONS DENIED 3 $80,870 6 $86,888 2 $76,005 APPLICATIONS WITHDRAWN 15 $82,344 6 $79,575 3 $80,057 FILES CLOSED FOR INCOMPLETENESS 17 $163,010 0 $0 3 $115,710
Aggregated Statistics For Year 2001(Based on 14 full and 6 partial tracts) A) Conventional B) Refinancings C) Non-occupant Loans on Number Average Value Number Average Value Number Average Value
LOANS ORIGINATED 167 $77,790 120 $87,332 68 $67,479 APPLICATIONS APPROVED, NOT ACCEPTED 16 $91,009 17 $89,147 1 $91,740 APPLICATIONS DENIED 5 $144,928 6 $102,342 3 $60,443 APPLICATIONS WITHDRAWN 4 $76,472 2 $38,610 2 $58,240 FILES CLOSED FOR INCOMPLETENESS 4 $81,435 0 $0 0 $0
Aggregated Statistics For Year 2000(Based on 14 full and 6 partial tracts) A) Conventional B) Refinancings C) Non-occupant Loans on Number Average Value Number Average Value Number Average Value
LOANS ORIGINATED 121 $73,028 42 $71,384 29 $53,541 APPLICATIONS APPROVED, NOT ACCEPTED 17 $74,191 3 $81,893 1 $43,970 APPLICATIONS DENIED 7 $67,203 6 $65,837 4 $67,118 APPLICATIONS WITHDRAWN 1 $56,280 0 $0 0 $0 FILES CLOSED FOR INCOMPLETENESS 0 $0 0 $0 0 $0
Aggregated Statistics For Year 1999(Based on 5 full and 5 partial tracts) A) Conventional B) Refinancings C) Non-occupant Loans on Number Average Value Number Average Value Number Average Value
LOANS ORIGINATED 36 $70,950 38 $75,359 6 $63,642 APPLICATIONS APPROVED, NOT ACCEPTED 4 $96,940 3 $90,003 1 $48,910 APPLICATIONS DENIED 3 $45,600 4 $93,605 2 $32,000 APPLICATIONS WITHDRAWN 2 $127,860 1 $65,000 0 $0 FILES CLOSED FOR INCOMPLETENESS 1 $135,330 0 $0 0 $0
2005 - 2018 National Fire Incident Reporting System (NFIRS) incidents See full 2006 National Fire Incident Reporting System statistics for zip code 93304, California
Most common first names in zip code 93304 among deceased individuals Name Count Lived (average)
John 209 74.8 years James 208 72.0 years William 173 74.2 years Mary 168 78.0 years Robert 151 70.2 years George 112 73.6 years Charles 111 72.0 years Frank 87 74.3 years Margaret 86 78.8 years Ruth 73 78.5 years
Most common last names in zip code 93304 among deceased individuals Last name Count Lived (average)
Smith 134 75.0 years Williams 92 74.1 years Brown 75 72.0 years Jones 73 75.5 years Johnson 69 75.2 years Davis 58 75.5 years Miller 48 74.9 years Moore 41 75.0 years Thomas 39 70.7 years Wilson 36 73.0 years
Businesses in zip code 93304
Name Count Name Count
7-Eleven 2 Jack In The Box 2 AT&T 2 Jamba Juice 1 Abercrombie & Fitch 1 Jones New York 1 Ace Hardware 1 Journeys 1 Aeropostale 1 Justice 1 Albertsons 1 KFC 1 American Eagle Outfitters 1 Knights Inn 1 AutoZone 2 Kroger 2 Bakers 1 Lane Bryant 1 Banana Republic 1 Lane Furniture 1 Baskin-Robbins 1 LensCrafters 1 Bath & Body Works 1 Little Caesars Pizza 1 Bebe 1 Macy's 1 Big O Tires 1 McDonald's 2 Blockbuster 1 Men's Wearhouse 1 Burger King 2 Motel 6 1 Cache 1 Motherhood Maternity 2 Carl\s Jr. 2 New Balance 1 Catherines 1 Nike 13 Charlotte Russe 1 Old Navy 1 Church's Chicken 1 Pac Sun 1 Cinnabon 1 Panda Express 2 ColorTyme 1 Payless 3 Dairy Queen 1 RadioShack 1 Dennys 1 Ramada 1 Domino's Pizza 2 Red Robin 1 Econo Lodge 1 Rite Aid 1 El Pollo Loco 1 SAS Shoes 1 Express 1 SONIC Drive-In 1 Extended Stay America 1 Sears 2 FedEx 2 Sephora 1 Finish Line 1 Spencer Gifts 1 Foot Locker 1 Sprint Nextel 1 Forever 21 1 Starbucks 2 Fredericks Of Hollywood 1 Subway 4 GNC 2 T-Mobile 2 GameStop 2 Taco Bell 2 Gap 1 Target 1 Gymboree 1 Torrid 1 H&R Block 4 Travelodge 1 Hilton 1 U-Haul 1 Holiday Inn 1 UPS 1 Hollister Co. 1 Vans 5 HomeTown Buffet 1 Verizon Wireless 8 Hot Topic 1 Victoria's Secret 1 Howard Johnson 1 Walgreens 1 JCPenney 1

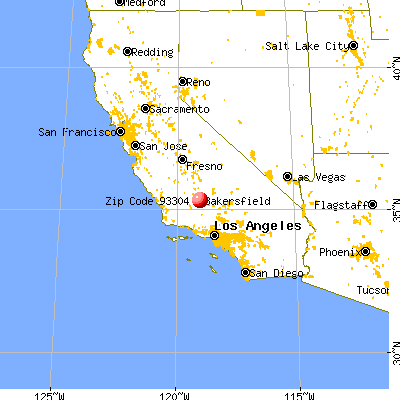


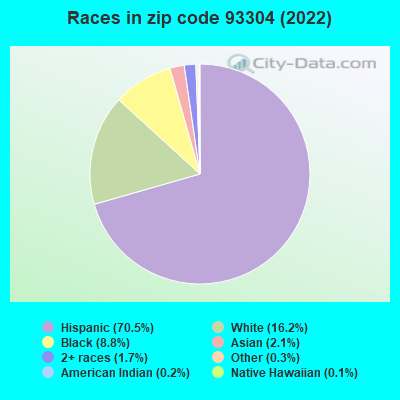


+$27,769
-$7,562
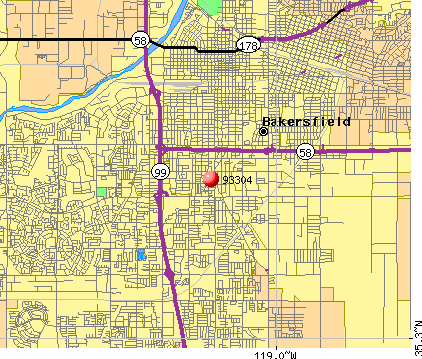 Nearest zip codes: 93309, 93301, 93305, 93312, 93307, 93241.

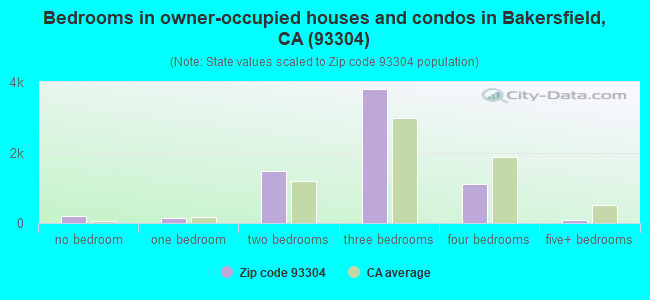
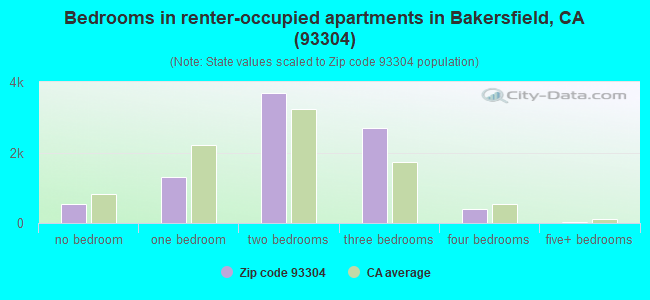
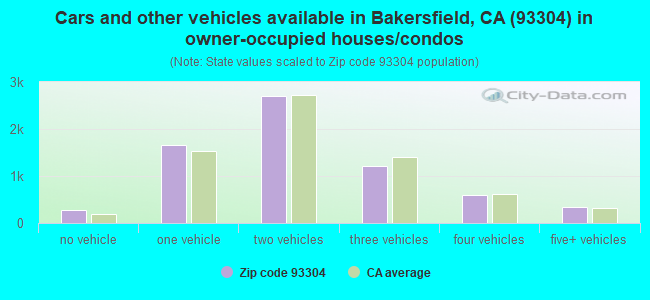
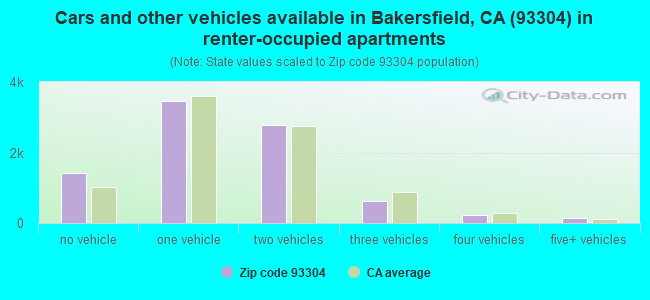


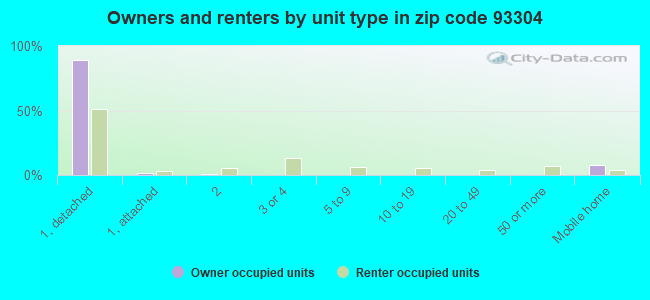
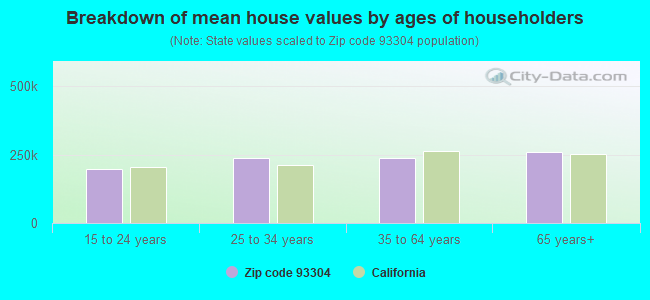


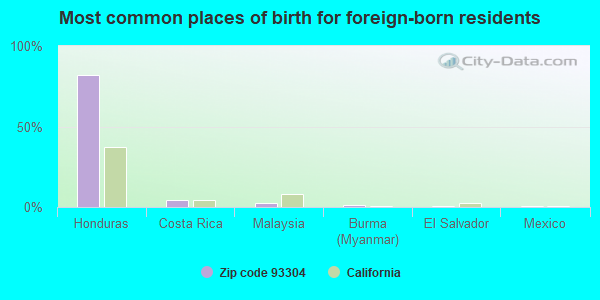
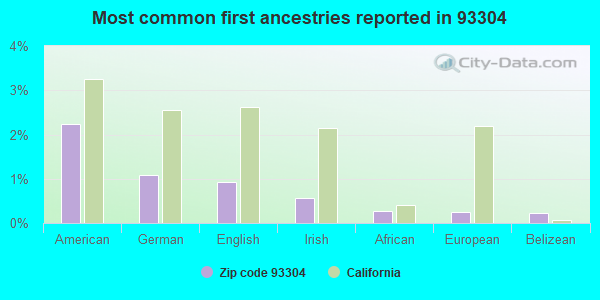
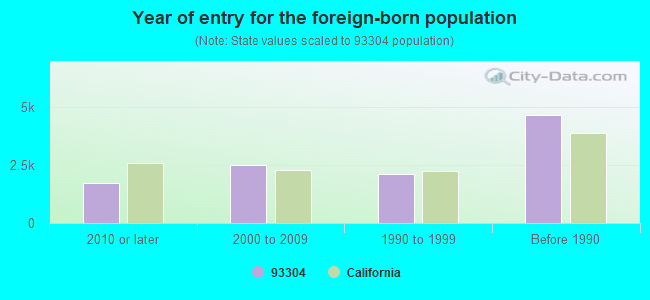

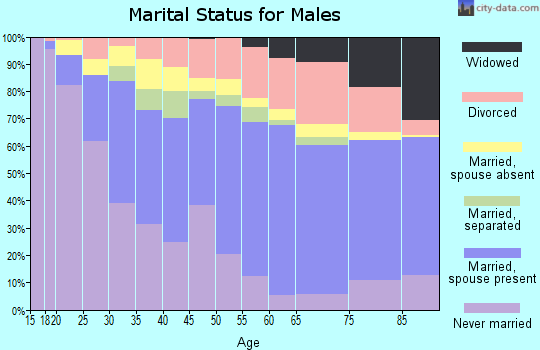
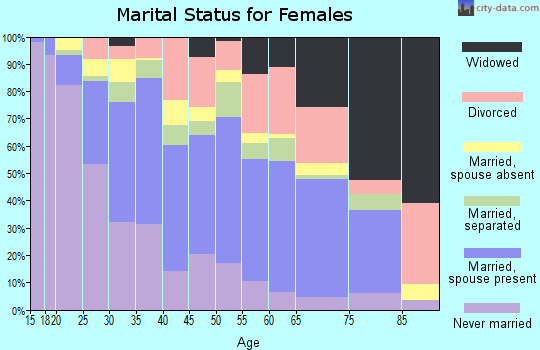
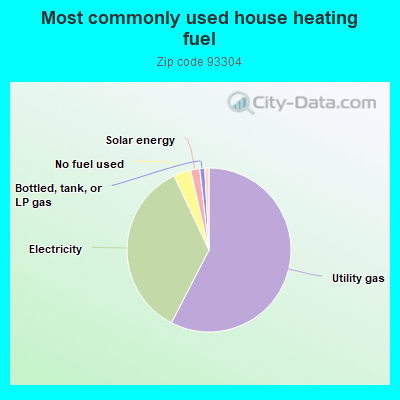
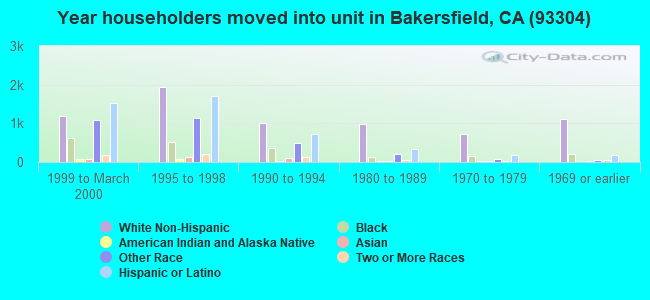
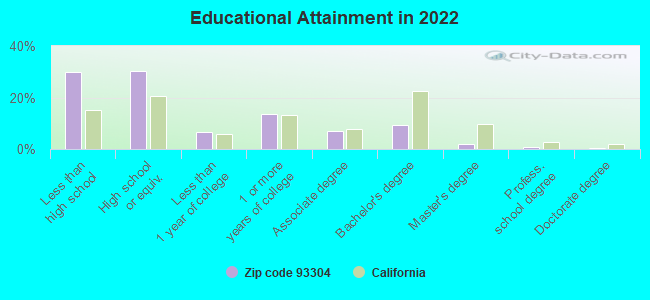
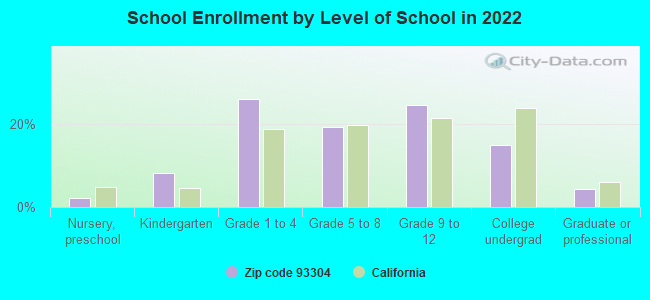
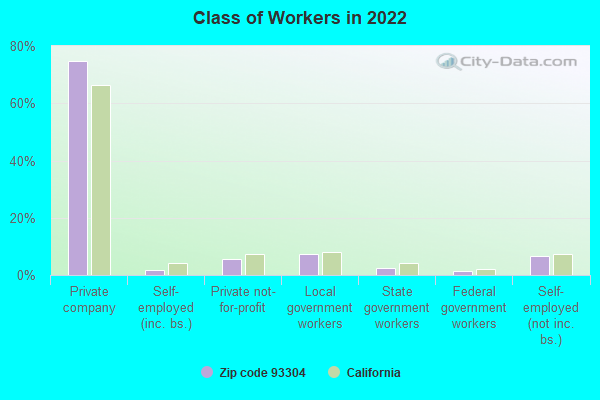
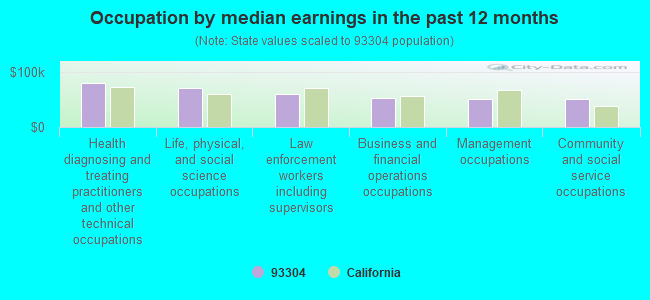
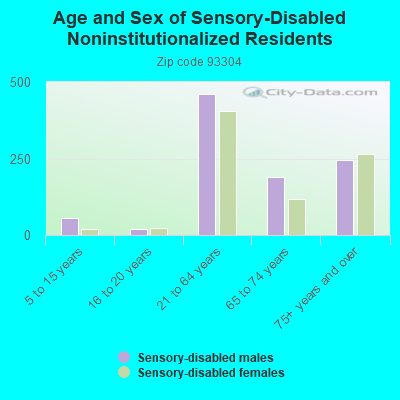

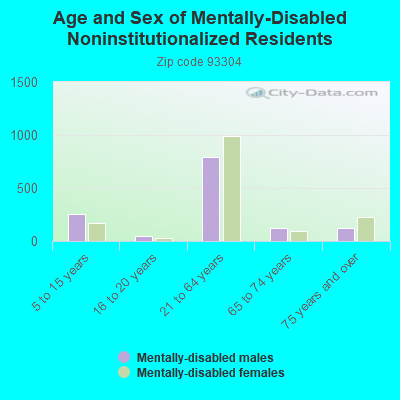

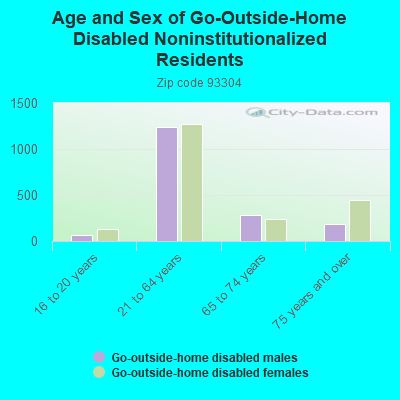
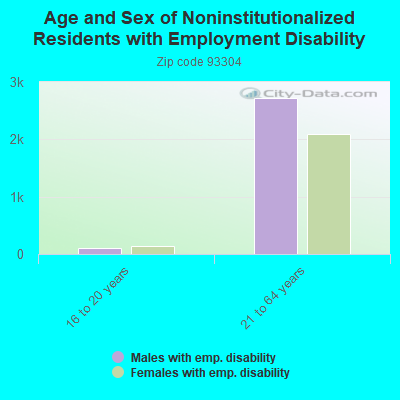
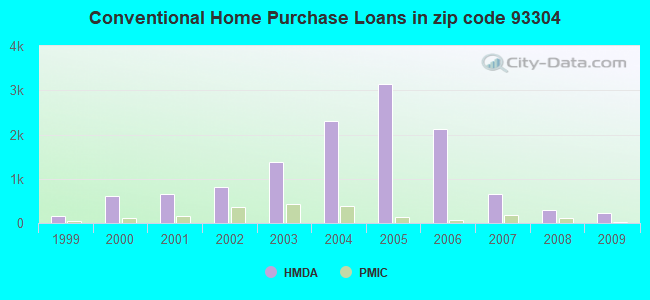
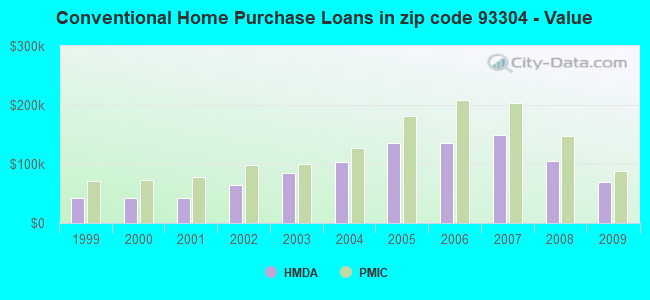
 Based on the data from the years 2005 - 2018 the average number of fires per year is 77. The highest number of fires - 451 took place in 2018, and the least - 0 in 2008. The data has an increasing trend.
 When looking into fire subcategories, the most incidents belonged to: Outside Fires (42.5%), and Structure Fires (42.0%).