Estimated zip code population in 2022: 62,306 Zip code population in 2010: 58,409 Zip code population in 2000: 58,612
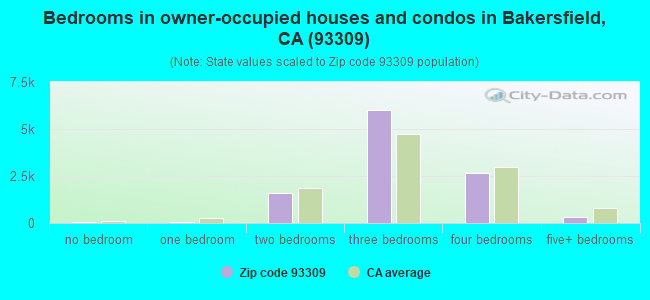
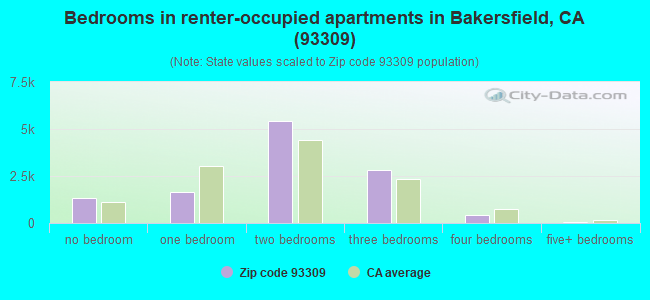
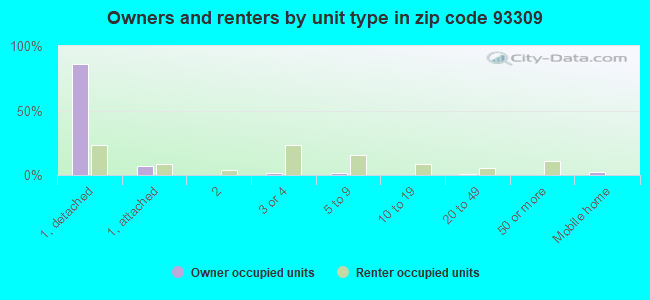
Houses and condos: 23,699 Renter-occupied apartments: 11,743
% of renters here:
52%
State:
44%
March 2022 cost of living index in zip code 93309: 91.9 (less than average, U.S. average is 100)
Land area: 10.7 sq. mi. Water area: 0.3 sq. mi.
Population density: 5,849 people per square mile
(average).
OSM Map
General Map
Google Map
MSN Map
OSM Map
General Map
Google Map
MSN Map
OSM Map
General Map
Google Map
MSN Map
OSM Map
General Map
Google Map
MSN Map
Please wait while loading the map...
Real estate property taxes paid for housing units in 2022:
This zip code:
0.9% ($2,657)
California:
0.7% ($4,831)
Median real estate property taxes paid for housing units with mortgages in 2022: $2,657 (0.9%) Median real estate property taxes paid for housing units with no mortgage in 2022: $2,753 (0.9%)
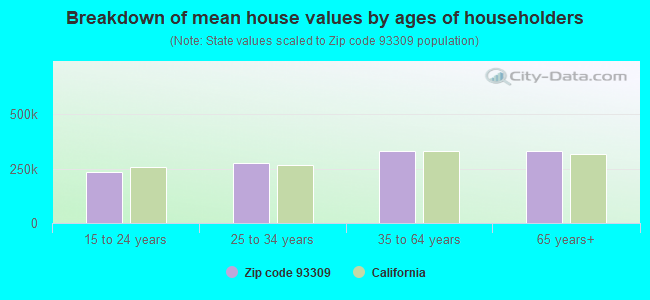
Estimated median house/condo value in 2022: $291,876
93309:
$291,876
California:
$715,900
According to our research of California and other state lists, there were 86 registered sex offenders living in 93309 zip code as of April 27, 2024. The ratio of all residents to sex offenders in zip code 93309 is 702 to 1. The ratio of registered sex offenders to all residents in this zip code is near the state average.
Median resident age:
This zip code:
32.0 years
California median age:
37.9 years
Average household size:
This zip code:
2.7 people
California:
2.8 people
Averages for the 2020 tax year for zip code 93309, filed in 2021:
Average Adjusted Gross Income (AGI) in 2020: $61,136 (Individual Income Tax Returns)
Here:
$61,136
State:
$95,910
Salary/wage: $43,637 (reported on 81.2% of returns)
Here:
$43,637
State:
$77,331
(% of AGI for various income ranges: 1173.5% for AGIs below $25k, 3763.8% for AGIs $25k-50k, 7171.7% for AGIs $50k-75k, 10732.4% for AGIs $75k-100k, 19585.0% for AGIs $100k-200k, 96306.7% for AGIs over 200k)
Taxable interest for individuals: $2,794 (reported on 24.9% of returns)
This zip code:
$2,794
California:
$2,294
(% of AGI for various income ranges: 7.6% for AGIs below $25k, 8.9% for AGIs $25k-50k, 26.5% for AGIs $50k-75k, 48.2% for AGIs $75k-100k, 141.3% for AGIs $100k-200k, 12330.8% for AGIs over 200k)
Ordinary dividends: $11,168 (reported on 8.6% of returns)
Here:
$11,168
State:
$10,949
(% of AGI for various income ranges: 14.6% for AGIs below $25k, 18.8% for AGIs $25k-50k, 52.9% for AGIs $50k-75k, 110.5% for AGIs $75k-100k, 446.5% for AGIs $100k-200k, 13408.3% for AGIs over 200k)
Net capital gain/loss in AGI: +$35,489 (reported on 9.1% of returns)
Here:
+$35,489
State:
+$49,306
(% of AGI for various income ranges: 2.9% for AGIs below $25k, 8.2% for AGIs $25k-50k, 34.4% for AGIs $50k-75k, 110.0% for AGIs $75k-100k, 643.8% for AGIs $100k-200k, 64200.0% for AGIs over 200k)
Profit/loss from business: +$10,390 (reported on 15.4% of returns)
Here:
+$10,390
State:
+$15,671
(% of AGI for various income ranges: 133.3% for AGIs below $25k, 137.4% for AGIs $25k-50k, 211.2% for AGIs $50k-75k, 178.5% for AGIs $75k-100k, 520.0% for AGIs $100k-200k, 10070.0% for AGIs over 200k)
Taxable individual retirement arrangement distribution: $19,662 (reported on 5.3% of returns)
93309:
$19,662
California:
$23,505
(% of AGI for various income ranges: 28.5% for AGIs below $25k, 51.6% for AGIs $25k-50k, 131.2% for AGIs $50k-75k, 275.7% for AGIs $75k-100k, 978.7% for AGIs $100k-200k, 4934.2% for AGIs over 200k)
Self-employed (Keogh) retirement plans: $50,080 (reported on 0.2% of returns)
93309:
$50,080
California:
$30,163
(% of AGI for various income ranges: 18.5% for AGIs $50k-75k, 1690.0% for AGIs over 200k)
Total itemized deductions: $35,196 (reported on 7.2% of returns)
Here:
$35,196
State:
$39,517
(% of AGI for various income ranges: 37.0% for AGIs below $25k, 91.4% for AGIs $25k-50k, 327.6% for AGIs $50k-75k, 773.1% for AGIs $75k-100k, 1627.2% for AGIs $100k-200k, 20628.3% for AGIs over 200k)
Charity contributions: $14,124 (reported on 6.0% of returns)
Here:
$14,124
State:
$12,598
(% of AGI for various income ranges: 2.3% for AGIs below $25k, 11.1% for AGIs $25k-50k, 50.5% for AGIs $50k-75k, 144.5% for AGIs $75k-100k, 429.6% for AGIs $100k-200k, 12015.0% for AGIs over 200k)
Taxes paid: $7,667 (reported on 7.1% of returns)
93309:
$7,667
State:
$8,807
(% of AGI for various income ranges: 4.9% for AGIs below $25k, 19.7% for AGIs $25k-50k, 80.3% for AGIs $50k-75k, 238.1% for AGIs $75k-100k, 506.1% for AGIs $100k-200k, 2430.0% for AGIs over 200k)
Earned income credit: $2,388 (reported on 23.8% of returns)
Here:
$2,388
State:
$2,074
(% of AGI for various income ranges: 127.2% for AGIs below $25k, 100.2% for AGIs $25k-50k, 2.3% for AGIs $50k-75k)
Percentage of individuals using paid preparers for their 2020 taxes: 94.4%
Here:
94%
State:
92%
(% for various income ranges: 93.5% for AGIs below $25k, 95.0% for AGIs $25k-50k, 94.6% for AGIs $50k-75k, 94.6% for AGIs $75k-100k, 94.2% for AGIs $100k-200k, 96.7% for AGIs over 200k)
Averages for the 2012 tax year for zip code 93309, filed in 2013:
Average Adjusted Gross Income (AGI) in 2012: $54,859 (Individual Income Tax Returns)
Here:
$54,859
State:
$72,726
Salary/wage: $42,706 (reported on 83.5% of returns)
Here:
$42,706
State:
$59,079
(% of AGI for various income ranges: 75.8% for AGIs below $25k, 83.1% for AGIs $25k-50k, 79.1% for AGIs $50k-75k, 74.5% for AGIs $75k-100k, 71.0% for AGIs $100k-200k, 31.4% for AGIs over 200k)
Taxable interest for individuals: $2,490 (reported on 27.5% of returns)
This zip code:
$2,490
California:
$2,146
(% of AGI for various income ranges: 0.8% for AGIs below $25k, 0.4% for AGIs $25k-50k, 0.5% for AGIs $50k-75k, 0.6% for AGIs $75k-100k, 0.8% for AGIs $100k-200k, 3.1% for AGIs over 200k)
Ordinary dividends: $7,454 (reported on 11.0% of returns)
Here:
$7,454
State:
$9,308
(% of AGI for various income ranges: 0.9% for AGIs below $25k, 0.6% for AGIs $25k-50k, 0.6% for AGIs $50k-75k, 1.1% for AGIs $75k-100k, 1.6% for AGIs $100k-200k, 2.9% for AGIs over 200k)
Net capital gain/loss in AGI: +$16,820 (reported on 9.6% of returns)
Here:
+$16,820
State:
+$30,460
(% of AGI for various income ranges: 0.1% for AGIs $50k-75k, 0.4% for AGIs $75k-100k, 1.0% for AGIs $100k-200k, 10.5% for AGIs over 200k)
Profit/loss from business: +$14,202 (reported on 14.8% of returns)
Here:
+$14,202
State:
+$17,064
(% of AGI for various income ranges: 10.2% for AGIs below $25k, 3.5% for AGIs $25k-50k, 2.0% for AGIs $50k-75k, 1.9% for AGIs $75k-100k, 3.7% for AGIs $100k-200k, 3.5% for AGIs over 200k)
Taxable individual retirement arrangement distribution: $18,273 (reported on 7.5% of returns)
93309:
$18,273
California:
$19,557
(% of AGI for various income ranges: 2.1% for AGIs below $25k, 1.5% for AGIs $25k-50k, 2.3% for AGIs $50k-75k, 3.3% for AGIs $75k-100k, 3.3% for AGIs $100k-200k, 2.5% for AGIs over 200k)
Self-employment retirement plans: $26,660 (reported on 0.4% of returns)
93309:
$26,660
California:
$24,530
(% of AGI for various income ranges: 0.1% for AGIs below $25k, 0.3% for AGIs $100k-200k, 0.5% for AGIs over 200k)
Total itemized deductions: $26,367 (22% of AGI, reported on 28.3% of returns)
Here:
$26,367
State:
$34,004
Here:
22.0% of AGI
State:
22.7% of AGI
(% of AGI for various income ranges: 6.5% for AGIs below $25k, 8.9% for AGIs $25k-50k, 13.7% for AGIs $50k-75k, 15.5% for AGIs $75k-100k, 17.2% for AGIs $100k-200k, 15.8% for AGIs over 200k)
Charity contributions: $4,654 (reported on 24.0% of returns)
Here:
$4,654
State:
$4,659
(% of AGI for various income ranges: 0.6% for AGIs below $25k, 1.0% for AGIs $25k-50k, 1.7% for AGIs $50k-75k, 2.0% for AGIs $75k-100k, 2.7% for AGIs $100k-200k, 3.0% for AGIs over 200k)
Taxes paid: $10,453 (reported on 28.2% of returns)
93309:
$10,453
State:
$14,448
(% of AGI for various income ranges: 1.2% for AGIs below $25k, 1.8% for AGIs $25k-50k, 3.5% for AGIs $50k-75k, 4.6% for AGIs $75k-100k, 6.6% for AGIs $100k-200k, 9.9% for AGIs over 200k)
Earned income credit: $2,515 (reported on 26.0% of returns)
Here:
$2,515
State:
$2,286
(% of AGI for various income ranges: 9.1% for AGIs below $25k, 1.5% for AGIs $25k-50k)
Percentage of individuals using paid preparers for their 2012 taxes: 64.1%
Here:
64%
State:
64%
(% for various income ranges: 59.8% for AGIs below $25k, 61.8% for AGIs $25k-50k, 68.3% for AGIs $50k-75k, 72.1% for AGIs $75k-100k, 73.9% for AGIs $100k-200k, 87.0% for AGIs over 200k)
Averages for the 2004 tax year for zip code 93309, filed in 2005:
Average Adjusted Gross Income (AGI) in 2004: $45,733 (Individual Income Tax Returns)
Here:
$45,733
State:
$58,600
Salary/wage: $37,901 (reported on 84.2% of returns)
Here:
$37,901
State:
$49,455
(% of AGI for various income ranges: 130.6% for AGIs below $10k, 79.3% for AGIs $10k-25k, 83.1% for AGIs $25k-50k, 79.4% for AGIs $50k-75k, 76.3% for AGIs $75k-100k, 50.2% for AGIs over 100k)
Taxable interest for individuals: $2,135 (reported on 40.6% of returns)
This zip code:
$2,135
California:
$2,365
(% of AGI for various income ranges: 5.7% for AGIs below $10k, 1.6% for AGIs $10k-25k, 1.2% for AGIs $25k-50k, 1.1% for AGIs $50k-75k, 1.2% for AGIs $75k-100k, 2.9% for AGIs over 100k)
Taxable dividends: $3,948 (reported on 16.8% of returns)
Here:
$3,948
State:
$4,746
(% of AGI for various income ranges: 4.1% for AGIs below $10k, 1.1% for AGIs $10k-25k, 0.8% for AGIs $25k-50k, 0.9% for AGIs $50k-75k, 1.1% for AGIs $75k-100k, 2.3% for AGIs over 100k)
Net capital gain/loss: +$15,983 (reported on 14.8% of returns)
Here:
+$15,983
State:
+$23,418
(% of AGI for various income ranges: 3.9% for AGIs below $10k, 0.4% for AGIs $10k-25k, 0.5% for AGIs $25k-50k, 0.9% for AGIs $50k-75k, 1.8% for AGIs $75k-100k, 12.6% for AGIs over 100k)
Profit/loss from business: +$12,866 (reported on 14.5% of returns)
Here:
+$12,866
State:
+$16,826
(% of AGI for various income ranges: 2.1% for AGIs below $10k, 5.6% for AGIs $10k-25k, 2.7% for AGIs $25k-50k, 2.8% for AGIs $50k-75k, 3.3% for AGIs $75k-100k, 5.5% for AGIs over 100k)
Profit/loss from farming: +$23,312 (reported on 0.2% of returns)
Here:
+$23,312
State:
-$7,562
IRA payment deduction: $3,125 (reported on 2.0% of returns)
93309:
$3,125
California:
$3,192
(% of AGI for various income ranges: 0.3% for AGIs below $10k, 0.1% for AGIs $10k-25k, 0.2% for AGIs $25k-50k, 0.1% for AGIs $50k-75k, 0.2% for AGIs $75k-100k, 0.1% for AGIs over 100k)
Self-employed pension: $17,328 (reported on 0.8% of returns)
Here:
$17,328
California:
$17,688
(% of AGI for various income ranges: 0.1% for AGIs $25k-50k, 0.1% for AGIs $50k-75k, 0.2% for AGIs $75k-100k, 0.6% for AGIs over 100k)
Total itemized deductions: $20,812 (24% of AGI, reported on 35.9% of returns)
Here:
$20,812
State:
$28,113
Here:
24.3% of AGI
State:
25.3% of AGI
(% of AGI for various income ranges: 17.2% for AGIs below $10k, 9.0% for AGIs $10k-25k, 14.6% for AGIs $25k-50k, 19.1% for AGIs $50k-75k, 19.6% for AGIs $75k-100k, 16.9% for AGIs over 100k)
Charity contributions deductions: $3,830 (4% of AGI, reported on 32.8% of returns)
Here:
$3,830
State:
$3,923
Here:
4.3% of AGI
State:
3.3% of AGI
(% of AGI for various income ranges: 1.2% for AGIs below $10k, 1.1% for AGIs $10k-25k, 1.8% for AGIs $25k-50k, 2.7% for AGIs $50k-75k, 3.1% for AGIs $75k-100k, 3.7% for AGIs over 100k)
Total tax: $7,308 (reported on 71.8% of returns)
93309:
$7,308
State:
$10,761
(% of AGI for various income ranges: 4.2% for AGIs below $10k, 3.7% for AGIs $10k-25k, 6.0% for AGIs $25k-50k, 8.5% for AGIs $50k-75k, 10.2% for AGIs $75k-100k, 19.0% for AGIs over 100k)
Earned income credit: $1,917 (reported on 21.0% of returns)
Here:
$1,917
State:
$1,763
Percentage of individuals using paid preparers for their 2004 taxes: 67.4%
Here:
67%
State:
66%
(% for various income ranges: 59.0% for AGIs below $10k, 67.2% for AGIs $10k-25k, 66.7% for AGIs $25k-50k, 71.2% for AGIs $50k-75k, 73.5% for AGIs $75k-100k, 77.5% for AGIs over 100k)
Likely homosexual households (counted as self-reported same-sex unmarried-partner households)
Lesbian couples: 0.4% of all households
Gay men: 0.1% of all households
Household received Food Stamps/SNAP in the past 12 months: 4,810 Household did not receive Food Stamps/SNAP in the past 12 months: 18,137
Women who had a birth in the past 12 months: 1,407 (542 now married, 874 unmarried) Women who did not have a birth in the past 12 months: 13,849 (4,412 now married, 9,482 unmarried)
Housing units in zip code 93309 with a mortgage: 7,009 (287 second mortgage, 20 home equity loan, 208 both second mortgage and home equity loan) Houses without a mortgage: 42
Median monthly owner costs for units with a mortgage: $1,642 Median monthly owner costs for units without a mortgage: $661
Residents with income below the poverty level in 2022:
This zip code:
17.2%
Whole state:
12.2%
Residents with income below 50% of the poverty level in 2022:
This zip code:
9.0%
Whole state:
6.2%
Median number of rooms in houses and condos:
Here:
5.9
State:
6.0
Median number of rooms in apartments:
Here:
4.1
State:
3.9
Notable locations in this zip code not listed on our city pages
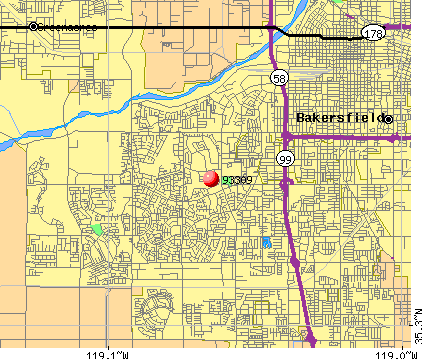
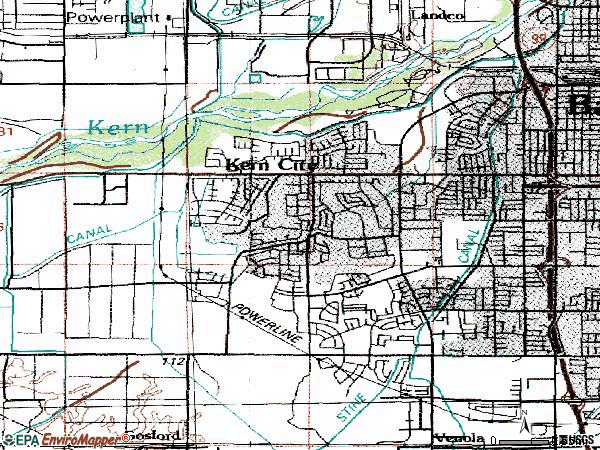
Notable locations in zip code 93309: Stockdale Ranch (A), Stockdale Country Club (B), Kern City Golf Course (C), Bakersfield Fire Department Station 7 (D), Bakersfield Fire Department Station 3 (E), Bakersfield Fire Department Station 11 (F), Bakersfield Fire Department Station 9 (G). Display/hide their locations on the map
Shopping Centers: Stockdale West Shopping Center (1), Stockdale Village Shopping Center (2), Stockdale Fashion Plaza Shopping Center (3), Builders Square Shopping Center (4), Best Plaza Shopping Center (5). Display/hide their locations on the map
Churches in zip code 93309 include: Evangel Assembly of God Church (A), Saint Johns Lutheran Church (B), Westside Church of Christ (C), Covenant Community Presbyterian Church (D), First Congregational Church of Bakersfield (E), First United Methodist Church (F), Harvest Foursquare Church (G), Stockdale Southern Baptist Church (H). Display/hide their locations on the map
Parks in zip code 93309 include: Brockton Grissom Park (1), Corvallis Park (2), Patriots Park (3), Quailwood Park (4), West Park (5), Westwood Park (6), Saunders Park (7). Display/hide their locations on the map
7,015 married couples with children.
6,498 single-parent households (2,144 men, 4,354 women).
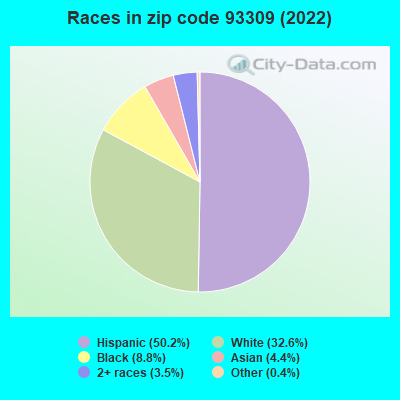
63.3% of residents of 93309 zip code speak English at home.
31.5% of residents speak Spanish at home (72% very well, 15% well, 8% not well, 6% not at all).
1.7% of residents speak other Indo-European language at home (59% very well, 16% well, 14% not well, 11% not at all).
3.1% of residents speak Asian or Pacific Island language at home (59% very well, 25% well, 14% not well, 1% not at all).
0.3% of residents speak other language at home (59% very well, 17% well, 24% not well).
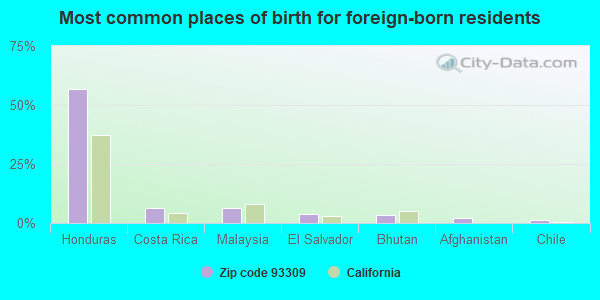
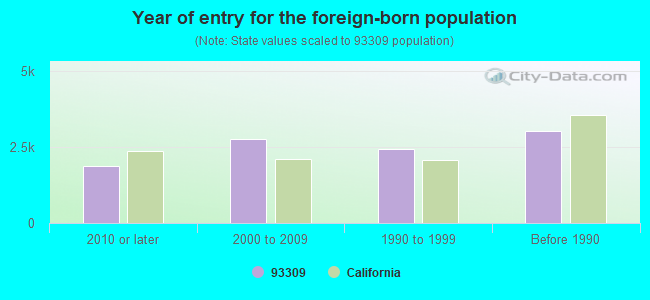
Foreign born population: 9,543 (15.3%) (47.7% of them are naturalized citizens)
Major facilities with environmental interests located in this zip code:
CHEVRON STATION NO 201527 (6601 MING AVE in BAKERSFIELD, CA)
STATE MASTER (California - Hazardous Waste Tracking) - HAZARDOU WASTE PROGRAM CRITERIA AND HAZARDOUS AIR POLLUTANT INVENTORY (Inventory of air pollution sources) HAZARDOUS WASTE BIENNIAL REPORTER (Resource Conservation and Recovery Act (tracking hazardous waste)) Large Quantity Generators, more that 1000 kg of hazardous waste/month (Resource Conservation and Recovery Act (tracking hazardous waste)) Small Quantity Generators, between 100 kg and 1000 kg of hazardous waste/month (Resource Conservation and Recovery Act (tracking hazardous waste)) - notification Business SIC classification: GASOLINE SERVICE STATIONS Organizations: CHEVRON PRODUCTS CO (CONTACT/OWNER)
Alternative names: CHEVRON 201527, CHEVRON USA INC
EQUILON ENTERPRISES (3698 MING AVE SAP NO 121176 in BAKERSFIELD, CA) . Federal Facility
STATE MASTER (California - Hazardous Waste Tracking) - HAZARDOU WASTE PROGRAM CRITERIA AND HAZARDOUS AIR POLLUTANT INVENTORY (Inventory of air pollution sources) HAZARDOUS WASTE BIENNIAL REPORTER (Resource Conservation and Recovery Act (tracking hazardous waste)) Large Quantity Generators, more that 1000 kg of hazardous waste/month (Resource Conservation and Recovery Act (tracking hazardous waste)) - notification Business SIC classification: GASOLINE SERVICE STATIONS Alternative names: EQUILON ENTERPRISES LLC, TEXACO SERVICE STATION, TEXACO SERVICE STATION 121176
BARBER HONDA (4500 WIBLE ST in BAKERSFIELD, CA)
STATE MASTER (California - Hazardous Waste Tracking) - HAZARDOU WASTE PROGRAM Small Quantity Generators, between 100 kg and 1000 kg of hazardous waste/month (Resource Conservation and Recovery Act (tracking hazardous waste)) - notification Organizations: BARBER PONTIAC (CONTACT/OWNER)
EQUILON ENTERPRISES (3623 CALIFORNIA in BAKERSFIELD, CA) . Federal Facility
STATE MASTER (California - Hazardous Waste Tracking) - HAZARDOU WASTE PROGRAM Small Quantity Generators, between 100 kg and 1000 kg of hazardous waste/month (Resource Conservation and Recovery Act (tracking hazardous waste)) - notification Organizations: EQUILON ENTERPRISES, LLC (CONTACT/OWNER)
Alternative names: SHELL OIL CO
BAKERFIELD CITY OF (4101 TRUXTUN AVE in BAKERSFIELD, CA)
STATE MASTER (California - Hazardous Waste Tracking) - HAZARDOU WASTE PROGRAM Small Quantity Generators, between 100 kg and 1000 kg of hazardous waste/month (Resource Conservation and Recovery Act (tracking hazardous waste)) Alternative names: BAKERSFIELD CITY OF
LAURELGLEN ELEMENTARY (2601 EL PORTAL DR. in BAKERSFIELD, CA)
(National Center for Education Statistics) - STATE ID-6105423 Organizations: PANAMA BUENA VISTA UNION ELEMENTARY (SCHOOL DISTRICT)
HARRIS (CAROLINE) ELEMENTARY (4110 GARNSEY LANE in BAKERSFIELD, CA)
(National Center for Education Statistics) - STATE ID-6008858 Organizations: BAKERSFIELD CITY ELEMENTARY (SCHOOL DISTRICT)
ABLE CENTER (HIGH) (501 S. MT. VERNON AVE. in BAKERSFIELD, CA)
(National Center for Education Statistics) - STATE ID-1530450 Organizations: KERN UNION HIGH (SCHOOL DISTRICT)
ACTIS (O.J.) JUNIOR HIGH (2400 WESTHOLME BLVD. in BAKERSFIELD, CA)
(National Center for Education Statistics) - STATE ID-6099428 Organizations: PANAMA BUENA VISTA UNION ELEMENTARY (SCHOOL DISTRICT)
CASTLE (CHARLES H.) ELEMENTARY (6001 EDGEMONT DR. in BAKERSFIELD, CA)
(National Center for Education Statistics) - STATE ID-6095012 Organizations: PANAMA BUENA VISTA UNION ELEMENTARY (SCHOOL DISTRICT)
KERN WORKFORCE 2000 ACADEMY (CHARTER) (5801 SUNDALE AVE. in BAKERSFIELD, CA)
(National Center for Education Statistics) - STATE ID-1530435 Organizations: KERN UNION HIGH (SCHOOL DISTRICT)
MUNSEY ELEMENTARY (3801 BRAVE AVE. in BAKERSFIELD, CA)
(National Center for Education Statistics) - STATE ID-6009096 Organizations: BAKERSFIELD CITY ELEMENTARY (SCHOOL DISTRICT)
HADDAD DODGE (4001 CALIFORNIA AVE in BAKERSFIELD, CA)
(Resource Conservation and Recovery Act (tracking hazardous waste)) Organizations: E W HADDA (CONTACT/OWNER)
Housing units lacking complete plumbing facilities: 1.1% Housing units lacking complete kitchen facilities: 2.8%
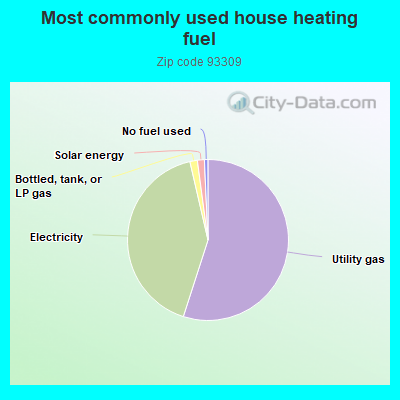
54.8%Utility gas
41.3%Electricity
1.5%Bottled, tank, or LP gas
1.4%Solar energy
0.7%No fuel used
Population in 1990: 58,179. Population change in the 1990s: +433 (+0.7%).
Place of birth for U.S.-born residents:
This state: 44,153
Northeast: 864
Midwest: 1,831
South: 3,332
West: 1,968
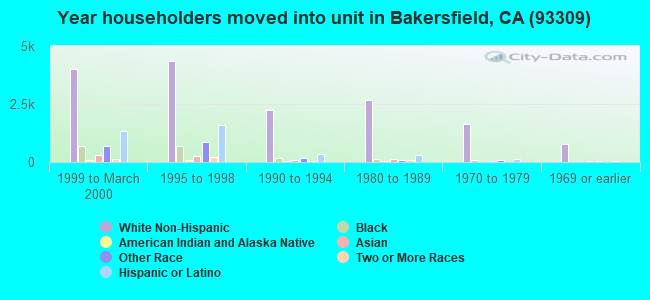
45% of the 93309 zip code residents lived in the same house 5 years ago. Out of people who lived in different houses, 75% lived in this county. Out of people who lived in different counties, 50% lived in California.
86% of the 93309 zip code residents lived in the same house 1 year ago. Out of people who lived in different houses, 70% moved from this county. Out of people who lived in different houses, 21% moved from different county within same state. Out of people who lived in different houses, 3% moved from different state. Out of people who lived in different houses, 3% moved from abroad.
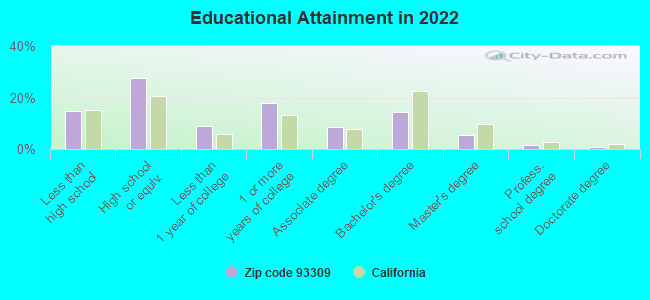
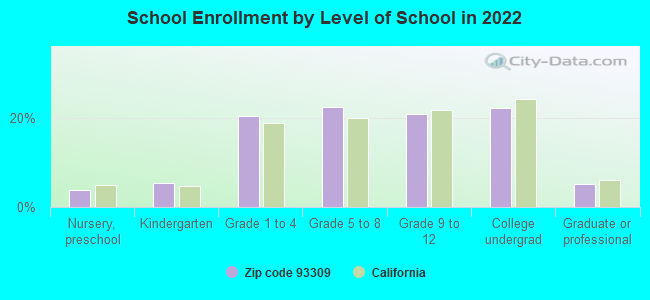
Private vs. public school enrollment:
Students in private schools in grades 1 to 8 (elementary and middle school): 472
Here:
6.7%
California:
10.5%
Students in private schools in grades 9 to 12 (high school): 185
Here:
5.4%
California:
8.5%
Students in private undergraduate colleges: 338
Here:
9.3%
California:
15.9%
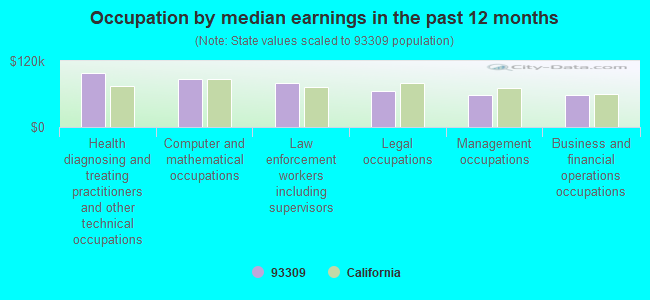
Occupation by median earnings in the past 12 months ($)
97,619Health diagnosing and treating practitioners and other technical occupations
87,276Computer and mathematical occupations
79,282Law enforcement workers including supervisors
64,955Legal occupations
59,080Management occupations
57,880Business and financial operations occupations
Companies with biggest federal contracts located in this zip code (BAKERSFIELD, CA):
APPLIED PLANNING INTERNATIONAL (5300 LENNOX AVENUE; small business) : $6,134,589 in 57 contractsfrom 2000 to 2004
Contracts for Other ADP and Telecommunications Services (includes data storage on tapes, compact disks, etc.), ADP Systems Analysis Services, Other Professional Services, Automated Information System Design and Integration Services, and moreby Navy, National Park Service, Federal Technology Service, National Oceanic and Atmospheric Administration/Under Secretary for Oceans and Atmosphere, and others Signed by year:2000: $1,848,000; 2001: $1,825,600; 2002: $1,274,168; 2003: $651,620; 2004: $535,201; 2005: $0; 2006: $0.
Biggest contracts:
$598,000 with Navy for Other ADP and Telecommunications Services (includes data storage on tapes, compact disks, etc.). Signed on 2002-10-25. Completion date: 2003-10-24.
$598,000, same as above.Signed on 2001-11-16. Completion date: 2002-11-14.
$462,000 with National Park Service for ADP Systems Analysis Services. Taking place in DC. Signed on 2001-07-15. Completion date: 2001-10-15.
$281,000 with Federal Technology Service for Other ADP and Telecommunications Services (includes data storage on tapes, compact disks, etc.). Signed on 2000-11-15. Completion date: 2001-06-15.
SHAKIR ENTERPRISES (5301 WHITE LN; small business) : $4,148,983 in 164 contractsfrom 1999 to 2006
Contracts for Office Furniture, Tractors, Wheeled, Material Handling Equipment, Nonself-Propelled, Warehouse Trucks and Tractors, Self-Propelled, and moreby Air Force, Navy, Army, Defense Logistics Agency, and others Signed by year:2000: $735,028; 2001: $1,025,103; 2002: $535,113; 2003: $890,278; 2004: $457,922; 2005: $438,324; 2006: $28,533.
Biggest contracts:
$291,711 with Air Force for Office Furniture. Signed on 2001-09-17. Completion date: 2001-09-15.
$187,500 with Navy for Tractors, Wheeled. Signed on 2001-07-10. Completion date: 2001-12-07.
$111,867 with Army for Material Handling Equipment, Nonself-Propelled. Signed on 2003-08-05. Completion date: 2003-09-30.
$94,992 with Army for Warehouse Trucks and Tractors, Self-Propelled. Signed on 2003-07-23. Completion date: 2003-10-22.
REHAN INDUSTRIAL SUPPLY (4100 EASTON DR STE 19; small business) : $2,765,150 in 122 contractsfrom 1999 to 2006
Contracts for Fans, Air Circulators, and Blower Equipment, Electrical Insulators and Insulating Materials, Lugs, Terminals, and Terminal Strips, Batteries, Rechargeable, and moreby Army, Defense Logistics Agency, Navy Signed by year:2000: $233,985; 2001: $216,266; 2002: $400,194; 2003: $331,916; 2004: $590,470; 2005: $594,369; 2006: $200,354.
Biggest contracts:
$240,768 with Army for Fans, Air Circulators, and Blower Equipment. Signed on 2002-05-17. Completion date: 2003-06-30.
$153,920 with Defense Logistics Agency for Electrical Insulators and Insulating Materials. Signed on 2005-05-06. Completion date: 2005-07-05.
$137,592 with Defense Logistics Agency for Lugs, Terminals, and Terminal Strips. Signed on 2004-03-11. Completion date: 2004-04-02.
$125,358 with Defense Logistics Agency for Batteries, Rechargeable. Signed on 1999-10-15. Completion date: 2000-06-30.
HILLCREST SHEETMETAL INC (4540 EASTON DRIVE; small business) : $1,777,598 in 138 contractsfrom 2002 to 2006
Contracts for Maintenance, Repair and Rebuilding of Equipment -- Refrigeration, Air Conditioning, and Air Circulating Equipment by Army Signed by year:2000: $0; 2001: $0; 2002: $182,403; 2003: $220,852; 2004: $628,671; 2005: $517,552; 2006: $228,120.
Biggest contracts:
$122,120 with Army for Maintenance, Repair and Rebuilding of Equipment -- Refrigeration, Air Conditioning, and Air Circulating Equipment. Signed on 2004-08-09. Completion date: 2004-08-26.
$103,248, same as above.Signed on 2006-03-21. Completion date: 2006-12-31.
$96,108, same as above.Signed on 2006-02-05. Completion date: 2006-12-31.
$95,595, same as above.Signed on 2002-01-10. Completion date: 2002-12-31.
PACIFIC SUPPLY (4104 PINEWOOD LAKE DR; small business) : $1,698,033 in 111 contractsfrom 1999 to 2006
Contracts for Passenger Motor Vehicles, Miscellaneous Materials Handling Equipment, Miscellaneous Construction Equipment, Electrical and Electronic Properties Measuring and Testing Instruments, and moreby Army, Air Force, Navy, U.S. Army Corps of Engineers - civil program financing only, and others Signed by year:2000: $273,419; 2001: $88,088; 2002: $435,631; 2003: $230,035; 2004: $382,060; 2005: $168,474; 2006: $19,262.
Biggest contracts:
$98,110 with Army for Passenger Motor Vehicles. Signed on 2002-08-15. Completion date: 2002-08-15.
$80,095 with Army for Miscellaneous Materials Handling Equipment. Signed on 2001-05-08. Completion date: 2001-07-10.
$69,411 with Air Force for Miscellaneous Construction Equipment. Taking place in AZ. Signed on 2002-09-30. Completion date: 2002-10-23.
$60,248 with Army for Electrical and Electronic Properties Measuring and Testing Instruments. Taking place in UT. Signed on 2002-09-19. Completion date: 2002-10-24.
HAKIMUDDIN, MARIYA (7301 WILFORD CT; small business) : $1,342,305 in 115 contractsfrom 2004 to 2006
Contracts for Engine Fuel System Components, Nonaircraft, Guns, through 30 mm, Diesel Engines and Components, Engine Cooling System Components, Nonaircraft, and moreby Defense Logistics Agency Signed by year:2000: $0; 2001: $0; 2002: $0; 2003: $0; 2004: $72,308; 2005: $731,143; 2006: $538,854.
Biggest contracts:
$61,232 with Defense Logistics Agency for Engine Fuel System Components, Nonaircraft. Signed on 2006-02-09. Completion date: 2006-04-02.
$59,789, same as above.Signed on 2006-03-17. Completion date: 2006-05-28.
$54,754 with Defense Logistics Agency for Guns, through 30 mm. Signed on 2004-02-13. Completion date: 2004-03-04.
$45,905 with Defense Logistics Agency for Diesel Engines and Components. Signed on 2006-05-05. Completion date: 2006-10-31.
REHAN INDUSTRIAL SUPPLY INC (4100 EASTON DR STE 19; small business) : $1,334,449 in 134 contractsfrom 2004 to 2006
Contracts for Electrical Insulators and Insulating Materials, Motors, Electrical, Batteries, Nonrechargeable, Liquid and Gas Flow, Liquid Level, and Mechanical Motion Measuring Instruments, and moreby Defense Logistics Agency, Army, NASA, Navy, and others Signed by year:2000: $0; 2001: $0; 2002: $0; 2003: $0; 2004: $80,430; 2005: $957,177; 2006: $296,842.
Biggest contracts:
$74,623 with Defense Logistics Agency for Electrical Insulators and Insulating Materials. Signed on 2004-10-18. Completion date: 2004-12-17.
$53,867 with Defense Logistics Agency for Motors, Electrical. Signed on 2005-07-25. Completion date: 2005-11-22.
$51,218 with Defense Logistics Agency for Batteries, Nonrechargeable. Signed on 2005-09-06. Completion date: 2006-01-14.
$43,758 with Defense Logistics Agency for Electrical Insulators and Insulating Materials. Signed on 2005-02-17. Completion date: 2005-04-11.
REDWINE-MANLEY TESTING SERVICE (4503 JOANNE AVENUE; small business) : $181,655 in 7 contractsfrom 2000 to 2005
Contracts for Equipment and Materials Testing -- Pipe, Tubing, Hose, and Fittings, Maintenance, Repair or Alteration of Real Property -- Sewage and Waste Facilities, Maintenance, Repair or Alteration of Real Property -- Other Non-Building Facilities, Other Quality Control, Testing and Inspection Services -- Fuels, Lubricants, Oils, and Waxes, and moreby Army, Navy Signed by year:2000: $56,295; 2001: $104,300; 2002: $0; 2003: $0; 2004: $0; 2005: $21,060; 2006: $0.
Biggest contracts:
$60,515 with Army for Equipment and Materials Testing -- Pipe, Tubing, Hose, and Fittings. Taking place in NY. Signed on 2001-06-19. Completion date: 2001-10-30.
$52,506 with Navy for Maintenance, Repair or Alteration of Real Property -- Sewage and Waste Facilities. Taking place in GA. Signed on 2000-08-29. Completion date: 2000-11-27.
$43,785 with Navy for Maintenance, Repair or Alteration of Real Property -- Other Non-Building Facilities. Taking place in GA. Signed on 2001-07-31. Completion date: 2001-11-09.
$8,560 with Army for Other Quality Control, Testing and Inspection Services -- Fuels, Lubricants, Oils, and Waxes. Signed on 2005-03-03. Completion date: 2005-05-16.
WZI INC (4700 STOCKDALE HWY , STE,) : $91,668 in 2 contractsfrom 2003 to 2006
$98,000 with Air Force for Maintenance, Repair and Rebuilding of Equipment -- Metalworking Machinery. Taking place in OK. Signed on 2003-06-10. Completion date: 2003-09-30.
-$6,332 with Air Force for Equipment and Materials Testing -- Electrical and Electronic Equipment Components. Taking place in OK. Signed on 2006-02-09. Completion date: 2004-08-01.
AT&T WIRELESS SERVICES INC (4180 TRUXTUN AVE) : $73,734 in 2 contractsfrom 1999 to 2000
$47,843 with Navy for Maintenance, Repair and Rebuilding of Equipment -- Communication, Detection, and Coherent Radiation Equipment. Signed on 1999-11-03. Completion date: 2000-02-03.
$25,891, same as above.Signed on 2000-02-03. Completion date: 2000-03-31.
Top industries in this zip code by the number of employees in 2005:
Administrative and Support and Waste Management and Remediation Services: Temporary Help Services (500-999 employees: 1 establishment, 250-499 employees: 3 establishments, 100-249 employees: 2 establishments, 50-99 employees: 3 establishments, 20-49 employees: 7 establishments, 10-19 employees: 2 establishments, 5-9 employees: 1 establishment, 1-4 employees: 7 establishments)
Mining: Support Activities for Oil and Gas Operations (over 1000: 1, 10-19: 3, 5-9: 2, 1-4: 5)
Health Care and Social Assistance: Offices of Physicians (except Mental Health Specialists) (250-499: 1, 100-249: 1, 50-99: 1, 20-49: 10, 10-19: 6, 5-9: 10, 1-4: 27)
Health Care and Social Assistance: Offices of Dentists (20-49: 5, 10-19: 16, 5-9: 16, 1-4: 20)
Management of Companies and Enterprises: Corporate, Subsidiary, and Regional Managing Offices (100-249: 2, 20-49: 3, 10-19: 4, 5-9: 3, 1-4: 4)
2005 - 2018 National Fire Incident Reporting System (NFIRS) incidents
Based on the data from the years 2005 - 2018 the average number of fires per year is 44. The highest number of fires - 219 took place in 2018, and the least - 0 in 2009. The data has an increasing trend.
When looking into fire subcategories, the most incidents belonged to: Outside Fires (49.1%), and Structure Fires (38.4%).
Fire incident types reported to NFIRS in Zip Code 93309


+$23,312
-$7,562
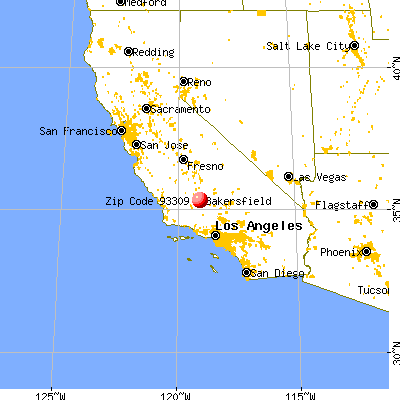
 Nearest zip codes: 93304, 93301, 93312, 93305, 93307, 93241.
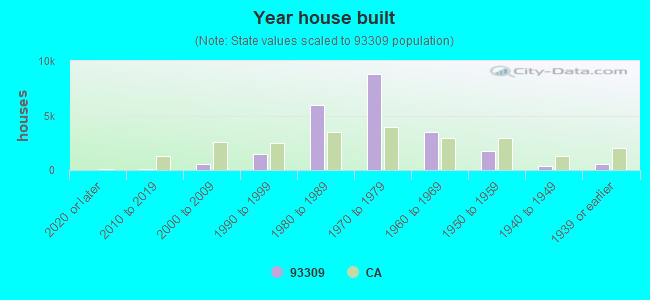


 Based on the data from the years 2005 - 2018 the average number of fires per year is 44. The highest number of fires - 219 took place in 2018, and the least - 0 in 2009. The data has an increasing trend.
 When looking into fire subcategories, the most incidents belonged to: Outside Fires (49.1%), and Structure Fires (38.4%).