Estimated zip code population in 2022: 11,662 Zip code population in 2010: 11,661 Zip code population in 2000: 9,391
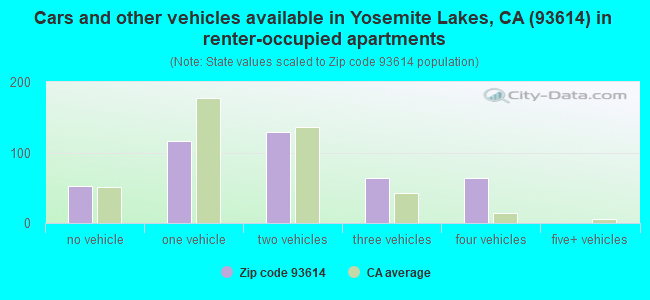
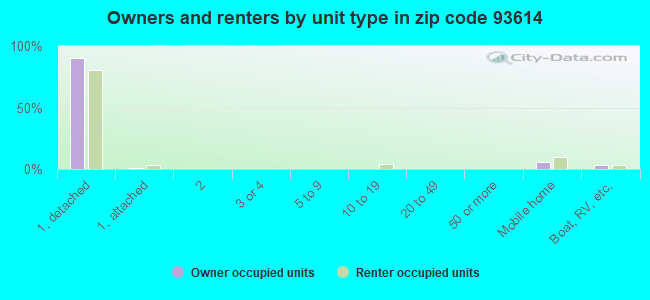
Houses and condos: 5,073 Renter-occupied apartments: 429
% of renters here:
10%
State:
44%
March 2022 cost of living index in zip code 93614: 95.4 (near average, U.S. average is 100)
Land area: 114.9 sq. mi. Water area: 0.3 sq. mi.
Population density: 102 people per square mile
(very low).
OSM Map
General Map
Google Map
MSN Map
OSM Map
General Map
Google Map
MSN Map
OSM Map
General Map
Google Map
MSN Map
OSM Map
General Map
Google Map
MSN Map
Please wait while loading the map...
Real estate property taxes paid for housing units in 2022:
This zip code:
0.7% ($2,669)
California:
0.7% ($4,831)
Median real estate property taxes paid for housing units with mortgages in 2022: $2,710 (0.7%) Median real estate property taxes paid for housing units with no mortgage in 2022: $2,640 (0.8%)
Business Search- 14 Million verified businesses
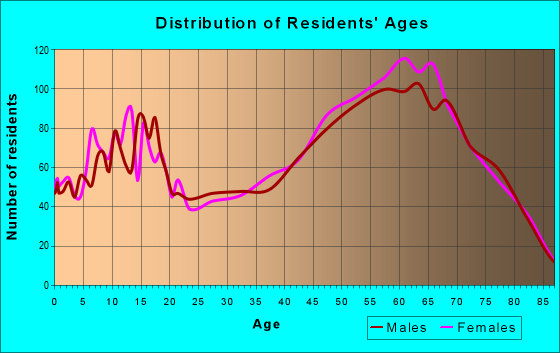
Males: 5,421
(46.5%)
Females: 6,241
(53.5%)
For population 25 years and over in 93614:
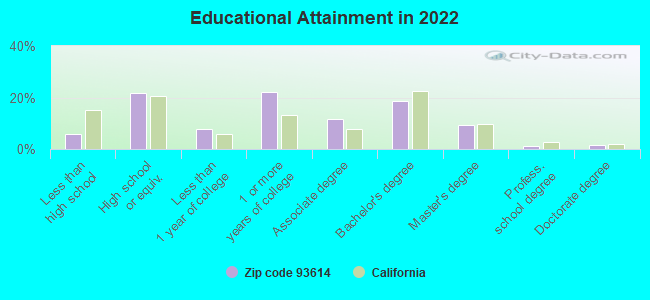
High school or higher: 93.5%
Bachelor's degree or higher: 30.7%
Graduate or professional degree: 12.2%
Unemployed: 7.1%
Mean travel time to work (commute): 40.4 minutes
For population 15 years and over in 93614:
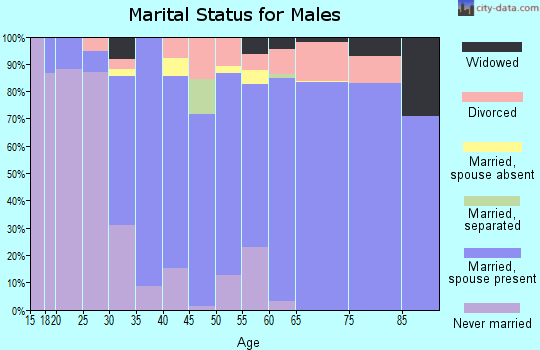
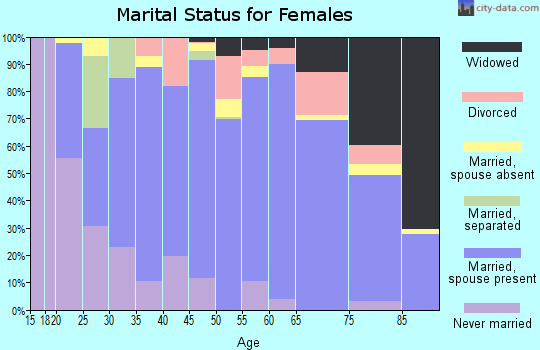
Never married: 21.6%
Now married: 57.0%
Separated: 1.8%
Widowed: 7.3%
Divorced: 12.4%
Zip code 93614 compared to state average:
Median house value below state average.
Black race population percentage significantly below state average.
Hispanic race population percentage below state average.
Median age above state average.
Foreign-born population percentage significantly below state average.
Renting percentage significantly below state average.
Length of stay since moving in below state average.
Averages for the 2020 tax year for zip code 93614, filed in 2021:
Average Adjusted Gross Income (AGI) in 2020: $70,712 (Individual Income Tax Returns)
Here:
$70,712
State:
$95,910
Salary/wage: $61,653 (reported on 68.3% of returns)
Here:
$61,653
State:
$77,331
(% of AGI for various income ranges: 993.7% for AGIs below $25k, 3094.3% for AGIs $25k-50k, 5786.0% for AGIs $50k-75k, 8389.5% for AGIs $75k-100k, 17409.6% for AGIs $100k-200k, 70535.0% for AGIs over 200k)
Taxable interest for individuals: $1,008 (reported on 46.3% of returns)
This zip code:
$1,008
California:
$2,294
(% of AGI for various income ranges: 26.6% for AGIs below $25k, 41.7% for AGIs $25k-50k, 86.6% for AGIs $50k-75k, 95.1% for AGIs $75k-100k, 147.6% for AGIs $100k-200k, 633.3% for AGIs over 200k)
Ordinary dividends: $3,903 (reported on 17.6% of returns)
Here:
$3,903
State:
$10,949
(% of AGI for various income ranges: 42.5% for AGIs below $25k, 57.4% for AGIs $25k-50k, 116.8% for AGIs $50k-75k, 130.0% for AGIs $75k-100k, 201.4% for AGIs $100k-200k, 1208.3% for AGIs over 200k)
Net capital gain/loss in AGI: +$12,797 (reported on 17.8% of returns)
Here:
+$12,797
State:
+$49,306
(% of AGI for various income ranges: 4.3% for AGIs below $25k, 35.9% for AGIs $25k-50k, 180.2% for AGIs $50k-75k, 140.8% for AGIs $75k-100k, 582.0% for AGIs $100k-200k, 12235.0% for AGIs over 200k)
Profit/loss from business: +$13,176 (reported on 16.1% of returns)
Here:
+$13,176
State:
+$15,671
(% of AGI for various income ranges: 122.2% for AGIs below $25k, 199.2% for AGIs $25k-50k, 322.6% for AGIs $50k-75k, 384.9% for AGIs $75k-100k, 700.4% for AGIs $100k-200k, 3321.7% for AGIs over 200k)
Taxable individual retirement arrangement distribution: $18,809 (reported on 12.8% of returns)
93614:
$18,809
California:
$23,505
(% of AGI for various income ranges: 99.5% for AGIs below $25k, 203.4% for AGIs $25k-50k, 420.9% for AGIs $50k-75k, 367.7% for AGIs $75k-100k, 975.5% for AGIs $100k-200k, 3265.0% for AGIs over 200k)
Total itemized deductions: $28,910 (reported on 11.7% of returns)
Here:
$28,910
State:
$39,517
(% of AGI for various income ranges: 71.0% for AGIs below $25k, 178.7% for AGIs $25k-50k, 557.0% for AGIs $50k-75k, 709.0% for AGIs $75k-100k, 1408.2% for AGIs $100k-200k, 5580.0% for AGIs over 200k)
Charity contributions: $6,863 (reported on 8.8% of returns)
Here:
$6,863
State:
$12,598
(% of AGI for various income ranges: 2.6% for AGIs below $25k, 21.4% for AGIs $25k-50k, 68.1% for AGIs $50k-75k, 84.1% for AGIs $75k-100k, 262.4% for AGIs $100k-200k, 1726.7% for AGIs over 200k)
Taxes paid: $7,585 (reported on 11.7% of returns)
93614:
$7,585
State:
$8,807
(% of AGI for various income ranges: 16.0% for AGIs below $25k, 30.5% for AGIs $25k-50k, 121.7% for AGIs $50k-75k, 200.5% for AGIs $75k-100k, 420.6% for AGIs $100k-200k, 1390.0% for AGIs over 200k)
Earned income credit: $1,994 (reported on 11.9% of returns)
Here:
$1,994
State:
$2,074
(% of AGI for various income ranges: 69.8% for AGIs below $25k, 79.1% for AGIs $25k-50k)
Percentage of individuals using paid preparers for their 2020 taxes: 92.5%
Here:
93%
State:
92%
(% for various income ranges: 90.5% for AGIs below $25k, 92.9% for AGIs $25k-50k, 91.4% for AGIs $50k-75k, 95.2% for AGIs $75k-100k, 93.8% for AGIs $100k-200k, 95.7% for AGIs over 200k)
Averages for the 2012 tax year for zip code 93614, filed in 2013:
Average Adjusted Gross Income (AGI) in 2012: $57,710 (Individual Income Tax Returns)
Here:
$57,710
State:
$72,726
Salary/wage: $50,806 (reported on 70.4% of returns)
Here:
$50,806
State:
$59,079
(% of AGI for various income ranges: 54.2% for AGIs below $25k, 56.8% for AGIs $25k-50k, 58.2% for AGIs $50k-75k, 63.9% for AGIs $75k-100k, 68.3% for AGIs $100k-200k, 59.3% for AGIs over 200k)
Taxable interest for individuals: $999 (reported on 46.2% of returns)
This zip code:
$999
California:
$2,146
(% of AGI for various income ranges: 2.3% for AGIs below $25k, 1.3% for AGIs $25k-50k, 1.0% for AGIs $50k-75k, 0.5% for AGIs $75k-100k, 0.5% for AGIs $100k-200k, 0.4% for AGIs over 200k)
Ordinary dividends: $2,862 (reported on 20.2% of returns)
Here:
$2,862
State:
$9,308
(% of AGI for various income ranges: 2.2% for AGIs below $25k, 1.7% for AGIs $25k-50k, 1.0% for AGIs $50k-75k, 0.8% for AGIs $75k-100k, 0.7% for AGIs $100k-200k, 0.5% for AGIs over 200k)
Net capital gain/loss in AGI: +$2,688 (reported on 17.4% of returns)
Here:
+$2,688
State:
+$30,460
(% of AGI for various income ranges: 0.6% for AGIs $50k-75k, 0.6% for AGIs $75k-100k, 1.2% for AGIs $100k-200k, 2.7% for AGIs over 200k)
Profit/loss from business: +$10,714 (reported on 18.5% of returns)
Here:
+$10,714
State:
+$17,064
(% of AGI for various income ranges: 12.0% for AGIs below $25k, 4.1% for AGIs $25k-50k, 3.8% for AGIs $50k-75k, 1.9% for AGIs $75k-100k, 1.6% for AGIs $100k-200k, 3.6% for AGIs over 200k)
Taxable individual retirement arrangement distribution: $16,512 (reported on 15.8% of returns)
93614:
$16,512
California:
$19,557
(% of AGI for various income ranges: 5.7% for AGIs below $25k, 5.3% for AGIs $25k-50k, 4.1% for AGIs $50k-75k, 5.0% for AGIs $75k-100k, 5.8% for AGIs $100k-200k)
Self-employment retirement plans: $17,750 (reported on 0.4% of returns)
93614:
$17,750
California:
$24,530
Total itemized deductions: $23,249 (25% of AGI, reported on 41.8% of returns)
Here:
$23,249
State:
$34,004
Here:
25.4% of AGI
State:
22.7% of AGI
(% of AGI for various income ranges: 18.7% for AGIs below $25k, 15.1% for AGIs $25k-50k, 16.9% for AGIs $50k-75k, 17.2% for AGIs $75k-100k, 17.4% for AGIs $100k-200k, 15.8% for AGIs over 200k)
Charity contributions: $3,117 (reported on 33.4% of returns)
Here:
$3,117
State:
$4,659
(% of AGI for various income ranges: 1.2% for AGIs below $25k, 1.5% for AGIs $25k-50k, 1.9% for AGIs $50k-75k, 2.1% for AGIs $75k-100k, 2.0% for AGIs $100k-200k, 1.6% for AGIs over 200k)
Taxes paid: $7,034 (reported on 41.6% of returns)
93614:
$7,034
State:
$14,448
(% of AGI for various income ranges: 2.8% for AGIs below $25k, 2.9% for AGIs $25k-50k, 4.0% for AGIs $50k-75k, 4.6% for AGIs $75k-100k, 6.2% for AGIs $100k-200k, 8.0% for AGIs over 200k)
Earned income credit: $2,067 (reported on 14.1% of returns)
Here:
$2,067
State:
$2,286
(% of AGI for various income ranges: 4.8% for AGIs below $25k, 1.1% for AGIs $25k-50k)
Percentage of individuals using paid preparers for their 2012 taxes: 54.0%
Here:
54%
State:
64%
(% for various income ranges: 47.0% for AGIs below $25k, 53.3% for AGIs $25k-50k, 61.8% for AGIs $50k-75k, 54.4% for AGIs $75k-100k, 60.9% for AGIs $100k-200k, 70.0% for AGIs over 200k)
Averages for the 2004 tax year for zip code 93614, filed in 2005:
Average Adjusted Gross Income (AGI) in 2004: $49,779 (Individual Income Tax Returns)
Here:
$49,779
State:
$58,600
Salary/wage: $44,316 (reported on 73.3% of returns)
Here:
$44,316
State:
$49,455
(% of AGI for various income ranges: 105.3% for AGIs below $10k, 58.5% for AGIs $10k-25k, 58.5% for AGIs $25k-50k, 70.4% for AGIs $50k-75k, 72.5% for AGIs $75k-100k, 61.2% for AGIs over 100k)
Taxable interest for individuals: $1,379 (reported on 58.4% of returns)
This zip code:
$1,379
California:
$2,365
(% of AGI for various income ranges: 9.1% for AGIs below $10k, 3.1% for AGIs $10k-25k, 2.1% for AGIs $25k-50k, 1.6% for AGIs $50k-75k, 0.9% for AGIs $75k-100k, 1.2% for AGIs over 100k)
Taxable dividends: $1,947 (reported on 25.7% of returns)
Here:
$1,947
State:
$4,746
(% of AGI for various income ranges: 5.1% for AGIs below $10k, 2.6% for AGIs $10k-25k, 1.3% for AGIs $25k-50k, 0.8% for AGIs $50k-75k, 0.6% for AGIs $75k-100k, 0.8% for AGIs over 100k)
Net capital gain/loss: +$11,695 (reported on 24.5% of returns)
Here:
+$11,695
State:
+$23,418
(% of AGI for various income ranges: -2.4% for AGIs below $10k, 1.0% for AGIs $10k-25k, 1.6% for AGIs $25k-50k, 1.7% for AGIs $50k-75k, 2.2% for AGIs $75k-100k, 13.7% for AGIs over 100k)
Profit/loss from business: +$13,155 (reported on 21.2% of returns)
Here:
+$13,155
State:
+$16,826
(% of AGI for various income ranges: -5.2% for AGIs below $10k, 8.7% for AGIs $10k-25k, 5.3% for AGIs $25k-50k, 4.6% for AGIs $50k-75k, 4.7% for AGIs $75k-100k, 6.5% for AGIs over 100k)
IRA payment deduction: $3,497 (reported on 3.3% of returns)
93614:
$3,497
California:
$3,192
(% of AGI for various income ranges: 0.2% for AGIs $10k-25k, 0.3% for AGIs $25k-50k, 0.3% for AGIs $50k-75k, 0.2% for AGIs $75k-100k, 0.2% for AGIs over 100k)
Self-employed pension: $13,226 (reported on 1.2% of returns)
Here:
$13,226
California:
$17,688
(% of AGI for various income ranges: 0.3% for AGIs $50k-75k, 0.3% for AGIs $75k-100k, 0.5% for AGIs over 100k)
Total itemized deductions: $20,362 (27% of AGI, reported on 48.0% of returns)
Here:
$20,362
State:
$28,113
Here:
26.9% of AGI
State:
25.3% of AGI
(% of AGI for various income ranges: 40.2% for AGIs below $10k, 20.2% for AGIs $10k-25k, 20.3% for AGIs $25k-50k, 20.4% for AGIs $50k-75k, 20.2% for AGIs $75k-100k, 17.8% for AGIs over 100k)
Charity contributions deductions: $2,764 (4% of AGI, reported on 41.9% of returns)
Here:
$2,764
State:
$3,923
Here:
3.5% of AGI
State:
3.3% of AGI
(% of AGI for various income ranges: 1.7% for AGIs below $10k, 2.1% for AGIs $10k-25k, 2.0% for AGIs $25k-50k, 2.8% for AGIs $50k-75k, 2.5% for AGIs $75k-100k, 2.2% for AGIs over 100k)
Total tax: $6,666 (reported on 78.2% of returns)
93614:
$6,666
State:
$10,761
(% of AGI for various income ranges: 5.2% for AGIs below $10k, 4.3% for AGIs $10k-25k, 6.3% for AGIs $25k-50k, 8.2% for AGIs $50k-75k, 10.1% for AGIs $75k-100k, 15.7% for AGIs over 100k)
Earned income credit: $1,627 (reported on 10.8% of returns)
Here:
$1,627
State:
$1,763
Percentage of individuals using paid preparers for their 2004 taxes: 61.8%
Here:
62%
State:
66%
(% for various income ranges: 50.5% for AGIs below $10k, 57.9% for AGIs $10k-25k, 64.5% for AGIs $25k-50k, 64.4% for AGIs $50k-75k, 66.5% for AGIs $75k-100k, 73.7% for AGIs over 100k)
Likely homosexual households (counted as self-reported same-sex unmarried-partner households)
Lesbian couples: 0.0% of all households
Gay men: 0.3% of all households
Household received Food Stamps/SNAP in the past 12 months: 620 Household did not receive Food Stamps/SNAP in the past 12 months: 3,809
Women who had a birth in the past 12 months: 240 (86 now married, 156 unmarried) Women who did not have a birth in the past 12 months: 2,154 (1,232 now married, 906 unmarried)
Housing units in zip code 93614 with a mortgage: 2,709 (101 second mortgage, 73 both second mortgage and home equity loan) Houses without a mortgage: 35
Median monthly owner costs for units with a mortgage: $2,005 Median monthly owner costs for units without a mortgage: $649
Residents with income below the poverty level in 2022:
This zip code:
7.2%
Whole state:
12.2%
Residents with income below 50% of the poverty level in 2022:
This zip code:
5.3%
Whole state:
6.2%
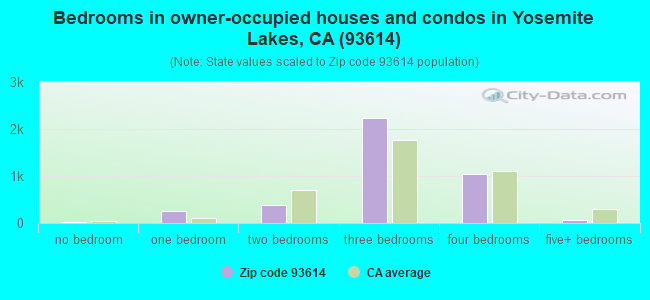
Median number of rooms in houses and condos:
Here:
6.2
State:
6.0
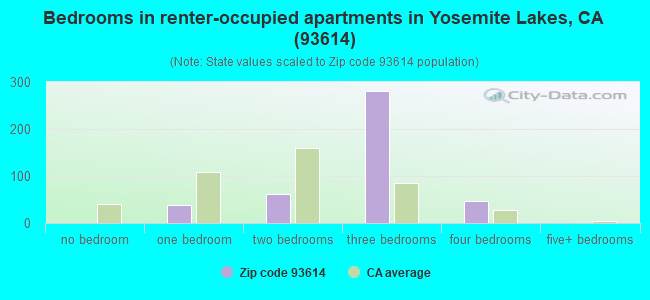
Median number of rooms in apartments:
Here:
4.8
State:
3.9
Notable locations in this zip code not listed on our city pages
Notable locations in zip code 93614: Veater Ranch (A), Twentytwo Mile House (B), Rosedale Ranch (C), Lewis Ranch (D), Kelshaw Corners (E), Coarse Gold Fire Station (F), Shaubach Ranch (G), Red Top Lookout (H), Ecker Ranch (I), Zebra Ranch (J), Yosemite South Camp (K), Yosemite Lakes Golf Course (L), Zebra Station (M), California Youth Authority Camp (N), Sierra Ambulance Service Coarsegold Station (O), Madera County Fire Department Station 10 Yosemite Lake Park Volunteer Fire Department (P), Department of Forestry and Fire Protection Coarsegold Station (Q), Madera County Fire Department Station 8 (R), Madera County Fire Department Station 13 Coarsegold Volunteer Fire Department (S). Display/hide their locations on the map
1,488 married couples with children.
438 single-parent households (266 men, 172 women).
93.0% of residents of 93614 zip code speak English at home.
4.9% of residents speak Spanish at home (82% very well, 11% well, 5% not well, 2% not at all).
1.6% of residents speak other Indo-European language at home (87% very well, 13% well).
0.3% of residents speak Asian or Pacific Island language at home (100% well).
0.3% of residents speak other language at home (100% very well).
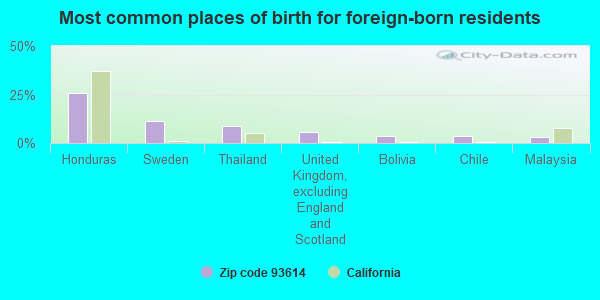
Foreign born population: 493 (4.2%) (70.0% of them are naturalized citizens)
This zip code:
4.2%
Whole state:
26.7%
26%Honduras
12%Sweden
9%Thailand
5%United Kingdom, excluding England and Scotland
4%Bolivia
4%Chile
3%Malaysia
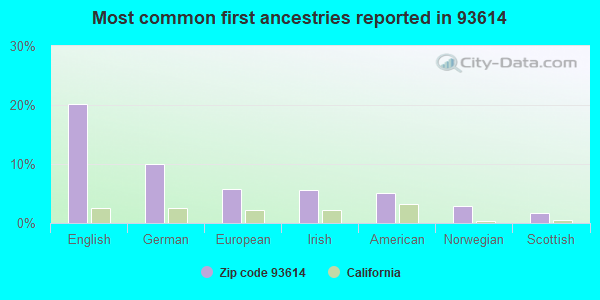
20%English
10%German
6%European
6%Irish
5%American
3%Norwegian
2%Scottish
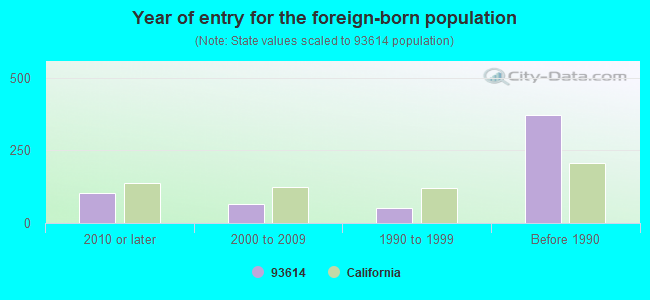
Year of entry for the foreign-born population
1042010 or later
642000 to 2009
511990 to 1999
372Before 1990
Facilities with environmental interests located in this zip code:
FOOTHILL HIGH (ALTER.) (43875 PATRICK AVE. in COARSEGOLD, CA)
(National Center for Education Statistics) - STATE ID-2030088 Organizations: YOSEMITE JOINT UNION HIGH (SCHOOL DISTRICT)
MEADOWBROOK COMMUNITY DAY SCHOOL (45426 ROAD 415 in COARSEGOLD, CA)
(National Center for Education Statistics) - STATE ID-6113914 Organizations: COARSEGOLD UNION ELEMENTARY (SCHOOL DISTRICT)
CHAWANAKEE HOME STUDY (ALT) (28420 YOSEMITE SPRING PKWY. in COARSEGOLD, CA)
(National Center for Education Statistics) - STATE ID-6114862 Organizations: CHAWANAKEE JOINT UNIFIED (SCHOOL DISTRICT)
CHUKCHANSI GOLD RESORT&CASINO (711 LUCKY LANE in COARSEGOLD, CA) . Tribal Land
National Pollutant Discharge Elimination System NON-MAJOR (Tracking pollutant discharge elimination systems) - permit Business SIC classification: HOTELS AND MOTELS Organizations: PICAYUNE RANCH OF THE (CONTACT/OWNER)
Alternative names: PICAYUNE RNCH-CHUKCHANSI INDNS
MYERS J W INC CHEVRON JOBBER (35888 HWY 41 in COARSEGOLD, CA)
TRANSPORTER (Resource Conservation and Recovery Act (tracking hazardous waste)) - notification Organizations: JAMES W & KAREN S MYERS (CONTACT/OWNER)
Housing units lacking complete plumbing facilities: 0.0% Housing units lacking complete kitchen facilities: 0.7%
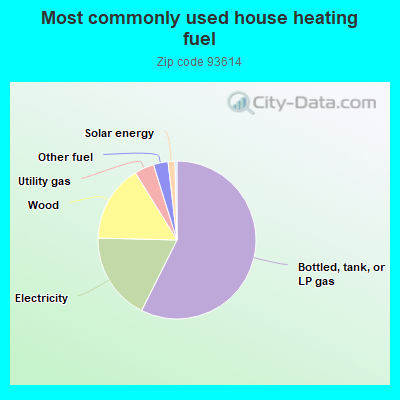
57.4%Bottled, tank, or LP gas
18.0%Electricity
15.8%Wood
4.0%Utility gas
3.0%Other fuel
1.4%Solar energy
Population in 1990: 6,950. Population change in the 1990s: +2,441 (+35.1%).
Place of birth for U.S.-born residents:
This state: 8,040
Northeast: 402
Midwest: 1,074
South: 516
West: 950
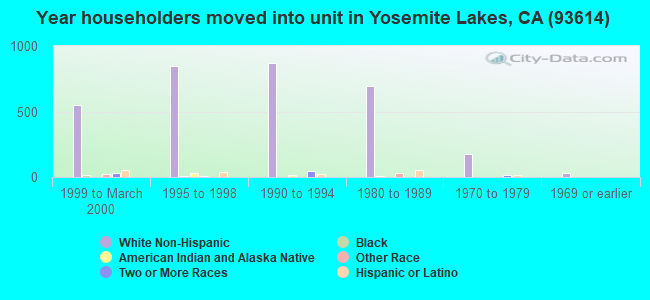
60% of the 93614 zip code residents lived in the same house 5 years ago. Out of people who lived in different houses, 34% lived in this county. Out of people who lived in different counties, 50% lived in California.
91% of the 93614 zip code residents lived in the same house 1 year ago. Out of people who lived in different houses, 34% moved from this county. Out of people who lived in different houses, 60% moved from different county within same state. Out of people who lived in different houses, 6% moved from different state. Out of people who lived in different houses, 3% moved from abroad.
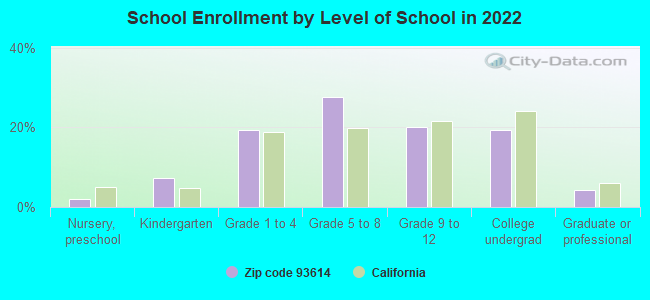
Private vs. public school enrollment:
Students in private schools in grades 1 to 8 (elementary and middle school): 213
Here:
18.9%
California:
10.5%
Students in private schools in grades 9 to 12 (high school): 37
Here:
7.9%
California:
8.5%
Students in private undergraduate colleges: 96
Here:
21.0%
California:
15.9%
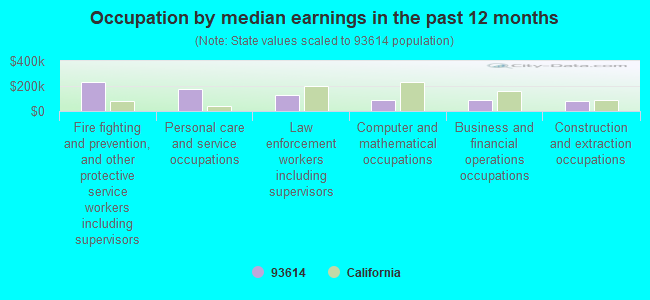
Occupation by median earnings in the past 12 months ($)
235,137Fire fighting and prevention, and other protective service workers including supervisors
175,830Personal care and service occupations
131,246Law enforcement workers including supervisors
90,424Computer and mathematical occupations
89,257Business and financial operations occupations
80,069Construction and extraction occupations
Companies with federal contracts located in this zip code:
BERKLEY R POWELL, M D (37024 MUDGE RANCH ROAD in COARSEGOLD, CA; small business) : $138,888 in 11 contractsfrom 1999 to 2006
Contracts for Maintenance, Repair and Rebuilding of Equipment -- Medical, Dental, and Veterinary Equipment and Supplies, Psychiatry Services, Pediatric Services by Army Signed by year:2000: $0; 2001: $25,320; 2002: $25,320; 2003: $4,040; 2004: $17,678; 2005: $16,720; 2006: $20,194.
Biggest contracts:
$29,970 with Army for Maintenance, Repair and Rebuilding of Equipment -- Medical, Dental, and Veterinary Equipment and Supplies. Taking place in HI. Signed on 2003-11-17. Completion date: 2002-09-30.
$29,616 with Army for Psychiatry Services. Taking place in HI. Signed on 1999-11-02. Completion date: 2000-09-30.
$28,418 with Army for Maintenance, Repair and Rebuilding of Equipment -- Medical, Dental, and Veterinary Equipment and Supplies. Taking place in HI. Signed on 2004-10-29. Completion date: 2002-09-30.
$25,320, same as above.Signed on 2002-11-06. Completion date: 2002-09-30.
BOHNA ARENA (44777 RODEO GROUNDS LN in COARSEGOLD, CA; small business) : $36,750 in 3 contractsin 2005
$15,750 with Army for Landscaping/Groundskeeping Services. Signed on 2005-05-24. Completion date: 2005-03-07.
$10,500, same as above.Signed on 2005-03-03. Completion date: 2005-03-07.
$10,500 with U.S. Army Corps of Engineers - civil program financing only for Landscaping/Groundskeeping Services. Signed on 2005-03-03. Completion date: 2005-03-07.
Top industries in this zip code by the number of employees in 2005:
Construction: Drywall and Insulation Contractors (100-249 employees: 1 establishment)
Construction: Commercial and Institutional Building Construction (20-49: 2)
Construction: All Other Specialty Trade Contractors (20-49: 1, 1-4: 2)
Construction: Plumbing, Heating, and Air-Conditioning Contractors (20-49: 1)
Other Services (except Public Administration): Other Similar Organizations (except Business, Professional, Labor, and Political Organizations) (20-49: 1)
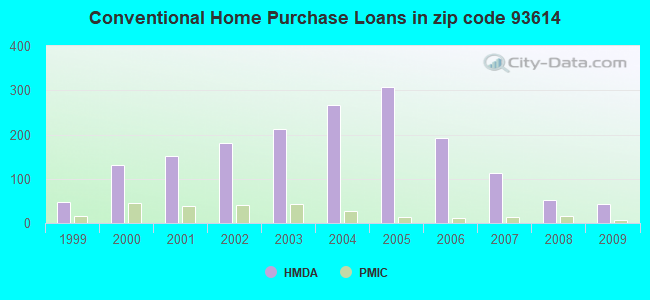
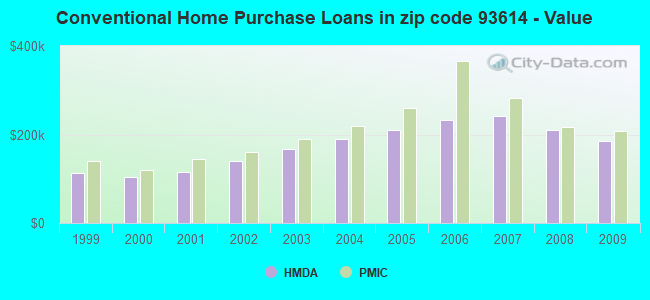
Detailed PMIC statistics for the following Tracts:0001.05
2006 - 2018 National Fire Incident Reporting System (NFIRS) incidents
According to the data from the years 2006 - 2018 the average number of fire incidents per year is 39. The highest number of fires - 61 took place in 2013, and the least - 11 in 2006. The data has a rising trend.
When looking into fire subcategories, the most reports belonged to: Outside Fires (60.2%), and Structure Fires (18.8%).
Fire incident types reported to NFIRS in Zip Code 93614


 Nearest zip codes: 93645, 93626, 93601, 93653, 93644, 93669.


 According to the data from the years 2006 - 2018 the average number of fire incidents per year is 39. The highest number of fires - 61 took place in 2013, and the least - 11 in 2006. The data has a rising trend.
 When looking into fire subcategories, the most reports belonged to: Outside Fires (60.2%), and Structure Fires (18.8%).