Estimated zip code population in 2022: 31,251 Zip code population in 2010: 31,615 Zip code population in 2000: 32,840
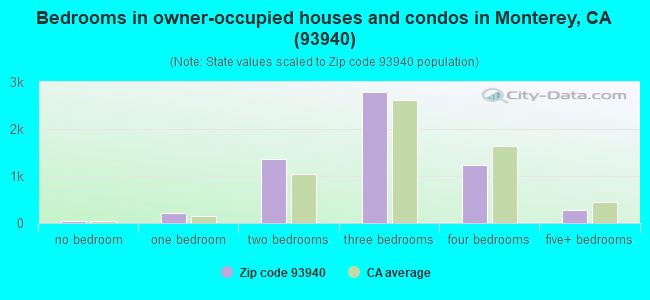
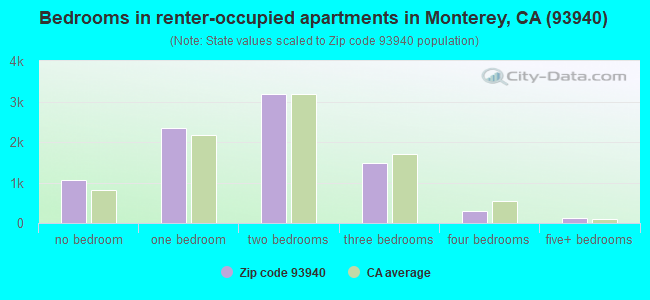
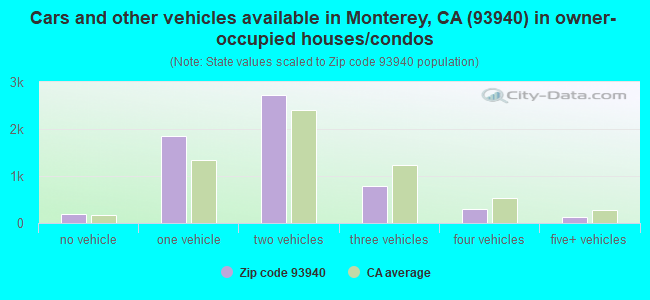
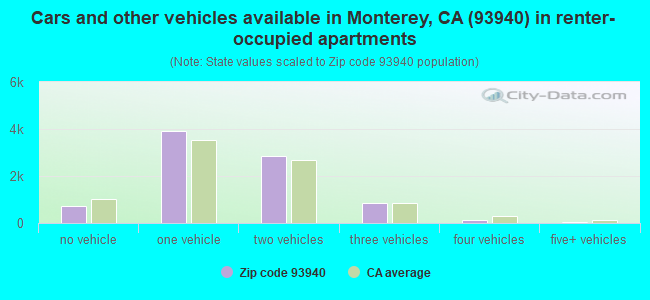
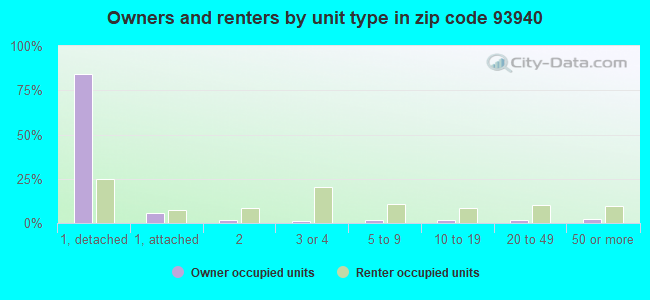
Houses and condos: 16,005 Renter-occupied apartments: 8,479
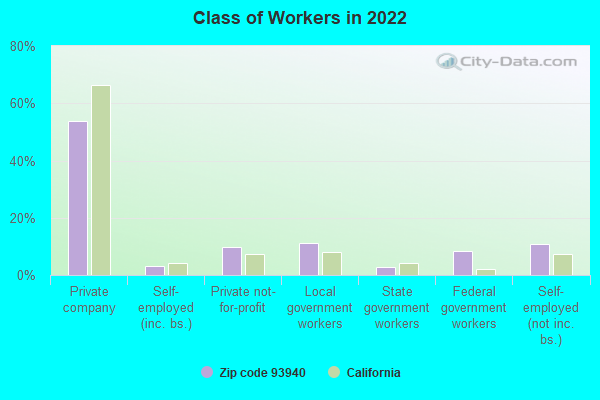
% of renters here:
59%
State:
44%
March 2022 cost of living index in zip code 93940: 110.1 (more than average, U.S. average is 100)
Land area: 20.5 sq. mi. Water area: 0.7 sq. mi.
Population density: 1,522 people per square mile
(low).
OSM Map
General Map
Google Map
MSN Map
OSM Map
General Map
Google Map
MSN Map
OSM Map
General Map
Google Map
MSN Map
OSM Map
General Map
Google Map
MSN Map
Please wait while loading the map...
Real estate property taxes paid for housing units in 2022:
This zip code:
0.6% ($6,259)
California:
0.7% ($4,831)
Median real estate property taxes paid for housing units with mortgages in 2022: $6,889 (0.7%) Median real estate property taxes paid for housing units with no mortgage in 2022: $4,696 (0.4%)
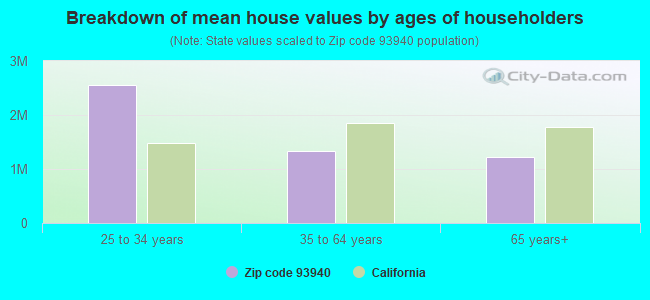
Estimated median house/condo value in 2022: $1,042,849
93940:
$1,042,849
California:
$715,900
According to our research of California and other state lists, there were 33 registered sex offenders living in 93940 zip code as of April 26, 2024. The ratio of all residents to sex offenders in zip code 93940 is 1,006 to 1. The ratio of registered sex offenders to all residents in this zip code is lower than the state average.
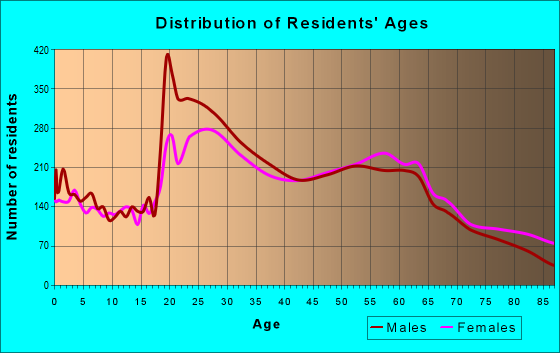
Median resident age:
This zip code:
42.7 years
California median age:
37.9 years
Average household size:
This zip code:
2.1 people
California:
2.8 people
Averages for the 2020 tax year for zip code 93940, filed in 2021:
Average Adjusted Gross Income (AGI) in 2020: $101,764 (Individual Income Tax Returns)
Here:
$101,764
State:
$95,910
Salary/wage: $76,769 (reported on 75.0% of returns)
Here:
$76,769
State:
$77,331
(% of AGI for various income ranges: 1226.5% for AGIs below $25k, 4073.2% for AGIs $25k-50k, 7415.6% for AGIs $50k-75k, 10145.3% for AGIs $75k-100k, 20282.5% for AGIs $100k-200k, 90413.4% for AGIs over 200k)
Taxable interest for individuals: $2,664 (reported on 42.3% of returns)
This zip code:
$2,664
California:
$2,294
(% of AGI for various income ranges: 39.2% for AGIs below $25k, 40.2% for AGIs $25k-50k, 61.3% for AGIs $50k-75k, 110.7% for AGIs $75k-100k, 344.9% for AGIs $100k-200k, 2778.1% for AGIs over 200k)
Ordinary dividends: $10,723 (reported on 31.6% of returns)
Here:
$10,723
State:
$10,949
(% of AGI for various income ranges: 81.9% for AGIs below $25k, 101.4% for AGIs $25k-50k, 184.7% for AGIs $50k-75k, 311.0% for AGIs $75k-100k, 884.8% for AGIs $100k-200k, 9310.9% for AGIs over 200k)
Net capital gain/loss in AGI: +$34,218 (reported on 30.3% of returns)
Here:
+$34,218
State:
+$49,306
(% of AGI for various income ranges: 34.4% for AGIs below $25k, 69.3% for AGIs $25k-50k, 182.7% for AGIs $50k-75k, 252.2% for AGIs $75k-100k, 1129.4% for AGIs $100k-200k, 41357.2% for AGIs over 200k)
Profit/loss from business: +$23,200 (reported on 19.0% of returns)
Here:
+$23,200
State:
+$15,671
(% of AGI for various income ranges: 198.4% for AGIs below $25k, 261.1% for AGIs $25k-50k, 295.9% for AGIs $50k-75k, 471.8% for AGIs $75k-100k, 1092.3% for AGIs $100k-200k, 10613.1% for AGIs over 200k)
Taxable individual retirement arrangement distribution: $26,016 (reported on 11.5% of returns)
93940:
$26,016
California:
$23,505
(% of AGI for various income ranges: 76.6% for AGIs below $25k, 107.4% for AGIs $25k-50k, 224.2% for AGIs $50k-75k, 417.8% for AGIs $75k-100k, 1139.4% for AGIs $100k-200k, 5929.1% for AGIs over 200k)
Self-employed (Keogh) retirement plans: $26,761 (reported on 1.6% of returns)
93940:
$26,761
California:
$30,163
(% of AGI for various income ranges: 13.1% for AGIs below $25k, 28.4% for AGIs $50k-75k, 101.0% for AGIs $100k-200k, 1324.4% for AGIs over 200k)
Total itemized deductions: $39,599 (reported on 17.9% of returns)
Here:
$39,599
State:
$39,517
(% of AGI for various income ranges: 207.5% for AGIs below $25k, 301.6% for AGIs $25k-50k, 517.1% for AGIs $50k-75k, 993.6% for AGIs $75k-100k, 2574.2% for AGIs $100k-200k, 14327.2% for AGIs over 200k)
Charity contributions: $11,113 (reported on 14.9% of returns)
Here:
$11,113
State:
$12,598
(% of AGI for various income ranges: 8.5% for AGIs below $25k, 24.6% for AGIs $25k-50k, 49.2% for AGIs $50k-75k, 123.8% for AGIs $75k-100k, 351.5% for AGIs $100k-200k, 5485.3% for AGIs over 200k)
Taxes paid: $8,484 (reported on 17.9% of returns)
93940:
$8,484
State:
$8,807
(% of AGI for various income ranges: 38.8% for AGIs below $25k, 59.4% for AGIs $25k-50k, 120.5% for AGIs $50k-75k, 261.5% for AGIs $75k-100k, 677.5% for AGIs $100k-200k, 2440.6% for AGIs over 200k)
Earned income credit: $1,263 (reported on 7.1% of returns)
Here:
$1,263
State:
$2,074
(% of AGI for various income ranges: 42.8% for AGIs below $25k, 27.7% for AGIs $25k-50k)
Percentage of individuals using paid preparers for their 2020 taxes: 92.5%
Here:
93%
State:
92%
(% for various income ranges: 89.4% for AGIs below $25k, 93.3% for AGIs $25k-50k, 93.6% for AGIs $50k-75k, 93.1% for AGIs $75k-100k, 93.2% for AGIs $100k-200k, 94.4% for AGIs over 200k)
Averages for the 2012 tax year for zip code 93940, filed in 2013:
Average Adjusted Gross Income (AGI) in 2012: $85,529 (Individual Income Tax Returns)
Here:
$85,529
State:
$72,726
Salary/wage: $61,721 (reported on 77.5% of returns)
Here:
$61,721
State:
$59,079
(% of AGI for various income ranges: 69.7% for AGIs below $25k, 76.7% for AGIs $25k-50k, 76.2% for AGIs $50k-75k, 71.2% for AGIs $75k-100k, 63.6% for AGIs $100k-200k, 34.1% for AGIs over 200k)
Taxable interest for individuals: $3,009 (reported on 44.9% of returns)
This zip code:
$3,009
California:
$2,146
(% of AGI for various income ranges: 1.9% for AGIs below $25k, 1.2% for AGIs $25k-50k, 0.8% for AGIs $50k-75k, 1.3% for AGIs $75k-100k, 1.4% for AGIs $100k-200k, 2.1% for AGIs over 200k)
Ordinary dividends: $9,000 (reported on 29.9% of returns)
Here:
$9,000
State:
$9,308
(% of AGI for various income ranges: 3.5% for AGIs below $25k, 1.8% for AGIs $25k-50k, 1.7% for AGIs $50k-75k, 2.2% for AGIs $75k-100k, 2.9% for AGIs $100k-200k, 4.3% for AGIs over 200k)
Net capital gain/loss in AGI: +$32,864 (reported on 26.2% of returns)
Here:
+$32,864
State:
+$30,460
(% of AGI for various income ranges: 0.5% for AGIs $25k-50k, 0.6% for AGIs $50k-75k, 0.9% for AGIs $75k-100k, 2.0% for AGIs $100k-200k, 24.0% for AGIs over 200k)
Profit/loss from business: +$25,657 (reported on 19.1% of returns)
Here:
+$25,657
State:
+$17,064
(% of AGI for various income ranges: 11.3% for AGIs below $25k, 6.3% for AGIs $25k-50k, 3.7% for AGIs $50k-75k, 4.4% for AGIs $75k-100k, 5.0% for AGIs $100k-200k, 6.5% for AGIs over 200k)
Taxable individual retirement arrangement distribution: $18,472 (reported on 11.9% of returns)
93940:
$18,472
California:
$19,557
(% of AGI for various income ranges: 2.7% for AGIs below $25k, 2.1% for AGIs $25k-50k, 1.9% for AGIs $50k-75k, 2.4% for AGIs $75k-100k, 3.5% for AGIs $100k-200k, 2.4% for AGIs over 200k)
Self-employment retirement plans: $22,826 (reported on 1.6% of returns)
93940:
$22,826
California:
$24,530
(% of AGI for various income ranges: 0.2% for AGIs below $25k, 0.1% for AGIs $50k-75k, 0.3% for AGIs $75k-100k, 0.5% for AGIs $100k-200k, 0.7% for AGIs over 200k)
Total itemized deductions: $36,527 (23% of AGI, reported on 38.3% of returns)
Here:
$36,527
State:
$34,004
Here:
22.7% of AGI
State:
22.7% of AGI
(% of AGI for various income ranges: 18.6% for AGIs below $25k, 10.3% for AGIs $25k-50k, 13.3% for AGIs $50k-75k, 14.5% for AGIs $75k-100k, 18.6% for AGIs $100k-200k, 17.7% for AGIs over 200k)
Charity contributions: $4,450 (reported on 32.1% of returns)
Here:
$4,450
State:
$4,659
(% of AGI for various income ranges: 0.8% for AGIs below $25k, 0.8% for AGIs $25k-50k, 1.4% for AGIs $50k-75k, 1.5% for AGIs $75k-100k, 2.0% for AGIs $100k-200k, 1.9% for AGIs over 200k)
Taxes paid: $14,258 (reported on 38.0% of returns)
93940:
$14,258
State:
$14,448
(% of AGI for various income ranges: 3.0% for AGIs below $25k, 2.2% for AGIs $25k-50k, 3.3% for AGIs $50k-75k, 4.7% for AGIs $75k-100k, 7.0% for AGIs $100k-200k, 8.7% for AGIs over 200k)
Earned income credit: $1,442 (reported on 8.9% of returns)
Here:
$1,442
State:
$2,286
(% of AGI for various income ranges: 2.5% for AGIs below $25k, 0.5% for AGIs $25k-50k)
Percentage of individuals using paid preparers for their 2012 taxes: 56.6%
Here:
57%
State:
64%
(% for various income ranges: 51.4% for AGIs below $25k, 53.2% for AGIs $25k-50k, 53.1% for AGIs $50k-75k, 58.1% for AGIs $75k-100k, 65.2% for AGIs $100k-200k, 81.7% for AGIs over 200k)
Averages for the 2004 tax year for zip code 93940, filed in 2005:
Average Adjusted Gross Income (AGI) in 2004: $71,548 (Individual Income Tax Returns)
Here:
$71,548
State:
$58,600
Salary/wage: $52,484 (reported on 77.0% of returns)
Here:
$52,484
State:
$49,455
(% of AGI for various income ranges: 70.4% for AGIs $10k-25k, 78.5% for AGIs $25k-50k, 74.7% for AGIs $50k-75k, 72.1% for AGIs $75k-100k, 41.0% for AGIs over 100k)
Taxable interest for individuals: $4,007 (reported on 55.0% of returns)
This zip code:
$4,007
California:
$2,365
(% of AGI for various income ranges: 3.2% for AGIs $10k-25k, 2.2% for AGIs $25k-50k, 2.2% for AGIs $50k-75k, 2.0% for AGIs $75k-100k, 3.4% for AGIs over 100k)
Taxable dividends: $4,740 (reported on 35.1% of returns)
Here:
$4,740
State:
$4,746
(% of AGI for various income ranges: 2.6% for AGIs $10k-25k, 1.9% for AGIs $25k-50k, 1.7% for AGIs $50k-75k, 2.0% for AGIs $75k-100k, 2.4% for AGIs over 100k)
Net capital gain/loss: +$46,516 (reported on 30.4% of returns)
Here:
+$46,516
State:
+$23,418
(% of AGI for various income ranges: 0.2% for AGIs $10k-25k, 0.8% for AGIs $25k-50k, 1.1% for AGIs $50k-75k, 2.0% for AGIs $75k-100k, 33.2% for AGIs over 100k)
Profit/loss from business: +$23,378 (reported on 19.7% of returns)
Here:
+$23,378
State:
+$16,826
(% of AGI for various income ranges: 8.9% for AGIs $10k-25k, 5.2% for AGIs $25k-50k, 4.8% for AGIs $50k-75k, 5.4% for AGIs $75k-100k, 7.0% for AGIs over 100k)
IRA payment deduction: $3,333 (reported on 3.9% of returns)
93940:
$3,333
California:
$3,192
(% of AGI for various income ranges: 0.3% for AGIs $10k-25k, 0.3% for AGIs $25k-50k, 0.2% for AGIs $50k-75k, 0.3% for AGIs $75k-100k, 0.1% for AGIs over 100k)
Self-employed pension: $18,874 (reported on 2.4% of returns)
Here:
$18,874
California:
$17,688
(% of AGI for various income ranges: 0.2% for AGIs $25k-50k, 0.2% for AGIs $50k-75k, 0.5% for AGIs $75k-100k, 0.9% for AGIs over 100k)
Total itemized deductions: $30,326 (22% of AGI, reported on 38.7% of returns)
Here:
$30,326
State:
$28,113
Here:
22.2% of AGI
State:
25.3% of AGI
(% of AGI for various income ranges: 16.0% for AGIs $10k-25k, 13.6% for AGIs $25k-50k, 15.5% for AGIs $50k-75k, 19.2% for AGIs $75k-100k, 16.1% for AGIs over 100k)
Charity contributions deductions: $4,879 (3% of AGI, reported on 34.1% of returns)
Here:
$4,879
State:
$3,923
Here:
3.3% of AGI
State:
3.3% of AGI
(% of AGI for various income ranges: 1.2% for AGIs $10k-25k, 1.3% for AGIs $25k-50k, 1.7% for AGIs $50k-75k, 2.2% for AGIs $75k-100k, 2.8% for AGIs over 100k)
Total tax: $12,524 (reported on 83.7% of returns)
93940:
$12,524
State:
$10,761
(% of AGI for various income ranges: 5.6% for AGIs $10k-25k, 8.8% for AGIs $25k-50k, 10.5% for AGIs $50k-75k, 11.4% for AGIs $75k-100k, 18.2% for AGIs over 100k)
Earned income credit: $1,214 (reported on 6.6% of returns)
Here:
$1,214
State:
$1,763
Percentage of individuals using paid preparers for their 2004 taxes: 59.9%
Here:
60%
State:
66%
(% for various income ranges: 55.4% for AGIs below $10k, 57.5% for AGIs $10k-25k, 55.7% for AGIs $25k-50k, 58.4% for AGIs $50k-75k, 63.8% for AGIs $75k-100k, 75.1% for AGIs over 100k)
Likely homosexual households (counted as self-reported same-sex unmarried-partner households)
Lesbian couples: 0.1% of all households
Gay men: 0.1% of all households
Household received Food Stamps/SNAP in the past 12 months: 1,001 Household did not receive Food Stamps/SNAP in the past 12 months: 13,247
Women who had a birth in the past 12 months: 356 (354 now married, 0 unmarried) Women who did not have a birth in the past 12 months: 6,754 (2,765 now married, 3,985 unmarried)
Housing units in zip code 93940 with a mortgage: 3,759 (475 second mortgage, 11 home equity loan, 384 both second mortgage and home equity loan) Houses without a mortgage: 117
Median monthly owner costs for units with a mortgage: $3,171 Median monthly owner costs for units without a mortgage: $883
Residents with income below the poverty level in 2022:
This zip code:
10.1%
Whole state:
12.2%
Residents with income below 50% of the poverty level in 2022:
This zip code:
6.4%
Whole state:
6.2%
Median number of rooms in houses and condos:
Here:
6.1
State:
6.0
Median number of rooms in apartments:
Here:
3.7
State:
3.9
Notable locations in this zip code not listed on our city pages
Notable locations in zip code 93940: Del Monte Golf Course (A), California Division of Forestry (B), Vizcaino-Serra Landing (C), Laguna Seca Golf Ranch (D), Retreat (E), Laguna Seca Race Track (F), Laguna Seca Ranger Station (G), Municipal Wharf Number 2 (H), Monterey Marina (I), Monterey Bay Aquarium (J), Fishermans Wharf (K), Coast Guard Pier (L), United States Navy Golf Course (M), Stokes Adobe (N), Monterey Youth Center (O), Monterey Public Library (P), Monterey County Courthouse and Government Center (Q), Monterey Bay Aquarium Library (R), Mayo Hayes O'Donnell Library (S), El Castillo (T). Display/hide their locations on the map
Churches in zip code 93940 include: Royal Presidio Chapel (A), Church of the Oaks (B), Living Hope Nazarene Church (C), Monterey Assembly of God Church (D), Bethlehem Lutheran Church of Monterey (E), Church of Christ (F), The Church of Jesus Christ of Latter Day Saints (G), Enchanted Angels Church (H), First Baptist Church (I). Display/hide their locations on the map
Parks in zip code 93940 include: Monterey State Beach (1), Monterey County Fairgrounds (2), Cannery Row Park Plaza (3), Custom House Plaza (4), Friendly Plaza (5), Portola Plaza (6), Dennis the Menace Playground (7), Fishermans Shoreline Park (8), Serra Monument (9). Display/hide their locations on the map
3,397 married couples with children.
542 single-parent households (247 men, 295 women).
75.4% of residents of 93940 zip code speak English at home.
12.6% of residents speak Spanish at home (67% very well, 13% well, 15% not well, 6% not at all).
7.0% of residents speak other Indo-European language at home (66% very well, 19% well, 10% not well, 5% not at all).
3.2% of residents speak Asian or Pacific Island language at home (72% very well, 16% well, 12% not well, 1% not at all).
1.9% of residents speak other language at home (78% very well, 22% well).
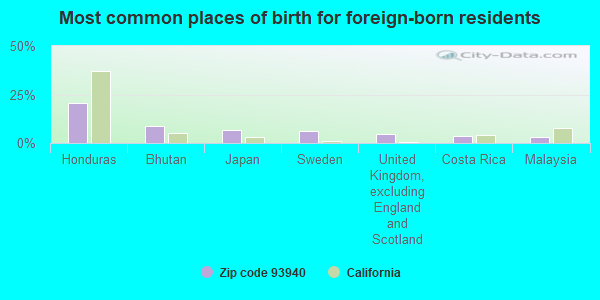
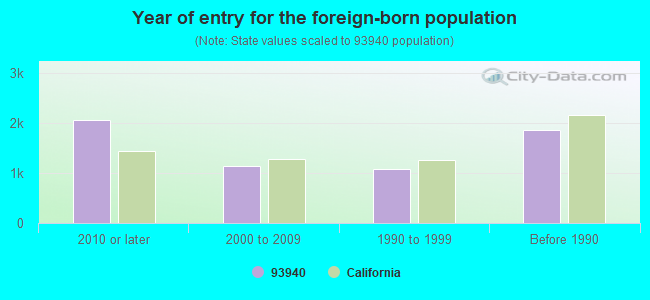
Foreign born population: 5,333 (17.1%) (51.7% of them are naturalized citizens)
Major facilities with environmental interests located in this zip code:
FORT ORD (HIGHWAY 1 in MONTEREY, CA) . Federal Facility. U.S. ARMY
SUPERFUND NPL (Superfund database) COMPLIANCE ACTIVITY (Tracking inspections of insecticide, fungicide, and rodenticide, and toxic substances) HAZARDOUS WASTE BIENNIAL REPORTER (Resource Conservation and Recovery Act (tracking hazardous waste)) Large Quantity Generators, more that 1000 kg of hazardous waste/month (Resource Conservation and Recovery Act (tracking hazardous waste)) TSD (Resource Conservation and Recovery Act (tracking hazardous waste)) Organizations: JEFFREY S. CAIRNS, COL., US ARMY (CONTACT/OPERATOR)
, U S ARMY (CONTACT/OWNER)
Alternative names: FORT ORD ARMY BASE, FORT ORD US ARMY, USARMY FORMER FORT ORD ARMY BASE, USARMY FORT ORD
J AND J AUTO BODY & PAINT (1105 AIRPORT RD in MONTEREY, CA)
STATE MASTER (California - Hazardous Waste Tracking) - HAZARDOU WASTE PROGRAM Small Quantity Generators, between 100 kg and 1000 kg of hazardous waste/month (Resource Conservation and Recovery Act (tracking hazardous waste)) Business NAICS classification: AUTOMOTIVE BODY, PAINT, AND INTERIOR REPAIR AND MAINTENANCE. Organizations: JAMES (CONTACT/OPERATOR)
, JAMES AND JIM (CONTACT/OWNER)
GUNTER MADSEN AUTO BODY (1231 DEL MONTE AVE in MONTEREY, CA)
STATE MASTER (California - Hazardous Waste Tracking) - HAZARDOU WASTE PROGRAM Small Quantity Generators, between 100 kg and 1000 kg of hazardous waste/month (Resource Conservation and Recovery Act (tracking hazardous waste)) - notification Business NAICS classification: AUTOMOTIVE BODY, PAINT, AND INTERIOR REPAIR AND MAINTENANCE. Organizations: A YAMADA/R SOUZA (CONTACT/OWNER)
JERRY GRAHAM AUTO BODY, INC (101 CALLE DEL OAKS in MONTEREY, CA)
STATE MASTER (California - Hazardous Waste Tracking) - HAZARDOU WASTE PROGRAM Small Quantity Generators, between 100 kg and 1000 kg of hazardous waste/month (Resource Conservation and Recovery Act (tracking hazardous waste)) - notification Business NAICS classification: AUTOMOTIVE BODY, PAINT, AND INTERIOR REPAIR AND MAINTENANCE.
CHEVRON STATION 91060 (351 FREMONT ST in MONTEREY, CA)
STATE MASTER (California - Hazardous Waste Tracking) - HAZARDOU WASTE PROGRAM CRITERIA AND HAZARDOUS AIR POLLUTANT INVENTORY (Inventory of air pollution sources) Small Quantity Generators, between 100 kg and 1000 kg of hazardous waste/month (Resource Conservation and Recovery Act (tracking hazardous waste)) - notification Business SIC classification: GASOLINE SERVICE STATIONS Organizations: CHEVRON PRODUCTS CO (CONTACT/OWNER)
Alternative names: CHEVRON STATION #91060
MONTEREY ADVANCED IMAGING CENTER (1010 CASS ST STE A1 in MONTEREY, CA) . Federal Facility
STATE MASTER (California - Hazardous Waste Tracking) - HAZARDOU WASTE PROGRAM Small Quantity Generators, between 100 kg and 1000 kg of hazardous waste/month (Resource Conservation and Recovery Act (tracking hazardous waste)) - notification Organizations: PACIFIC IMAGING SVCS (CONTACT/OWNER)
Alternative names: OPEN M R I ANNEX
EQUILON ENTERPRISES (1290 DEL MONTE in MONTEREY, CA) . Federal Facility
STATE MASTER (California - Hazardous Waste Tracking) - HAZARDOU WASTE PROGRAM Small Quantity Generators, between 100 kg and 1000 kg of hazardous waste/month (Resource Conservation and Recovery Act (tracking hazardous waste)) - notification Organizations: EQUILON ENTERPRISES, LLC (CONTACT/OWNER)
Alternative names: SHELL OIL CO
KOFMAN PAINTING AND DECORATING (212 HAWTHORNE in MONTEREY, CA)
STATE MASTER (California - Hazardous Waste Tracking) - HAZARDOU WASTE PROGRAM Small Quantity Generators, between 100 kg and 1000 kg of hazardous waste/month (Resource Conservation and Recovery Act (tracking hazardous waste)) - notification Organizations: GENE KOFMAN (CONTACT/OWNER)
LARKIN (THOMAS O.) (ELEM) (190 SEENO ST. in MONTEREY, CA)
(National Center for Education Statistics) - STATE ID-6026389 Organizations: MONTEREY PENINSULA UNIFIED (SCHOOL DISTRICT)
MONTE VISTA ELEMENTARY (251 SOLEDAD DR. in MONTEREY, CA)
(National Center for Education Statistics) - STATE ID-6026322 Organizations: MONTEREY PENINSULA UNIFIED (SCHOOL DISTRICT)
FOOTHILL ELEMENTARY (1700 VIA CASOLI in MONTEREY, CA)
(National Center for Education Statistics) - STATE ID-6026199 Organizations: MONTEREY PENINSULA UNIFIED (SCHOOL DISTRICT)
MONTEREY HIGH (101 HERRMANN DR. in MONTEREY, CA)
(National Center for Education Statistics) - STATE ID-2732808 Organizations: MONTEREY PENINSULA UNIFIED (SCHOOL DISTRICT)
A 1 RENT (2330 EDL MONTE AVE in MONTEREY, CA)
(Resource Conservation and Recovery Act (tracking hazardous waste)) Small Quantity Generators, between 100 kg and 1000 kg of hazardous waste/month (Resource Conservation and Recovery Act (tracking hazardous waste)) Business NAICS classification: ALL OTHER MISCELLANEOUS STORE RETAILERS (EXCEPT TOBACCO STORES). Organizations: A 1 RENTS (CONTACT/OWNER)
Alternative names: A-1 RENTS
Housing units lacking complete plumbing facilities: 0.3% Housing units lacking complete kitchen facilities: 1.5%
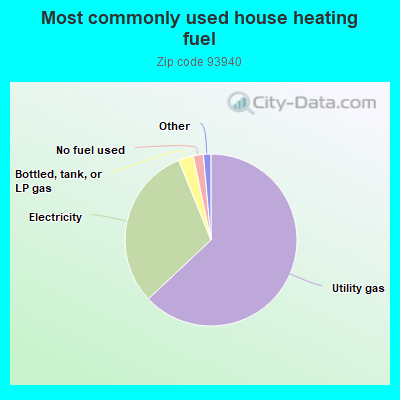
63.0%Utility gas
30.9%Electricity
2.8%Bottled, tank, or LP gas
1.9%No fuel used
Population in 1990: 35,326.
Place of birth for U.S.-born residents:
This state: 15,129
Northeast: 2,156
Midwest: 2,321
South: 2,889
West: 2,508
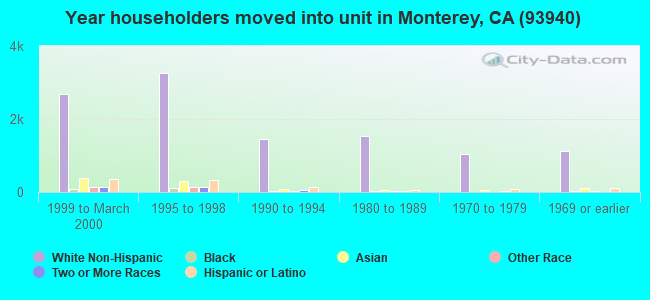
44% of the 93940 zip code residents lived in the same house 5 years ago. Out of people who lived in different houses, 41% lived in this county. Out of people who lived in different counties, 50% lived in California.
83% of the 93940 zip code residents lived in the same house 1 year ago. Out of people who lived in different houses, 34% moved from this county. Out of people who lived in different houses, 31% moved from different county within same state. Out of people who lived in different houses, 27% moved from different state. Out of people who lived in different houses, 9% moved from abroad.
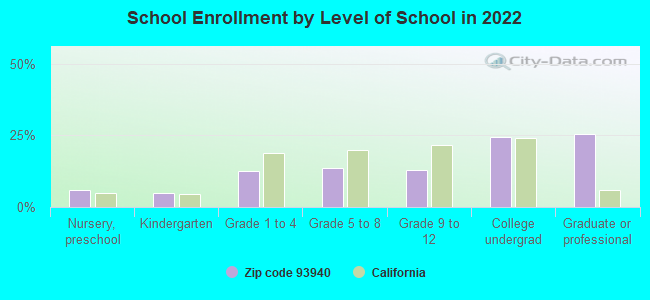
Private vs. public school enrollment:
Students in private schools in grades 1 to 8 (elementary and middle school): 352
Here:
20.7%
California:
10.5%
Students in private schools in grades 9 to 12 (high school): 224
Here:
27.2%
California:
8.5%
Students in private undergraduate colleges: 345
Here:
21.9%
California:
15.9%
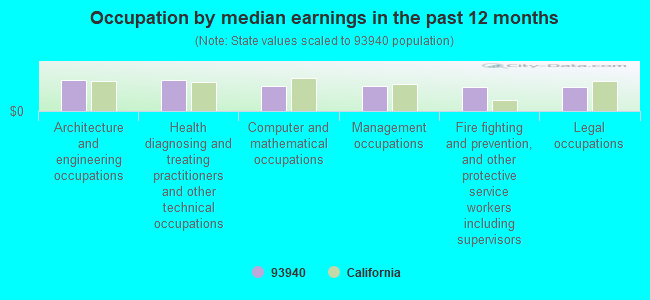
Occupation by median earnings in the past 12 months ($)
113,037Architecture and engineering occupations
111,333Health diagnosing and treating practitioners and other technical occupations
88,737Computer and mathematical occupations
88,280Management occupations
86,995Fire fighting and prevention, and other protective service workers including supervisors
85,980Legal occupations
Companies with biggest federal contracts located in this zip code:
CITY OF MONTEREY (LEAD AGENCY (CITY HALL, PACIFIC STREET in MONTEREY, CA) : $41,874,454 in 78 contractsfrom 2000 to 2006
Contracts for Facilities Operations Support Services, Trash/Garbage Collection Services - Including Portable Sanitation Services, Construction of Structures and Facilities -- Highways, Roads, Streets, Bridges, and Railways (includes resurfacing), Fire Protection Services, and moreby Army, Navy Signed by year:2000: $4,590,216; 2001: $8,457,657; 2002: $4,940,116; 2003: $6,222,312; 2004: $5,894,428; 2005: $9,021,372; 2006: $2,748,353.
Biggest contracts:
$5,000,000 with Army for Facilities Operations Support Services. Signed on 2005-02-28. Effective on 2005-02-14. Completion date: 2006-05-31.
$5,000,000, same as above.Signed on 2004-03-16. Completion date: 2005-05-31.
$4,051,031, same as above.Signed on 2003-06-24. Completion date: 2004-05-31.
$3,929,225, same as above.Signed on 2002-06-01. Completion date: 2003-05-31.
ROLANDS & ASSOCIATES CORPORATI (500 SLOAT AVENUE in MONTEREY, CA; small business) : $38,570,302 in 187 contractsfrom 1999 to 2006
Contracts for Defense Electronics and Communication Equipment -- Advanced Development (R&D), Automated Information System Design and Integration Services, ADP Systems Development Services, Other ADP and Telecommunications Services (includes data storage on tapes, compact disks, etc.), and moreby Navy, Army, Federal Technology Service, Air Force, and others Signed by year:2000: $7,392,920; 2001: $2,902,283; 2002: $1,926,935; 2003: $1,799,302; 2004: $2,788,908; 2005: $9,538,015; 2006: $11,369,700.
Biggest contracts:
$2,116,998 with Navy for Defense Electronics and Communication Equipment -- Advanced Development (R&D). Signed on 2005-09-06. Completion date: 2005-12-31.
$2,093,695 with Navy for Automated Information System Design and Integration Services. Signed on 2000-05-22. Completion date: 2001-05-21.
$2,017,691, same as above.Signed on 2000-02-01. Completion date: 2001-01-31.
$1,914,987 with Navy for Defense Electronics and Communication Equipment -- Advanced Development (R&D). Signed on 2006-06-16. Completion date: 2006-12-31.
MONTEREY TECHNOLOGIES, INC (24600 SILVER CLOUD COURT in MONTEREY, CA; small business) : $4,615,088 in 22 contractsfrom 1999 to 2006
Contracts for Aeronautics and Space Technology -- Basic Research (R&D), Defense Aircraft -- Applied Research and Exploratory Development (R&D), Other Research and Development -- Management and Support (R&D), Defense Aircraft -- Management and Support (R&D), and moreby NASA, Army, Air Force Signed by year:2000: $814,000; 2001: $1,110,632; 2002: $1,040,591; 2003: $799,915; 2004: $495,593; 2005: $128,000; 2006: $156,374.
Biggest contracts:
$500,000 with NASA for Aeronautics and Space Technology -- Basic Research (R&D). Signed on 2002-06-15. Completion date: 2002-10-15.
$445,600 with Army for Defense Aircraft -- Applied Research and Exploratory Development (R&D). Signed on 2004-11-09. Completion date: 2006-12-01.
$379,219 with Army for Other Research and Development -- Management and Support (R&D). Signed on 2001-04-06. Completion date: 2003-04-30.
$375,000 with Air Force for Other Research and Development -- Management and Support (R&D). Signed on 2000-04-26. Completion date: 2002-05-03.
CITY OF MONTEREY (MONTEREY FIRE DEPARTMENT in MONTEREY, CA) : $3,682,520 in 64 contractsfrom 2001 to 2006
Contracts for Trash/Garbage Collection Services - Including Portable Sanitation Services, Fire Protection Services, Other Utilities, Landscaping/Groundskeeping Services, and moreby Army, Navy Signed by year:2000: $0; 2001: $416,138; 2002: $1,339,863; 2003: $878,377; 2004: $434,505; 2005: $393,726; 2006: $219,911.
Biggest contracts:
$400,076 with Army for Trash/Garbage Collection Services - Including Portable Sanitation Services. Signed on 2002-05-30. Completion date: 2003-05-31.
$338,498, same as above.Signed on 2003-06-01. Completion date: 2004-05-31.
$310,466 with Navy for Trash/Garbage Collection Services - Including Portable Sanitation Services. Signed on 2001-10-01. Completion date: 2001-12-31.
$307,633 with Army for Fire Protection Services. Signed on 2005-02-10. Effective on 2005-02-01. Completion date: 2006-01-31.
MONTEREY REGIONAL WATER POLLUT (5 HARRIS CT BLDG D in MONTEREY, CA) : $1,598,796 in 12 contractsfrom 2002 to 2004
Contracts for Other Utilities by Army Signed by year:2000: $0; 2001: $0; 2002: $348,343; 2003: $684,395; 2004: $566,058; 2005: $0; 2006: $0.
Biggest contracts:
$375,014 with Army for Other Utilities. Signed on 2004-10-01. Completion date: 2005-09-30.
$343,762, same as above.Signed on 2003-10-01. Completion date: 2004-08-31.
$250,009, same as above.Signed on 2002-10-01. Completion date: 2003-05-30.
$147,501, same as above.Signed on 2004-10-01. Completion date: 2005-09-30.
PETE AGUILAR CONSTRUCTION (1598 MANOR RD in MONTEREY, CA; small business) : $1,344,929 in 27 contractsfrom 1999 to 2005
Contracts for Maintenance, Repair or Alteration of Real Property -- Miscellaneous Buildings, Maintenance, Repair or Alteration of Real Property -- Other Administrative Facilities and Service Buildings, Construction of Structures and Facilities -- Miscellaneous Buildings, Construction of Structures and Facilities -- Other Industrial Buildings, and moreby Agricultural Research Service (disused code), Minerals Management Service, Navy, Army, and others Signed by year:2000: $559,784; 2001: $263,000; 2002: $2,026; 2003: $400,530; 2004: $76,369; 2005: $39,703; 2006: $0.
Biggest contracts:
$466,000 with Agricultural Research Service (disused code) for Maintenance, Repair or Alteration of Real Property -- Miscellaneous Buildings. Signed on 2000-07-15. Completion date: 2000-12-15.
$260,000 with Agricultural Research Service (disused code) for Maintenance, Repair or Alteration of Real Property -- Other Administrative Facilities and Service Buildings. Signed on 2001-07-15. Completion date: 2001-12-15.
$128,305 with Minerals Management Service for Construction of Structures and Facilities -- Miscellaneous Buildings. Signed on 2003-08-15. Completion date: 2003-11-15.
$107,616 with Navy for Construction of Structures and Facilities -- Other Industrial Buildings. Signed on 2003-09-29. Completion date: 2003-12-12.
RUSSOS WHOLESALE PRODUCE (120 CALLE DEL OAKS PLACE in DEL REY OAKS, CA; small business) : $1,202,279 in 313 contractsfrom 2004 to 2006
Contracts for Fruits and Vegetables by Defense Logistics Agency Signed by year:2000: $0; 2001: $0; 2002: $0; 2003: $0; 2004: $191,648; 2005: $622,855; 2006: $387,776.
Biggest contracts:
$8,401 with Defense Logistics Agency for Fruits and Vegetables. Signed on 2005-08-19. Completion date: 2005-08-19.
$8,240, same as above.Signed on 2006-05-19. Completion date: 2006-05-19.
$7,129, same as above.Signed on 2005-09-20. Completion date: 2005-09-20.
$6,708, same as above.Signed on 2005-05-20. Completion date: 2005-05-20.
MANAGEMENT ASSISTANCE AND CONCEPTS CORPORATION (203 A CALLE DEL OAKS in MONTEREY, CA) 100 employees, $5700000 revenue. Woman Owned Business: $1,113,007 in 5 contractsfrom 2000 to 2003
Contracts for Other ADP and Telecommunications Services (includes data storage on tapes, compact disks, etc.), ADP Systems Development Services by Federal Technology Service Signed by year:2000: $161,000; 2001: $244,000; 2002: $369,000; 2003: $339,007; 2004: $0; 2005: $0; 2006: $0.
Biggest contracts:
$369,000 with Federal Technology Service for Other ADP and Telecommunications Services (includes data storage on tapes, compact disks, etc.). Signed on 2002-06-15. Completion date: 2003-06-15.
$329,804 with Federal Technology Service for ADP Systems Development Services. Taking place in HI. Signed on 2003-10-28. Completion date: 2003-11-30.
$244,000 with Federal Technology Service for Other ADP and Telecommunications Services (includes data storage on tapes, compact disks, etc.). Signed on 2001-07-15. Completion date: 2002-06-15.
$161,000, same as above.Signed on 2000-06-15. Completion date: 2001-06-15.
NELSON MILLER RESEARCH INC (8 HARRIS CT STE C6 in MONTEREY, CA; small business) : $755,414 in 27 contractsfrom 2000 to 2005
Contracts for Health Services -- Applied Research and Exploratory Development (R&D), Laboratory Testing Services, Pressure, Temperature, and Humidity Measuring and Controlling Instruments, Laboratory Equipment and Supplies, and moreby Centers for Disease Control and Prevention, Army, Occupational Safety and Health Administration, NASA, and others Signed by year:2000: $128,400; 2001: $136,580; 2002: $206,950; 2003: $194,000; 2004: $18,945; 2005: $70,539; 2006: $0.
Biggest contracts:
$103,150 with Centers for Disease Control and Prevention for Health Services -- Applied Research and Exploratory Development (R&D). Signed on 2003-03-15. Completion date: 2003-07-15.
$66,000 with Centers for Disease Control and Prevention for Laboratory Testing Services. Signed on 2002-04-15. Completion date: 2002-05-15.
$55,000 with Centers for Disease Control and Prevention for Pressure, Temperature, and Humidity Measuring and Controlling Instruments. Taking place in PA. Signed on 2000-09-15. Completion date: 2000-09-15.
$48,120 with Army for Laboratory Equipment and Supplies. Signed on 2005-04-20. Completion date: 2005-06-13.
DEL MONTE AVIATION LP (100 SKYPARK DR in MONTEREY, CA; small business)
$735,420 with Defense Logistics Agency for Liquid Propellants and Fuels, Petroleum Base. Signed on 2000-02-17. Completion date: 2003-03-31.
Top industries in this zip code by the number of employees in 2005:
2002 - 2018 National Fire Incident Reporting System (NFIRS) incidents
Based on the data from the years 2002 - 2018 the average number of fires per year is 87. The highest number of fires - 137 took place in 2007, and the least - 0 in 2003. The data has a growing trend.
When looking into fire subcategories, the most reports belonged to: Outside Fires (43.7%), and Structure Fires (36.2%).
Fire incident types reported to NFIRS in Zip Code 93940
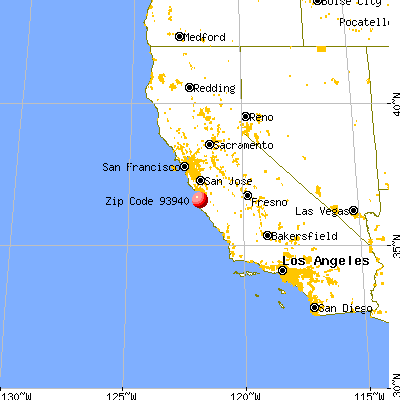


 Nearest zip codes: 93943, 93955, 93921, 93950, 93953, 93933.
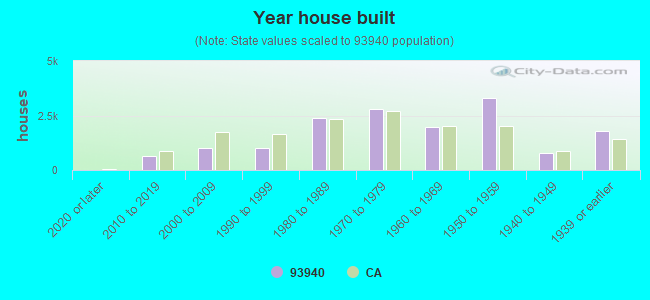


 . Federal Facility. U.S. ARMY
 Based on the data from the years 2002 - 2018 the average number of fires per year is 87. The highest number of fires - 137 took place in 2007, and the least - 0 in 2003. The data has a growing trend.
 When looking into fire subcategories, the most reports belonged to: Outside Fires (43.7%), and Structure Fires (36.2%).