Estimated zip code population in 2022: 14,972 Zip code population in 2010: 15,046 Zip code population in 2000: 15,436
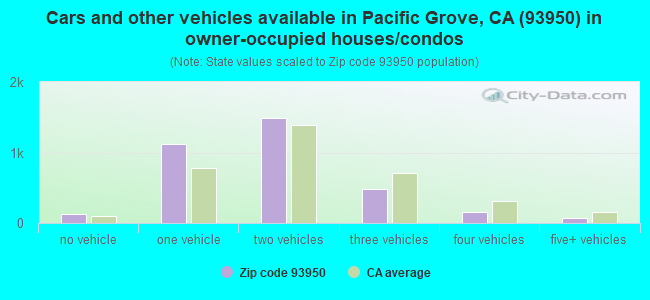
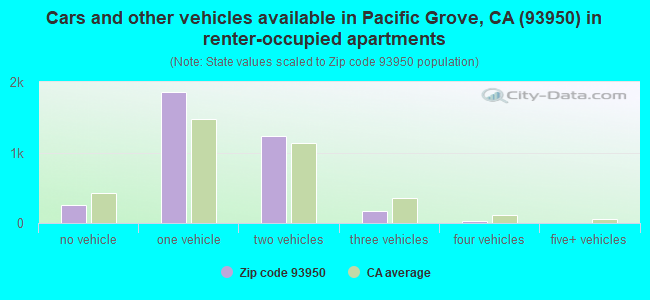
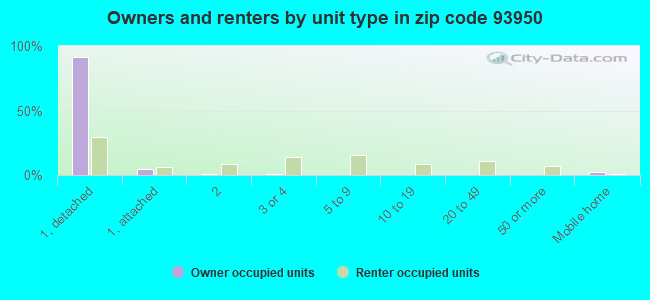
Houses and condos: 8,451 Renter-occupied apartments: 3,550
% of renters here:
51%
State:
44%
March 2022 cost of living index in zip code 93950: 111.6 (more than average, U.S. average is 100)
Land area: 2.9 sq. mi. Water area: 0.6 sq. mi.
Population density: 5,225 people per square mile
(average).
OSM Map
General Map
Google Map
MSN Map
OSM Map
General Map
Google Map
MSN Map
OSM Map
General Map
Google Map
MSN Map
OSM Map
General Map
Google Map
MSN Map
Please wait while loading the map...
Real estate property taxes paid for housing units in 2022:
This zip code:
0.6% ($6,552)
California:
0.7% ($4,831)
Median real estate property taxes paid for housing units with mortgages in 2022: $7,957 (0.7%) Median real estate property taxes paid for housing units with no mortgage in 2022: $4,910 (0.4%)
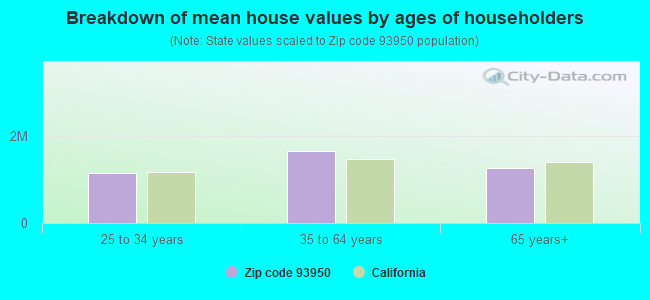
Estimated median house/condo value in 2022: $1,150,891
93950:
$1,150,891
California:
$715,900
According to our research of California and other state lists, there were 9 registered sex offenders living in 93950 zip code as of April 27, 2024. The ratio of all residents to sex offenders in zip code 93950 is 1,756 to 1. The ratio of registered sex offenders to all residents in this zip code is lower than the state average.
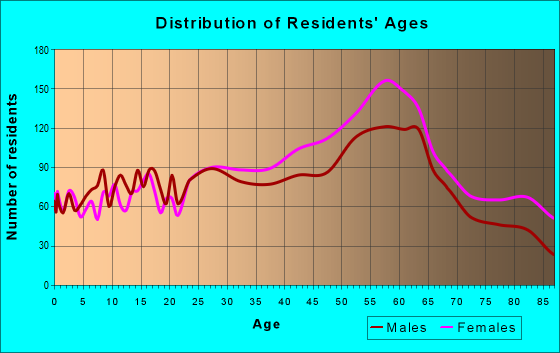
Median resident age:
This zip code:
50.0 years
California median age:
37.9 years
Average household size:
This zip code:
2.1 people
California:
2.8 people
Averages for the 2020 tax year for zip code 93950, filed in 2021:
Average Adjusted Gross Income (AGI) in 2020: $106,804 (Individual Income Tax Returns)
Here:
$106,804
State:
$95,910
Salary/wage: $83,600 (reported on 68.1% of returns)
Here:
$83,600
State:
$77,331
(% of AGI for various income ranges: 1192.2% for AGIs below $25k, 3651.9% for AGIs $25k-50k, 6786.8% for AGIs $50k-75k, 9558.7% for AGIs $75k-100k, 19174.7% for AGIs $100k-200k, 87426.5% for AGIs over 200k)
Taxable interest for individuals: $2,339 (reported on 47.7% of returns)
This zip code:
$2,339
California:
$2,294
(% of AGI for various income ranges: 53.0% for AGIs below $25k, 72.8% for AGIs $25k-50k, 118.5% for AGIs $50k-75k, 117.2% for AGIs $75k-100k, 395.3% for AGIs $100k-200k, 1709.0% for AGIs over 200k)
Ordinary dividends: $9,569 (reported on 37.3% of returns)
Here:
$9,569
State:
$10,949
(% of AGI for various income ranges: 115.3% for AGIs below $25k, 201.6% for AGIs $25k-50k, 359.4% for AGIs $50k-75k, 495.5% for AGIs $75k-100k, 1048.4% for AGIs $100k-200k, 6400.0% for AGIs over 200k)
Net capital gain/loss in AGI: +$29,449 (reported on 35.4% of returns)
Here:
+$29,449
State:
+$49,306
(% of AGI for various income ranges: 27.7% for AGIs below $25k, 147.2% for AGIs $25k-50k, 234.7% for AGIs $50k-75k, 571.3% for AGIs $75k-100k, 1401.7% for AGIs $100k-200k, 32207.5% for AGIs over 200k)
Profit/loss from business: +$21,295 (reported on 21.7% of returns)
Here:
+$21,295
State:
+$15,671
(% of AGI for various income ranges: 212.1% for AGIs below $25k, 434.9% for AGIs $25k-50k, 406.5% for AGIs $50k-75k, 584.5% for AGIs $75k-100k, 1235.1% for AGIs $100k-200k, 8002.5% for AGIs over 200k)
Taxable individual retirement arrangement distribution: $23,101 (reported on 14.8% of returns)
93950:
$23,101
California:
$23,505
(% of AGI for various income ranges: 94.3% for AGIs below $25k, 235.4% for AGIs $25k-50k, 331.0% for AGIs $50k-75k, 661.9% for AGIs $75k-100k, 1310.9% for AGIs $100k-200k, 4504.5% for AGIs over 200k)
Self-employed (Keogh) retirement plans: $25,792 (reported on 1.6% of returns)
93950:
$25,792
California:
$30,163
(% of AGI for various income ranges: 59.7% for AGIs $50k-75k, 143.4% for AGIs $100k-200k, 860.5% for AGIs over 200k)
Total itemized deductions: $36,447 (reported on 20.1% of returns)
Here:
$36,447
State:
$39,517
(% of AGI for various income ranges: 222.9% for AGIs below $25k, 406.9% for AGIs $25k-50k, 672.9% for AGIs $50k-75k, 1056.0% for AGIs $75k-100k, 2848.3% for AGIs $100k-200k, 10876.5% for AGIs over 200k)
Charity contributions: $8,470 (reported on 16.7% of returns)
Here:
$8,470
State:
$12,598
(% of AGI for various income ranges: 8.1% for AGIs below $25k, 29.1% for AGIs $25k-50k, 85.3% for AGIs $50k-75k, 136.8% for AGIs $75k-100k, 365.1% for AGIs $100k-200k, 3402.5% for AGIs over 200k)
Taxes paid: $8,384 (reported on 20.0% of returns)
93950:
$8,384
State:
$8,807
(% of AGI for various income ranges: 43.0% for AGIs below $25k, 79.4% for AGIs $25k-50k, 153.2% for AGIs $50k-75k, 264.3% for AGIs $75k-100k, 731.0% for AGIs $100k-200k, 2244.5% for AGIs over 200k)
Earned income credit: $1,514 (reported on 6.4% of returns)
Here:
$1,514
State:
$2,074
(% of AGI for various income ranges: 50.0% for AGIs below $25k, 36.0% for AGIs $25k-50k)
Percentage of individuals using paid preparers for their 2020 taxes: 91.9%
Here:
92%
State:
92%
(% for various income ranges: 89.1% for AGIs below $25k, 90.8% for AGIs $25k-50k, 91.8% for AGIs $50k-75k, 93.0% for AGIs $75k-100k, 94.1% for AGIs $100k-200k, 94.1% for AGIs over 200k)
Averages for the 2012 tax year for zip code 93950, filed in 2013:
Average Adjusted Gross Income (AGI) in 2012: $72,143 (Individual Income Tax Returns)
Here:
$72,143
State:
$72,726
Salary/wage: $61,877 (reported on 71.4% of returns)
Here:
$61,877
State:
$59,079
(% of AGI for various income ranges: 62.5% for AGIs below $25k, 67.2% for AGIs $25k-50k, 67.2% for AGIs $50k-75k, 63.5% for AGIs $75k-100k, 61.6% for AGIs $100k-200k, 53.6% for AGIs over 200k)
Taxable interest for individuals: $2,086 (reported on 47.4% of returns)
This zip code:
$2,086
California:
$2,146
(% of AGI for various income ranges: 2.5% for AGIs below $25k, 1.7% for AGIs $25k-50k, 1.3% for AGIs $50k-75k, 1.2% for AGIs $75k-100k, 1.2% for AGIs $100k-200k, 1.3% for AGIs over 200k)
Ordinary dividends: $8,584 (reported on 32.3% of returns)
Here:
$8,584
State:
$9,308
(% of AGI for various income ranges: 4.4% for AGIs below $25k, 2.8% for AGIs $25k-50k, 2.9% for AGIs $50k-75k, 3.1% for AGIs $75k-100k, 3.1% for AGIs $100k-200k, 6.0% for AGIs over 200k)
Net capital gain/loss in AGI: +$9,293 (reported on 28.5% of returns)
Here:
+$9,293
State:
+$30,460
(% of AGI for various income ranges: 0.4% for AGIs $25k-50k, 0.9% for AGIs $50k-75k, 1.3% for AGIs $75k-100k, 2.3% for AGIs $100k-200k, 10.2% for AGIs over 200k)
Profit/loss from business: +$21,686 (reported on 22.0% of returns)
Here:
+$21,686
State:
+$17,064
(% of AGI for various income ranges: 14.6% for AGIs below $25k, 7.4% for AGIs $25k-50k, 5.3% for AGIs $50k-75k, 3.5% for AGIs $75k-100k, 5.9% for AGIs $100k-200k, 7.7% for AGIs over 200k)
Taxable individual retirement arrangement distribution: $16,186 (reported on 15.4% of returns)
93950:
$16,186
California:
$19,557
(% of AGI for various income ranges: 3.9% for AGIs below $25k, 3.1% for AGIs $25k-50k, 3.4% for AGIs $50k-75k, 3.7% for AGIs $75k-100k, 4.5% for AGIs $100k-200k, 2.1% for AGIs over 200k)
Self-employment retirement plans: $14,308 (reported on 1.7% of returns)
93950:
$14,308
California:
$24,530
(% of AGI for various income ranges: 0.5% for AGIs below $25k, 0.4% for AGIs $50k-75k, 0.3% for AGIs $100k-200k, 0.6% for AGIs over 200k)
Total itemized deductions: $30,508 (25% of AGI, reported on 41.1% of returns)
Here:
$30,508
State:
$34,004
Here:
25.4% of AGI
State:
22.7% of AGI
(% of AGI for various income ranges: 24.4% for AGIs below $25k, 13.4% for AGIs $25k-50k, 15.2% for AGIs $50k-75k, 15.6% for AGIs $75k-100k, 19.1% for AGIs $100k-200k, 17.7% for AGIs over 200k)
Charity contributions: $3,799 (reported on 34.9% of returns)
Here:
$3,799
State:
$4,659
(% of AGI for various income ranges: 1.1% for AGIs below $25k, 1.1% for AGIs $25k-50k, 1.4% for AGIs $50k-75k, 1.5% for AGIs $75k-100k, 2.1% for AGIs $100k-200k, 2.3% for AGIs over 200k)
Taxes paid: $11,274 (reported on 40.9% of returns)
93950:
$11,274
State:
$14,448
(% of AGI for various income ranges: 3.5% for AGIs below $25k, 2.9% for AGIs $25k-50k, 3.6% for AGIs $50k-75k, 5.1% for AGIs $75k-100k, 7.3% for AGIs $100k-200k, 9.5% for AGIs over 200k)
Earned income credit: $1,506 (reported on 9.1% of returns)
Here:
$1,506
State:
$2,286
(% of AGI for various income ranges: 2.8% for AGIs below $25k, 0.5% for AGIs $25k-50k)
Percentage of individuals using paid preparers for their 2012 taxes: 56.8%
Here:
57%
State:
64%
(% for various income ranges: 49.3% for AGIs below $25k, 51.7% for AGIs $25k-50k, 58.5% for AGIs $50k-75k, 61.3% for AGIs $75k-100k, 65.9% for AGIs $100k-200k, 76.9% for AGIs over 200k)
Averages for the 2004 tax year for zip code 93950, filed in 2005:
Average Adjusted Gross Income (AGI) in 2004: $55,289 (Individual Income Tax Returns)
Here:
$55,289
State:
$58,600
Salary/wage: $48,001 (reported on 71.3% of returns)
Here:
$48,001
State:
$49,455
(% of AGI for various income ranges: 58.8% for AGIs $10k-25k, 68.3% for AGIs $25k-50k, 67.7% for AGIs $50k-75k, 66.9% for AGIs $75k-100k, 53.2% for AGIs over 100k)
Taxable interest for individuals: $2,673 (reported on 58.4% of returns)
This zip code:
$2,673
California:
$2,365
(% of AGI for various income ranges: 4.5% for AGIs $10k-25k, 3.2% for AGIs $25k-50k, 2.7% for AGIs $50k-75k, 2.6% for AGIs $75k-100k, 2.2% for AGIs over 100k)
Taxable dividends: $4,445 (reported on 37.9% of returns)
Here:
$4,445
State:
$4,746
(% of AGI for various income ranges: 3.6% for AGIs $10k-25k, 2.6% for AGIs $25k-50k, 2.5% for AGIs $50k-75k, 2.1% for AGIs $75k-100k, 3.3% for AGIs over 100k)
Net capital gain/loss: +$11,099 (reported on 32.8% of returns)
Here:
+$11,099
State:
+$23,418
(% of AGI for various income ranges: 0.7% for AGIs $10k-25k, 0.6% for AGIs $25k-50k, 1.4% for AGIs $50k-75k, 2.4% for AGIs $75k-100k, 13.0% for AGIs over 100k)
Profit/loss from business: +$22,982 (reported on 22.2% of returns)
Here:
+$22,982
State:
+$16,826
(% of AGI for various income ranges: 11.7% for AGIs $10k-25k, 8.0% for AGIs $25k-50k, 6.6% for AGIs $50k-75k, 7.6% for AGIs $75k-100k, 10.5% for AGIs over 100k)
IRA payment deduction: $3,207 (reported on 4.3% of returns)
93950:
$3,207
California:
$3,192
(% of AGI for various income ranges: 0.4% for AGIs $10k-25k, 0.5% for AGIs $25k-50k, 0.2% for AGIs $50k-75k, 0.2% for AGIs $75k-100k, 0.1% for AGIs over 100k)
Self-employed pension: $13,576 (reported on 2.6% of returns)
Here:
$13,576
California:
$17,688
(% of AGI for various income ranges: 0.4% for AGIs $25k-50k, 0.4% for AGIs $50k-75k, 0.6% for AGIs $75k-100k, 0.9% for AGIs over 100k)
Total itemized deductions: $26,346 (28% of AGI, reported on 40.2% of returns)
Here:
$26,346
State:
$28,113
Here:
28.0% of AGI
State:
25.3% of AGI
(% of AGI for various income ranges: 18.6% for AGIs $10k-25k, 17.8% for AGIs $25k-50k, 17.4% for AGIs $50k-75k, 19.1% for AGIs $75k-100k, 19.5% for AGIs over 100k)
Charity contributions deductions: $3,464 (4% of AGI, reported on 36.2% of returns)
Here:
$3,464
State:
$3,923
Here:
3.5% of AGI
State:
3.3% of AGI
(% of AGI for various income ranges: 1.2% for AGIs $10k-25k, 1.5% for AGIs $25k-50k, 2.1% for AGIs $50k-75k, 2.3% for AGIs $75k-100k, 2.7% for AGIs over 100k)
Total tax: $8,654 (reported on 84.4% of returns)
93950:
$8,654
State:
$10,761
(% of AGI for various income ranges: 5.9% for AGIs $10k-25k, 8.9% for AGIs $25k-50k, 10.8% for AGIs $50k-75k, 11.7% for AGIs $75k-100k, 16.9% for AGIs over 100k)
Earned income credit: $1,100 (reported on 6.6% of returns)
Here:
$1,100
State:
$1,763
Percentage of individuals using paid preparers for their 2004 taxes: 59.6%
Here:
60%
State:
66%
(% for various income ranges: 53.7% for AGIs below $10k, 55.9% for AGIs $10k-25k, 56.7% for AGIs $25k-50k, 61.9% for AGIs $50k-75k, 62.8% for AGIs $75k-100k, 72.6% for AGIs over 100k)
Likely homosexual households (counted as self-reported same-sex unmarried-partner households)
Lesbian couples: 0.6% of all households
Gay men: 0.3% of all households
Household received Food Stamps/SNAP in the past 12 months: 310 Household did not receive Food Stamps/SNAP in the past 12 months: 6,546
Women who had a birth in the past 12 months: 64 (40 now married, 24 unmarried) Women who did not have a birth in the past 12 months: 2,998 (1,504 now married, 1,480 unmarried)
Housing units in zip code 93950 with a mortgage: 1,929 (218 second mortgage, 7 home equity loan, 195 both second mortgage and home equity loan) Houses without a mortgage: 98
Median monthly owner costs for units with a mortgage: $3,388 Median monthly owner costs for units without a mortgage: $886
Residents with income below the poverty level in 2022:
This zip code:
7.2%
Whole state:
12.2%
Residents with income below 50% of the poverty level in 2022:
This zip code:
3.0%
Whole state:
6.2%
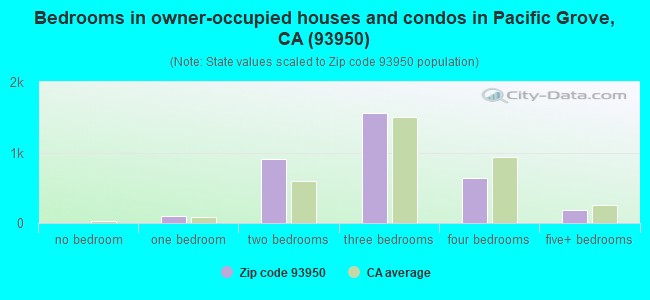
Median number of rooms in houses and condos:
Here:
5.8
State:
6.0
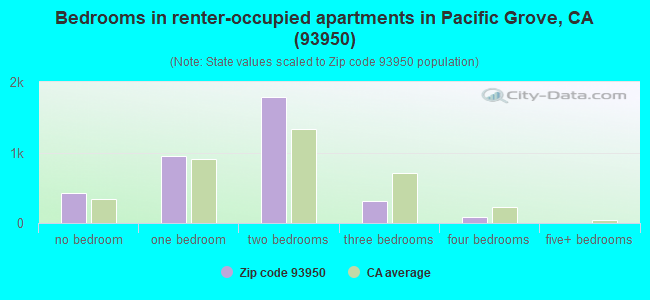
Median number of rooms in apartments:
Here:
3.8
State:
3.9
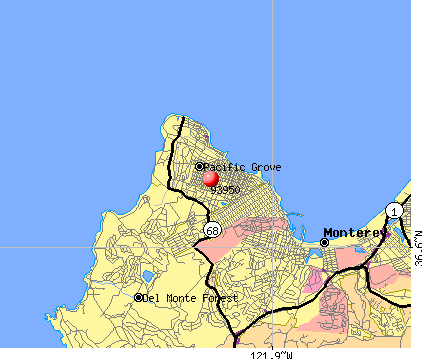
Notable locations in this zip code not listed on our city pages
Notable locations in zip code 93950: Southern Pacific Station (A), Pacific Grove Municipal Golf Links (B), Point Piños Light Station (C), Asilomar (D), Pacific Grove Museum of Natural History (E), Pacific Grove Art Center (F), Asilomar Conference Center (G), Steinbeck Museum (H), Pacific Grove Public Library (I), Pacific Grove City Hall (J), Pacific Grove Chamber of Commerce (K), Heritage Social Museum (L), Forest Lodge (M), Asilomar Conference Grounds (N), Seventeen Mile Drive Manor (O), Forest Hill Manor (P), Heritage Social Museum (Q), Westmed Ambulance Unit 22 (R), Pacific Grove Fire Department (S). Display/hide their locations on the map
Shopping Centers: Seventeen Mile Drive Village Shopping Center (1), American Tin Cannery Outlet Center Shopping Center (2), Forest Hill Shopping Center (3), Country Club Gate Shopping Center (4). Display/hide their locations on the map
Churches in zip code 93950 include: Coastlands-The Monterey Foursquare Church (A), First United Methodist Church (B), Holy Spirit Chapel (C), Peninsula Baptist Church (D), Peninsula Christian Center (E), Peninsula Presbyterian Church (F), Shoreline Community Church (G), Chapel In the Pines (H), Christian Church of Pacific Grove (I). Display/hide their locations on the map
Parks in zip code 93950 include: Asilomar State Beach (1), Arnett Park (2), Pacific Grove Marine Gardens Park (3), Caledonia Park (4), Forest Hill Playground (5), Breaker Stadium (6), Chase Park (7), Esplanade Park (8), Higgins Park (9). Display/hide their locations on the map
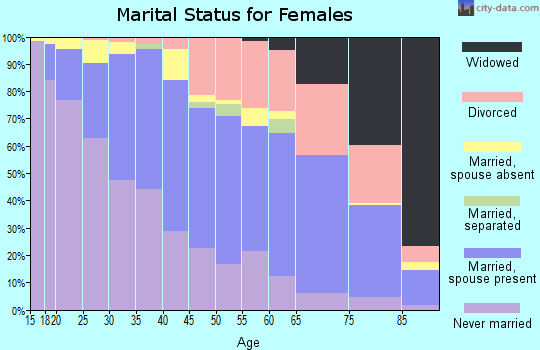
1,864 married couples with children.
532 single-parent households (179 men, 353 women).
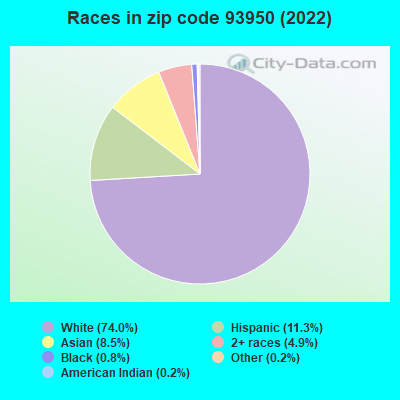
82.7% of residents of 93950 zip code speak English at home.
5.5% of residents speak Spanish at home (84% very well, 7% well, 5% not well, 3% not at all).
6.1% of residents speak other Indo-European language at home (83% very well, 11% well, 6% not well).
3.8% of residents speak Asian or Pacific Island language at home (81% very well, 15% well, 5% not well).
2.3% of residents speak other language at home (86% very well, 7% well, 7% not well).
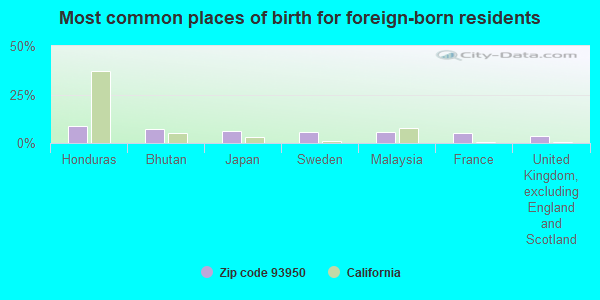
Foreign born population: 1,980 (13.2%) (68.7% of them are naturalized citizens)
This zip code:
13.2%
Whole state:
26.7%
9%Honduras
7%Bhutan
6%Japan
6%Sweden
6%Malaysia
5%France
4%United Kingdom, excluding England and Scotland
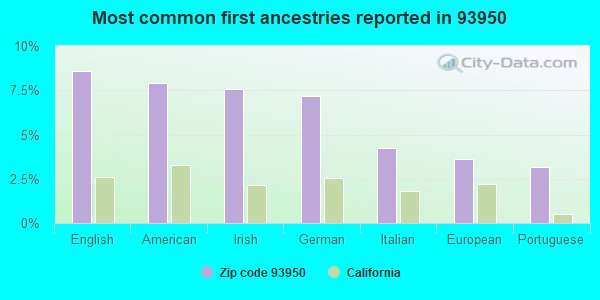
9%English
8%American
8%Irish
7%German
4%Italian
4%European
3%Portuguese
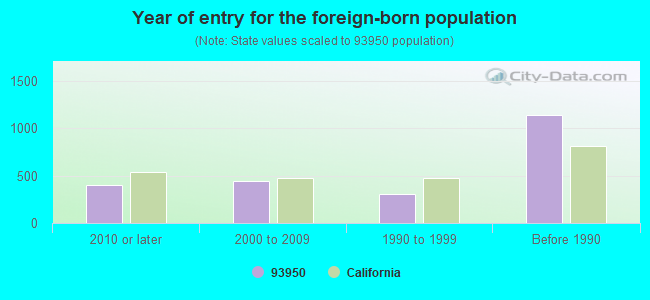
Year of entry for the foreign-born population
4062010 or later
4482000 to 2009
3091990 to 1999
1,139Before 1990
Facilities with environmental interests located in this zip code:
FOREST GROVE ELEMENTARY (1065 CONGRESS AVE. in PACIFIC GROVE, CA)
(National Center for Education Statistics) - STATE ID-6026470 Organizations: PACIFIC GROVE UNIFIED (SCHOOL DISTRICT)
INTERNATIONAL SCHOOL OF MONTEREY (1004 DAVID AVENUE BLDG.C in PACIFIC GROVE, CA)
(National Center for Education Statistics) - STATE ID-6118962 Organizations: MONTEREY PENINSULA UNIFIED (SCHOOL DISTRICT)
LUGOS SHELL SERVICE (687 LIGHTHOUSE AVENUE in PACIFIC GROVE, CA)
STATE MASTER (California - Hazardous Waste Tracking) - HAZARDOU WASTE PROGRAM CRITERIA AND HAZARDOUS AIR POLLUTANT INVENTORY (Inventory of air pollution sources) Business SIC classification: GASOLINE SERVICE STATIONS Alternative names: RETAIL SHELL SVC STATION
FOREST HILL PLAZA CLEANERS (1219 FOREST AVENUE UNIT D in PACIFIC GROVE, CA)
CRITERIA AND HAZARDOUS AIR POLLUTANT INVENTORY (Inventory of air pollution sources) Small Quantity Generators, between 100 kg and 1000 kg of hazardous waste/month (Resource Conservation and Recovery Act (tracking hazardous waste)) Business SIC classification: DRYCLEANING PLANTS, EXCEPT RUG CLEANING
MAJESTIC CLEANERS (158 COUNTRY CLUB GATE CENTER in PACIFIC GROVE, CA)
Small Quantity Generators, between 100 kg and 1000 kg of hazardous waste/month (Resource Conservation and Recovery Act (tracking hazardous waste)) - notification Organizations: BOB WEIDER (CONTACT/OWNER)
GREAT ANTIQUES INC (124 OCEANVIEW in PACIFIC GROVE, CA)
Small Quantity Generators, between 100 kg and 1000 kg of hazardous waste/month (Resource Conservation and Recovery Act (tracking hazardous waste))
CENTRAL COAST STUDIOS (1219 FOREST AVE UNIT H in PACIFIC GROVE, CA)
Small Quantity Generators, between 100 kg and 1000 kg of hazardous waste/month (Resource Conservation and Recovery Act (tracking hazardous waste)) - notification Business NAICS classification: PHOTOGRAPHY STUDIOS, PORTRAIT. Organizations: JON STOCKER AND JACKIE KELLY (CONTACT/OWNER)
MONTEREY BAY AQUARIUM RESEARCH (160 CENTRAL AVENUE in PACIFIC GROVE, CA)
Small Quantity Generators, between 100 kg and 1000 kg of hazardous waste/month (Resource Conservation and Recovery Act (tracking hazardous waste))
FOREST HILL GAS STATION & FOOD (1152 FOREST AVENUE in PACIFIC GROVE, CA)
CRITERIA AND HAZARDOUS AIR POLLUTANT INVENTORY (Inventory of air pollution sources) Business SIC classification: GASOLINE SERVICE STATIONS
FOREST HILL MART (1201 FOREST AVENUE in PACIFIC GROVE, CA)
CRITERIA AND HAZARDOUS AIR POLLUTANT INVENTORY (Inventory of air pollution sources) Business SIC classification: GASOLINE SERVICE STATIONS
Housing units lacking complete plumbing facilities: 0.4% Housing units lacking complete kitchen facilities: 1.5%
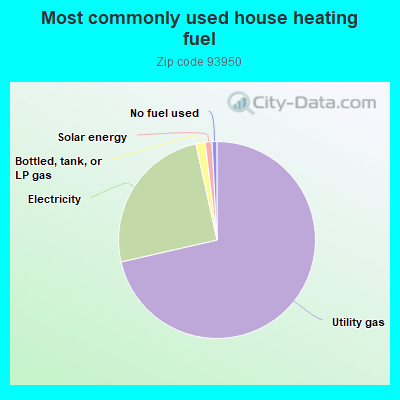
71.0%Utility gas
25.0%Electricity
1.5%Bottled, tank, or LP gas
1.1%Solar energy
0.8%No fuel used
Population in 1990: 16,040.
Place of birth for U.S.-born residents:
This state: 7,639
Northeast: 1,296
Midwest: 1,541
South: 1,136
West: 910
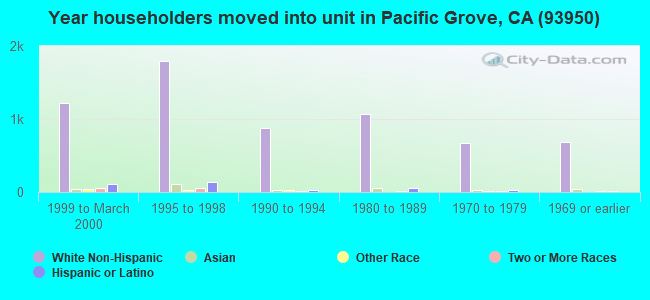
52% of the 93950 zip code residents lived in the same house 5 years ago. Out of people who lived in different houses, 51% lived in this county. Out of people who lived in different counties, 50% lived in California.
82% of the 93950 zip code residents lived in the same house 1 year ago. Out of people who lived in different houses, 46% moved from this county. Out of people who lived in different houses, 30% moved from different county within same state. Out of people who lived in different houses, 17% moved from different state. Out of people who lived in different houses, 4% moved from abroad.
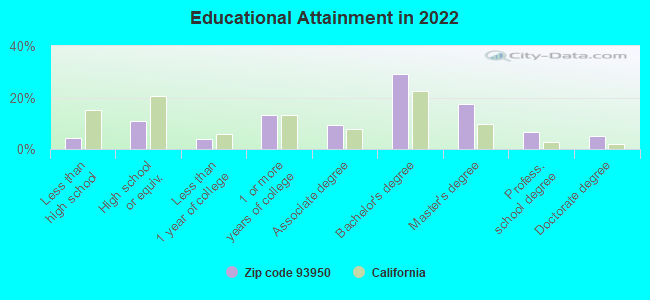
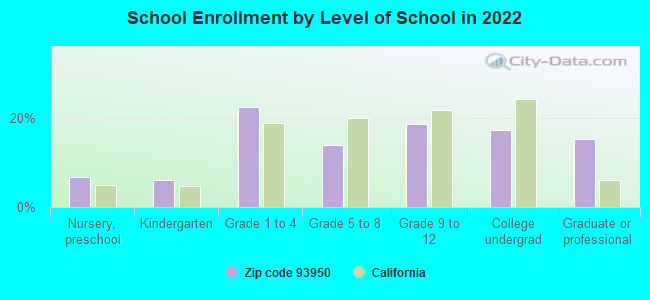
Private vs. public school enrollment:
Students in private schools in grades 1 to 8 (elementary and middle school): 113
Here:
10.2%
California:
10.5%
Students in private schools in grades 9 to 12 (high school): 89
Here:
15.8%
California:
8.5%
Students in private undergraduate colleges: 121
Here:
23.0%
California:
15.9%
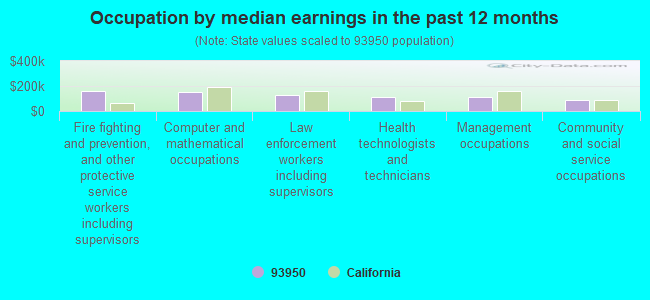
Occupation by median earnings in the past 12 months ($)
163,502Fire fighting and prevention, and other protective service workers including supervisors
153,529Computer and mathematical occupations
124,003Law enforcement workers including supervisors
111,320Health technologists and technicians
110,606Management occupations
88,498Community and social service occupations
Companies with biggest federal contracts located in this zip code (PACIFIC GROVE, CA):
F G SATTERTHWAITE (915 DEL MONTE BLVD; small business) : $190,072 in 6 contractsfrom 2002 to 2005
Contracts for Education Services, Lectures For Training, Other Professional Services by Navy Signed by year:2000: $0; 2001: $0; 2002: $29,989; 2003: $67,296; 2004: $53,625; 2005: $39,162; 2006: $0.
Biggest contracts:
$39,162 with Navy for Education Services. Signed on 2005-07-12. Completion date: 2005-12-05.
$35,139 with Navy for Lectures For Training. Signed on 2004-01-21. Completion date: 2004-06-25.
$33,910, same as above.Signed on 2003-07-09. Completion date: 2003-11-30.
$33,386, same as above.Signed on 2003-03-03. Completion date: 2003-06-30.
PACIFIC GROVE ADULT EDUCATION (1025 LIGHTHOUSE AV) : $174,983 in 17 contractsfrom 2001 to 2005
Contracts for Other Education and Training Services, Other Professional Services by Army Signed by year:2000: $0; 2001: $8,589; 2002: $42,704; 2003: $36,168; 2004: $62,202; 2005: $25,320; 2006: $0.
Biggest contracts:
$12,660 with Army for Other Education and Training Services. Signed on 2004-11-02. Effective on 2004-10-01. Completion date: 2005-12-31.
$12,660, same as above.Signed on 2004-12-22. Effective on 2005-01-01. Completion date: 2005-03-31.
$12,660, same as above.Signed on 2005-08-11. Effective on 2005-07-01. Completion date: 2005-09-30.
$12,660, same as above.Signed on 2005-04-28. Effective on 2005-03-30. Completion date: 2005-06-30.
MICHAEL HAGERTY (230 19TH STREET; small business) : $151,935 in 21 contractsfrom 2001 to 2005
Contracts for Other Professional Services by Army Signed by year:2000: $0; 2001: $25,445; 2002: $29,575; 2003: $30,940; 2004: $23,075; 2005: $42,900; 2006: $0.
Biggest contracts:
$18,850 with Army for Other Professional Services. Signed on 2005-11-18. Effective on 2005-10-01. Completion date: 2006-09-30.
$13,690, same as above.Signed on 2005-11-18. Effective on 2005-10-01. Completion date: 2006-09-30.
$13,135, same as above.Signed on 2004-11-01. Effective on 2004-10-01. Completion date: 2005-09-30.
$12,580, same as above.Signed on 2003-10-01. Completion date: 2004-09-30.
WAYNE P HUGHES,JR (705 WALNUT ST; small business) : $80,000 in 2 contractsfrom 1999 to 2000
$40,000 with Navy for Faculty Salaries for Dependent Schools. Signed on 2000-11-20. Completion date: 2001-11-19.
$40,000 with Navy for Other Professional Services. Signed on 1999-11-18. Completion date: 2000-09-30.
AESEC GLOBAL SERVICES, INC (1071 MORSE DR; small business) : $51,000 in 2 contractsin 2005
$27,000 with Navy for ADP Data Entry Services. Signed on 2005-08-01. Completion date: 2005-08-01.
$24,000, same as above.Signed on 2005-09-29. Completion date: 2005-08-01.
PGDOGS, LLC (911 SHELL AVE; small business) : $50,250 in 6 contractsfrom 2003 to 2006
Contracts for Insect and Rodent Control Services by Navy Signed by year:2000: $0; 2001: $0; 2002: $0; 2003: $7,200; 2004: $12,000; 2005: $17,550; 2006: $13,500.
Biggest contracts:
$13,500 with Navy for Insect and Rodent Control Services. Signed on 2006-05-16. Completion date: 2007-04-30.
$12,150, same as above.Signed on 2005-03-28. Completion date: 2006-03-28.
$7,200, same as above.Signed on 2004-03-24. Completion date: 2005-03-18.
$7,200, same as above.Signed on 2003-02-05. Completion date: 2004-02-04.
IRENE A JOSSAN (361 CENTRAL AVENUE; small business) : $45,962 in 7 contractsfrom 2001 to 2005
Contracts for Other Professional Services by Army Signed by year:2000: $0; 2001: $6,125; 2002: $8,673; 2003: $9,604; 2004: $10,780; 2005: $10,780; 2006: $0.
Biggest contracts:
$10,780 with Army for Other Professional Services. Signed on 2005-11-17. Effective on 2005-10-01. Completion date: 2006-09-30.
$10,780, same as above.Signed on 2004-11-02. Effective on 2004-10-01. Completion date: 2005-09-30.
$9,604, same as above.Signed on 2003-10-01. Completion date: 2004-09-30.
$8,673, same as above.Signed on 2002-12-04. Completion date: 2003-09-30.
CALIFORNIA PIANO (156 FOUNTAIN AVE; small business) : $41,501 in 2 contractsfrom 2003 to 2004
$25,724 with Army for Musical Instruments. Signed on 2003-09-27. Completion date: 2003-11-28.
$15,777, same as above.Signed on 2004-07-14. Completion date: 2004-08-13.
MCGHEE, ROBERT BROWN (651 SINEX AVE; small business) : $36,280 in 2 contractsin 2005
$18,419 with Navy for Educational Services. Signed on 2005-09-22. Completion date: 2005-12-31.
$17,861, same as above.Signed on 2005-07-01. Completion date: 2005-09-23.
MARIA MORGAN (953 14TH ST; small business) : $35,615 in 3 contractsfrom 2003 to 2005
$18,000 with Navy for Educational Services. Signed on 2005-06-06. Completion date: 2005-10-15.
$8,905, same as above.Signed on 2003-09-15. Completion date: 2003-12-29.
$8,710 with Navy for Training/Curriculum Development. Signed on 2003-06-19. Completion date: 2003-10-05.
Top industries in this zip code by the number of employees in 2005:
2002 - 2018 National Fire Incident Reporting System (NFIRS) incidents
Based on the data from the years 2002 - 2018 the average number of fires per year is 15. The highest number of fires - 33 took place in 2011, and the least - 0 in 2003. The data has a growing trend.
When looking into fire subcategories, the most reports belonged to: Structure Fires (48.4%), and Outside Fires (36.8%).
Fire incident types reported to NFIRS in Zip Code 93950


 Nearest zip codes: 93953, 93943, 93921, 93940, 93955, 93933.
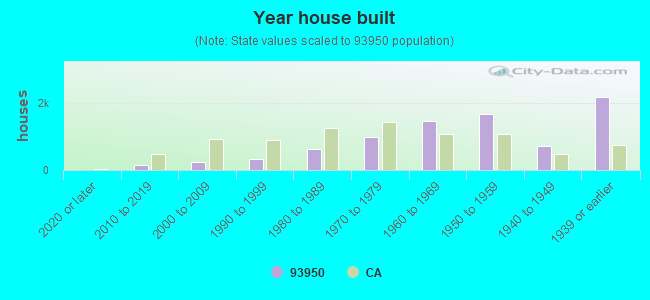


 Based on the data from the years 2002 - 2018 the average number of fires per year is 15. The highest number of fires - 33 took place in 2011, and the least - 0 in 2003. The data has a growing trend.
 When looking into fire subcategories, the most reports belonged to: Structure Fires (48.4%), and Outside Fires (36.8%).