Estimated zip code population in 2022: 58,535 Zip code population in 2010: 53,042 Zip code population in 2000: 51,659
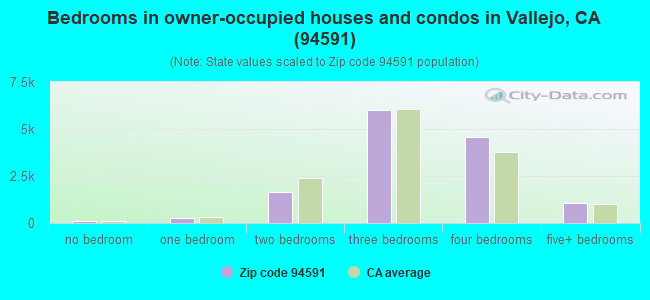
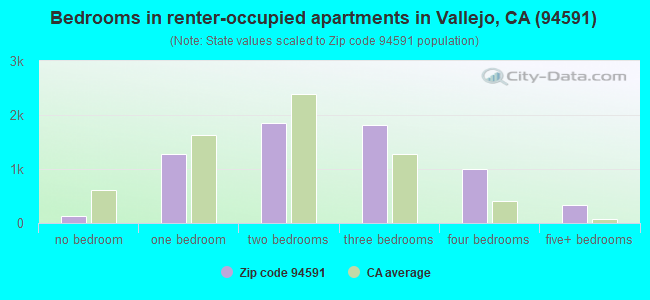
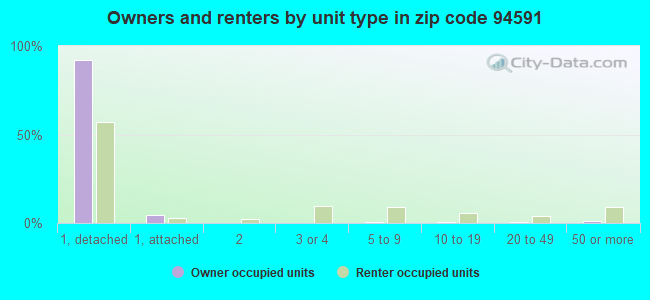
Houses and condos: 20,709 Renter-occupied apartments: 6,398
% of renters here:
32%
State:
44%
March 2022 cost of living index in zip code 94591: 111.8 (more than average, U.S. average is 100)
Land area: 21.6 sq. mi. Water area: 0.7 sq. mi.
Population density: 2,713 people per square mile
(average).
OSM Map
General Map
Google Map
MSN Map
OSM Map
General Map
Google Map
MSN Map
OSM Map
General Map
Google Map
MSN Map
OSM Map
General Map
Google Map
MSN Map
Please wait while loading the map...
Real estate property taxes paid for housing units in 2022:
This zip code:
0.8% ($4,708)
California:
0.7% ($4,831)
Median real estate property taxes paid for housing units with mortgages in 2022: $4,962 (0.8%) Median real estate property taxes paid for housing units with no mortgage in 2022: $3,808 (0.7%)
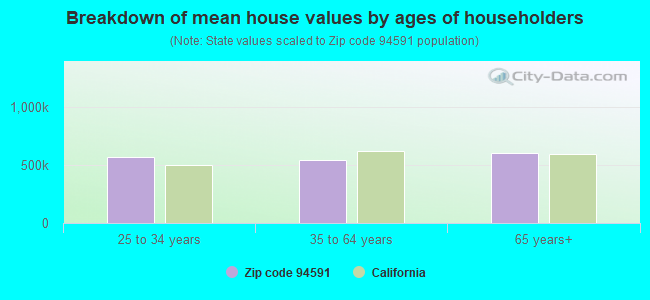
Estimated median house/condo value in 2022: $623,277
94591:
$623,277
California:
$715,900
According to our research of California and other state lists, there were 69 registered sex offenders living in 94591 zip code as of May 09, 2024. The ratio of all residents to sex offenders in zip code 94591 is 801 to 1. The ratio of registered sex offenders to all residents in this zip code is near the state average.
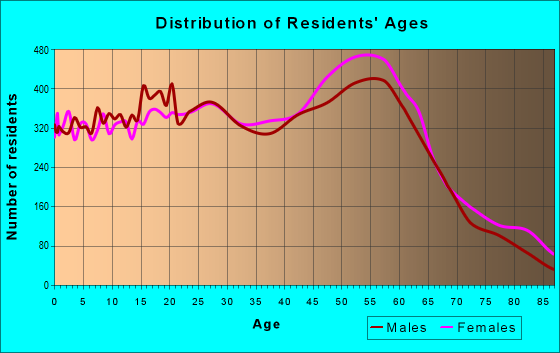
Median resident age:
This zip code:
41.8 years
California median age:
37.9 years
Average household size:
This zip code:
2.9 people
California:
2.8 people
Averages for the 2020 tax year for zip code 94591, filed in 2021:
Average Adjusted Gross Income (AGI) in 2020: $72,737 (Individual Income Tax Returns)
Here:
$72,737
State:
$95,910
Salary/wage: $66,424 (reported on 80.1% of returns)
Here:
$66,424
State:
$77,331
(% of AGI for various income ranges: 1142.8% for AGIs below $25k, 3813.7% for AGIs $25k-50k, 7226.0% for AGIs $50k-75k, 10471.8% for AGIs $75k-100k, 19718.2% for AGIs $100k-200k, 67988.9% for AGIs over 200k)
Taxable interest for individuals: $687 (reported on 36.4% of returns)
This zip code:
$687
California:
$2,294
(% of AGI for various income ranges: 9.8% for AGIs below $25k, 15.8% for AGIs $25k-50k, 30.7% for AGIs $50k-75k, 47.2% for AGIs $75k-100k, 90.1% for AGIs $100k-200k, 339.3% for AGIs over 200k)
Ordinary dividends: $3,056 (reported on 14.3% of returns)
Here:
$3,056
State:
$10,949
(% of AGI for various income ranges: 16.1% for AGIs below $25k, 24.4% for AGIs $25k-50k, 49.8% for AGIs $50k-75k, 72.6% for AGIs $75k-100k, 147.3% for AGIs $100k-200k, 771.6% for AGIs over 200k)
Net capital gain/loss in AGI: +$11,345 (reported on 13.2% of returns)
Here:
+$11,345
State:
+$49,306
(% of AGI for various income ranges: 8.4% for AGIs below $25k, 15.8% for AGIs $25k-50k, 47.4% for AGIs $50k-75k, 93.2% for AGIs $75k-100k, 291.8% for AGIs $100k-200k, 6916.6% for AGIs over 200k)
Profit/loss from business: +$8,345 (reported on 15.1% of returns)
Here:
+$8,345
State:
+$15,671
(% of AGI for various income ranges: 103.4% for AGIs below $25k, 111.6% for AGIs $25k-50k, 177.5% for AGIs $50k-75k, 219.3% for AGIs $75k-100k, 296.4% for AGIs $100k-200k, 1715.5% for AGIs over 200k)
Taxable individual retirement arrangement distribution: $22,285 (reported on 7.2% of returns)
94591:
$22,285
California:
$23,505
(% of AGI for various income ranges: 44.9% for AGIs below $25k, 77.7% for AGIs $25k-50k, 149.5% for AGIs $50k-75k, 323.6% for AGIs $75k-100k, 672.1% for AGIs $100k-200k, 2229.8% for AGIs over 200k)
Self-employed (Keogh) retirement plans: $13,533 (reported on 0.3% of returns)
94591:
$13,533
California:
$30,163
(% of AGI for various income ranges: 3.9% for AGIs $25k-50k, 14.2% for AGIs $100k-200k, 144.3% for AGIs over 200k)
Total itemized deductions: $29,879 (reported on 19.0% of returns)
Here:
$29,879
State:
$39,517
(% of AGI for various income ranges: 113.8% for AGIs below $25k, 269.3% for AGIs $25k-50k, 655.0% for AGIs $50k-75k, 1289.3% for AGIs $75k-100k, 2387.5% for AGIs $100k-200k, 7039.8% for AGIs over 200k)
Charity contributions: $5,734 (reported on 15.4% of returns)
Here:
$5,734
State:
$12,598
(% of AGI for various income ranges: 6.1% for AGIs below $25k, 31.0% for AGIs $25k-50k, 91.9% for AGIs $50k-75k, 175.1% for AGIs $75k-100k, 381.5% for AGIs $100k-200k, 1456.4% for AGIs over 200k)
Taxes paid: $8,655 (reported on 19.0% of returns)
94591:
$8,655
State:
$8,807
(% of AGI for various income ranges: 25.3% for AGIs below $25k, 67.8% for AGIs $25k-50k, 191.9% for AGIs $50k-75k, 400.8% for AGIs $75k-100k, 742.1% for AGIs $100k-200k, 1745.7% for AGIs over 200k)
Earned income credit: $1,879 (reported on 10.8% of returns)
Here:
$1,879
State:
$2,074
(% of AGI for various income ranges: 72.8% for AGIs below $25k, 49.5% for AGIs $25k-50k, 0.6% for AGIs $50k-75k)
Percentage of individuals using paid preparers for their 2020 taxes: 90.2%
Here:
90%
State:
92%
(% for various income ranges: 89.0% for AGIs below $25k, 90.2% for AGIs $25k-50k, 90.3% for AGIs $50k-75k, 90.6% for AGIs $75k-100k, 91.1% for AGIs $100k-200k, 91.7% for AGIs over 200k)
Averages for the 2012 tax year for zip code 94591, filed in 2013:
Average Adjusted Gross Income (AGI) in 2012: $60,458 (Individual Income Tax Returns)
Here:
$60,458
State:
$72,726
Salary/wage: $55,932 (reported on 84.4% of returns)
Here:
$55,932
State:
$59,079
(% of AGI for various income ranges: 74.0% for AGIs below $25k, 79.2% for AGIs $25k-50k, 78.6% for AGIs $50k-75k, 77.4% for AGIs $75k-100k, 80.8% for AGIs $100k-200k, 71.2% for AGIs over 200k)
Taxable interest for individuals: $597 (reported on 37.1% of returns)
This zip code:
$597
California:
$2,146
(% of AGI for various income ranges: 0.7% for AGIs below $25k, 0.4% for AGIs $25k-50k, 0.4% for AGIs $50k-75k, 0.4% for AGIs $75k-100k, 0.3% for AGIs $100k-200k, 0.3% for AGIs over 200k)
Ordinary dividends: $3,101 (reported on 13.6% of returns)
Here:
$3,101
State:
$9,308
(% of AGI for various income ranges: 0.8% for AGIs below $25k, 0.6% for AGIs $25k-50k, 0.5% for AGIs $50k-75k, 0.7% for AGIs $75k-100k, 0.5% for AGIs $100k-200k, 1.8% for AGIs over 200k)
Net capital gain/loss in AGI: +$2,786 (reported on 10.6% of returns)
Here:
+$2,786
State:
+$30,460
(% of AGI for various income ranges: 0.3% for AGIs $50k-75k, 0.2% for AGIs $75k-100k, 0.5% for AGIs $100k-200k, 1.8% for AGIs over 200k)
Profit/loss from business: +$9,236 (reported on 13.3% of returns)
Here:
+$9,236
State:
+$17,064
(% of AGI for various income ranges: 7.4% for AGIs below $25k, 2.6% for AGIs $25k-50k, 1.3% for AGIs $50k-75k, 1.4% for AGIs $75k-100k, 1.3% for AGIs $100k-200k, 2.4% for AGIs over 200k)
Taxable individual retirement arrangement distribution: $16,908 (reported on 7.5% of returns)
94591:
$16,908
California:
$19,557
(% of AGI for various income ranges: 1.9% for AGIs below $25k, 1.8% for AGIs $25k-50k, 2.0% for AGIs $50k-75k, 2.3% for AGIs $75k-100k, 2.1% for AGIs $100k-200k, 2.5% for AGIs over 200k)
Self-employment retirement plans: $12,410 (reported on 0.4% of returns)
94591:
$12,410
California:
$24,530
(% of AGI for various income ranges: 0.1% for AGIs $50k-75k, 0.3% for AGIs over 200k)
Total itemized deductions: $25,675 (26% of AGI, reported on 41.1% of returns)
Here:
$25,675
State:
$34,004
Here:
26.0% of AGI
State:
22.7% of AGI
(% of AGI for various income ranges: 10.9% for AGIs below $25k, 12.5% for AGIs $25k-50k, 16.0% for AGIs $50k-75k, 18.7% for AGIs $75k-100k, 19.5% for AGIs $100k-200k, 21.1% for AGIs over 200k)
Charity contributions: $3,026 (reported on 34.1% of returns)
Here:
$3,026
State:
$4,659
(% of AGI for various income ranges: 0.7% for AGIs below $25k, 1.1% for AGIs $25k-50k, 1.7% for AGIs $50k-75k, 1.8% for AGIs $75k-100k, 2.0% for AGIs $100k-200k, 1.9% for AGIs over 200k)
Taxes paid: $8,463 (reported on 41.0% of returns)
94591:
$8,463
State:
$14,448
(% of AGI for various income ranges: 2.1% for AGIs below $25k, 2.6% for AGIs $25k-50k, 4.3% for AGIs $50k-75k, 5.8% for AGIs $75k-100k, 7.4% for AGIs $100k-200k, 8.5% for AGIs over 200k)
Earned income credit: $2,055 (reported on 14.7% of returns)
Here:
$2,055
State:
$2,286
(% of AGI for various income ranges: 5.8% for AGIs below $25k, 0.8% for AGIs $25k-50k)
Percentage of individuals using paid preparers for their 2012 taxes: 52.3%
Here:
52%
State:
64%
(% for various income ranges: 45.5% for AGIs below $25k, 49.1% for AGIs $25k-50k, 55.5% for AGIs $50k-75k, 58.5% for AGIs $75k-100k, 60.4% for AGIs $100k-200k, 66.7% for AGIs over 200k)
Averages for the 2004 tax year for zip code 94591, filed in 2005:
Average Adjusted Gross Income (AGI) in 2004: $54,145 (Individual Income Tax Returns)
Here:
$54,145
State:
$58,600
Salary/wage: $51,794 (reported on 86.4% of returns)
Here:
$51,794
State:
$49,455
(% of AGI for various income ranges: 119.0% for AGIs below $10k, 72.7% for AGIs $10k-25k, 81.1% for AGIs $25k-50k, 83.7% for AGIs $50k-75k, 85.5% for AGIs $75k-100k, 82.1% for AGIs over 100k)
Taxable interest for individuals: $968 (reported on 49.5% of returns)
This zip code:
$968
California:
$2,365
(% of AGI for various income ranges: 3.6% for AGIs below $10k, 1.8% for AGIs $10k-25k, 1.0% for AGIs $25k-50k, 0.7% for AGIs $50k-75k, 0.7% for AGIs $75k-100k, 0.8% for AGIs over 100k)
Taxable dividends: $1,486 (reported on 19.0% of returns)
Here:
$1,486
State:
$4,746
(% of AGI for various income ranges: 2.2% for AGIs below $10k, 0.9% for AGIs $10k-25k, 0.5% for AGIs $25k-50k, 0.5% for AGIs $50k-75k, 0.5% for AGIs $75k-100k, 0.4% for AGIs over 100k)
Net capital gain/loss: +$7,130 (reported on 14.8% of returns)
Here:
+$7,130
State:
+$23,418
(% of AGI for various income ranges: 1.9% for AGIs below $10k, -0.0% for AGIs $10k-25k, 0.1% for AGIs $25k-50k, 0.5% for AGIs $50k-75k, 0.5% for AGIs $75k-100k, 4.4% for AGIs over 100k)
Profit/loss from business: +$12,461 (reported on 13.8% of returns)
Here:
+$12,461
State:
+$16,826
(% of AGI for various income ranges: 12.7% for AGIs below $10k, 5.7% for AGIs $10k-25k, 2.9% for AGIs $25k-50k, 2.6% for AGIs $50k-75k, 2.5% for AGIs $75k-100k, 3.3% for AGIs over 100k)
IRA payment deduction: $3,020 (reported on 2.1% of returns)
94591:
$3,020
California:
$3,192
(% of AGI for various income ranges: 0.2% for AGIs $10k-25k, 0.2% for AGIs $25k-50k, 0.1% for AGIs $50k-75k, 0.1% for AGIs $75k-100k, 0.1% for AGIs over 100k)
Self-employed pension: $12,523 (reported on 0.8% of returns)
Here:
$12,523
California:
$17,688
(% of AGI for various income ranges: 0.1% for AGIs $10k-25k, 0.1% for AGIs $25k-50k, 0.1% for AGIs $50k-75k, 0.1% for AGIs $75k-100k, 0.3% for AGIs over 100k)
Total itemized deductions: $26,349 (32% of AGI, reported on 49.0% of returns)
Here:
$26,349
State:
$28,113
Here:
31.5% of AGI
State:
25.3% of AGI
(% of AGI for various income ranges: 23.5% for AGIs below $10k, 18.0% for AGIs $10k-25k, 18.8% for AGIs $25k-50k, 26.2% for AGIs $50k-75k, 27.0% for AGIs $75k-100k, 24.3% for AGIs over 100k)
Charity contributions deductions: $2,763 (3% of AGI, reported on 44.2% of returns)
Here:
$2,763
State:
$3,923
Here:
3.2% of AGI
State:
3.3% of AGI
(% of AGI for various income ranges: 1.3% for AGIs below $10k, 1.1% for AGIs $10k-25k, 1.8% for AGIs $25k-50k, 2.4% for AGIs $50k-75k, 2.5% for AGIs $75k-100k, 2.5% for AGIs over 100k)
Total tax: $6,832 (reported on 79.7% of returns)
94591:
$6,832
State:
$10,761
(% of AGI for various income ranges: 3.7% for AGIs below $10k, 4.3% for AGIs $10k-25k, 6.7% for AGIs $25k-50k, 8.2% for AGIs $50k-75k, 9.1% for AGIs $75k-100k, 13.7% for AGIs over 100k)
Earned income credit: $1,632 (reported on 10.5% of returns)
Here:
$1,632
State:
$1,763
Percentage of individuals using paid preparers for their 2004 taxes: 58.7%
Here:
59%
State:
66%
(% for various income ranges: 45.9% for AGIs below $10k, 57.6% for AGIs $10k-25k, 58.7% for AGIs $25k-50k, 63.5% for AGIs $50k-75k, 64.3% for AGIs $75k-100k, 63.4% for AGIs over 100k)
Likely homosexual households (counted as self-reported same-sex unmarried-partner households)
Lesbian couples: 0.1% of all households
Gay men: 0.3% of all households
Household received Food Stamps/SNAP in the past 12 months: 1,728 Household did not receive Food Stamps/SNAP in the past 12 months: 18,184
Women who had a birth in the past 12 months: 721 (479 now married, 242 unmarried) Women who did not have a birth in the past 12 months: 12,636 (4,509 now married, 8,148 unmarried)
Housing units in zip code 94591 with a mortgage: 10,375 (935 second mortgage, 28 home equity loan, 563 both second mortgage and home equity loan) Houses without a mortgage: 132
Median monthly owner costs for units with a mortgage: $2,601 Median monthly owner costs for units without a mortgage: $713
Residents with income below the poverty level in 2022:
This zip code:
9.1%
Whole state:
12.2%
Residents with income below 50% of the poverty level in 2022:
This zip code:
4.2%
Whole state:
6.2%
Median number of rooms in houses and condos:
Here:
6.3
State:
6.0
Median number of rooms in apartments:
Here:
4.8
State:
3.9
Notable locations in this zip code not listed on our city pages
Notable locations in zip code 94591: Glen Cove Marina (A), Elliott Cove Marina (B), Vallejo Municipal Golf Course (C), Vallejo Fire Department Station 6 (D), Vallejo Fire Department Station 7 (E), Vallejo Fire Department Station 4 (F). Display/hide their locations on the map
Parks in zip code 94591 include: Blue Rock Springs Park (1), Beverly Hills Park (2), Castlewood Park (3), Glen Cove Park (4), Glen Cove Waterfront Park (5), Hanns Park (6), Highlands Park (7). Display/hide their locations on the map
5,511 married couples with children.
3,403 single-parent households (1,166 men, 2,237 women).
65.8% of residents of 94591 zip code speak English at home.
12.0% of residents speak Spanish at home (59% very well, 25% well, 10% not well, 5% not at all).
2.1% of residents speak other Indo-European language at home (75% very well, 20% well, 4% not well).
19.4% of residents speak Asian or Pacific Island language at home (64% very well, 24% well, 9% not well, 2% not at all).
0.7% of residents speak other language at home (82% very well, 12% well, 6% not well).
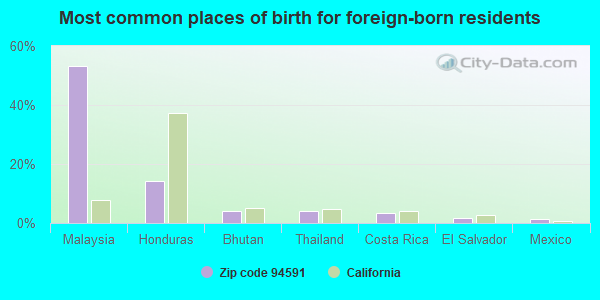
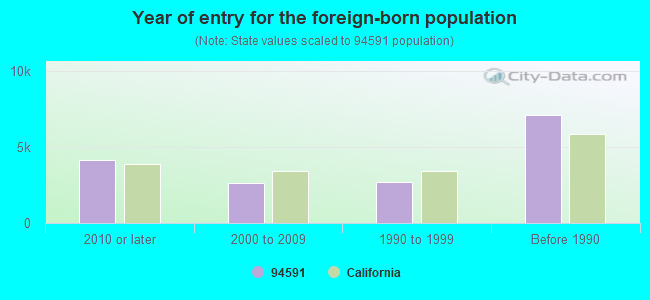
Foreign born population: 14,958 (25.6%) (69.6% of them are naturalized citizens)
Facilities with environmental interests located in this zip code:
GLEN COVE ELEMENTARY (501 GLEN COVE PARKWAY in VALLEJO, CA)
(National Center for Education Statistics) - STATE ID-6107684 Organizations: VALLEJO CITY UNIFIED (SCHOOL DISTRICT)
HOGAN HIGH (850 ROSEWOOD ST. in VALLEJO, CA)
(National Center for Education Statistics) - STATE ID-4833950 Organizations: VALLEJO CITY UNIFIED (SCHOOL DISTRICT)
CAVE (ELMER) ELEMENTARY (770 TREGASKIS in VALLEJO, CA)
(National Center for Education Statistics) - STATE ID-6051429 Organizations: VALLEJO CITY UNIFIED (SCHOOL DISTRICT)
EVERGREEN OIL INC VELLEJO (LAKE HERMAN ROAD AT COLUMBUS in VALLEJO, CA)
HAZARDOUS WASTE BIENNIAL REPORTER (Resource Conservation and Recovery Act (tracking hazardous waste)) TRANSPORTER (Resource Conservation and Recovery Act (tracking hazardous waste)) - notification USED OIL PROGRAM (Resource Conservation and Recovery Act (tracking hazardous waste)) Organizations: SYAR INDUSTRIES (CONTACT/OWNER)
GATEWAY CLEANERS (137 PLAZA DRIVE UNIT 317 in VALLEJO, CA)
CRITERIA AND HAZARDOUS AIR POLLUTANT INVENTORY (Inventory of air pollution sources) (Resource Conservation and Recovery Act (tracking hazardous waste)) Business SIC classification: DRYCLEANING PLANTS, EXCEPT RUG CLEANING Organizations: EDWARD S AND CARRIE I MORRIS (CONTACT/OWNER)
HILLTOP CHRISTIAN SCHOOL (210 LOCUST DR in VALLEJO, CA)
COMPLIANCE ACTIVITY (Tracking inspections of insecticide, fungicide, and rodenticide, and toxic substances) Alternative names: HILLTOP CHRISTIAN CHURCH
HOME DEPOT USA INC HD 0633 (1175 ADMIRAL CALLAGHAN L in VALLEJO, CA)
Small Quantity Generators, between 100 kg and 1000 kg of hazardous waste/month (Resource Conservation and Recovery Act (tracking hazardous waste))
EXXON COMPANY USA C/O ERI (2601 SPRINGS ROAD in VALLEJO, CA)
CRITERIA AND HAZARDOUS AIR POLLUTANT INVENTORY (Inventory of air pollution sources)
CEMEX LAKE HERMAN/VALLEJO (885 LAKE HERMAN RD in VALLEJO, CA)
TRI REPORTER (Tracking of toxic chemicals releasing facilities) Business SIC classification: READY-MIXED CONCRETE Alternative names: RMC PACIFIC MATERIALS
Housing units lacking complete plumbing facilities: 0.8% Housing units lacking complete kitchen facilities: 1.1%
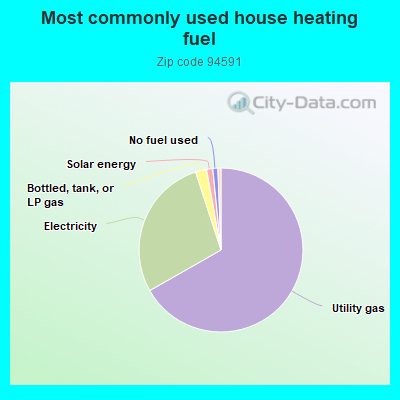
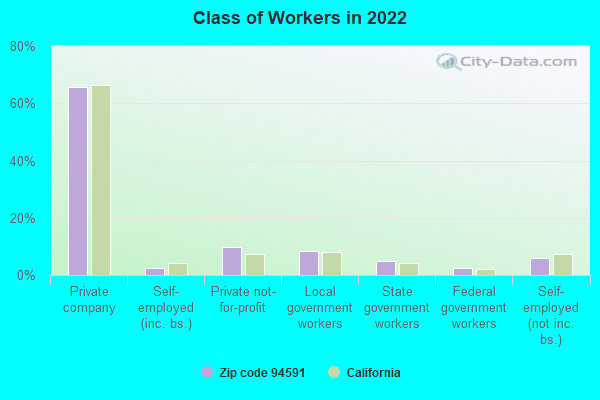
66.7%Utility gas
28.2%Electricity
2.2%Bottled, tank, or LP gas
1.2%Solar energy
1.0%No fuel used
0.6%Wood
Population in 1990: 43,336. Population change in the 1990s: +8,323 (+19.2%).
Place of birth for U.S.-born residents:
This state: 34,194
Northeast: 1,405
Midwest: 2,115
South: 2,741
West: 1,615
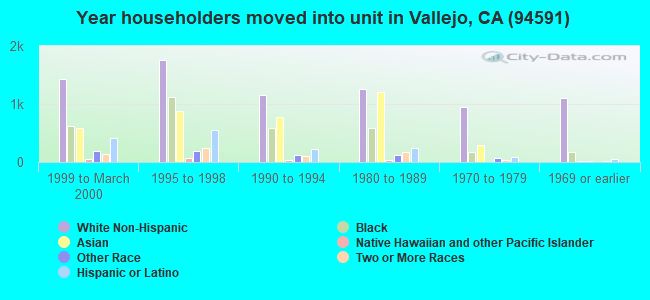
59% of the 94591 zip code residents lived in the same house 5 years ago. Out of people who lived in different houses, 54% lived in this county. Out of people who lived in different counties, 50% lived in California.
89% of the 94591 zip code residents lived in the same house 1 year ago. Out of people who lived in different houses, 45% moved from this county. Out of people who lived in different houses, 50% moved from different county within same state. Out of people who lived in different houses, 3% moved from different state. Out of people who lived in different houses, 2% moved from abroad.
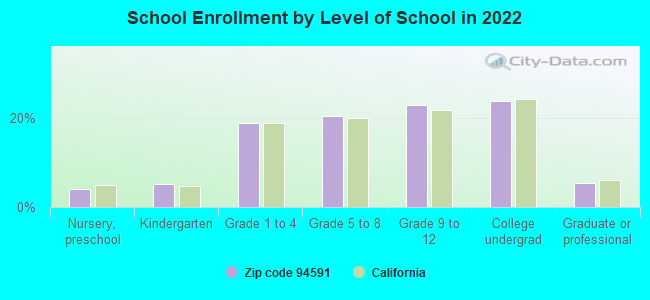
Private vs. public school enrollment:
Students in private schools in grades 1 to 8 (elementary and middle school): 1,274
Here:
24.6%
California:
10.5%
Students in private schools in grades 9 to 12 (high school): 259
Here:
8.7%
California:
8.5%
Students in private undergraduate colleges: 687
Here:
22.1%
California:
15.9%
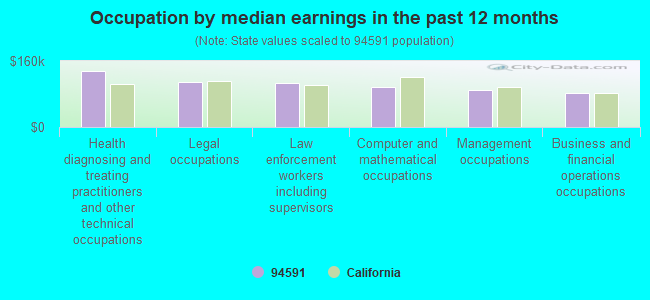
Occupation by median earnings in the past 12 months ($)
134,953Health diagnosing and treating practitioners and other technical occupations
109,997Legal occupations
105,517Law enforcement workers including supervisors
96,222Computer and mathematical occupations
90,392Management occupations
83,526Business and financial operations occupations
Companies with federal contracts located in this zip code (VALLEJO, CA):
JET INVESTMENT INC (120 MUSTANG CT; small business) : $4,529,579 in 36 contractsfrom 2000 to 2006
Contracts for Lodging - Hotel/Motel, Invalid code: AT17, Non-nuclear Ship Repair (West) Ship repair (including overhauls and conversions) performed on. non-nuclear propelled and nonpropelled ships west of the 108th meridian by Navy Signed by year:2000: $54,945; 2001: $217,485; 2002: $0; 2003: $43,200; 2004: $1,153,794; 2005: $1,731,857; 2006: $1,328,298.
Biggest contracts:
$800,000 with Navy for Lodging - Hotel/Motel. Signed on 2006-04-11. Completion date: 2006-05-31.
$400,000, same as above.Signed on 2006-02-03. Completion date: 2006-01-26.
$350,000, same as above.Signed on 2005-12-20. Completion date: 2005-12-20.
$350,000, same as above.Signed on 2005-05-12. Completion date: 2005-04-15.
YX & ASSOCIATES, INC (3052 OVERLOOK DRIVE; small business) : $390,135 in 7 contractsfrom 2000 to 2003
Contracts for Architect - Engineer Services (including landscaping, interior layout, and designing), Land Surveys, Cadastral Services (non-construction), Other Architect and Engineering Services by U.S. Army Corps of Engineers - civil program financing only Signed by year:2000: $91,635; 2001: $58,800; 2002: $203,200; 2003: $36,500; 2004: $0; 2005: $0; 2006: $0.
Biggest contracts:
$150,000 with U.S. Army Corps of Engineers - civil program financing only for Architect - Engineer Services (including landscaping, interior layout, and designing). Signed on 2002-01-09. Completion date: 2002-06-18.
$58,800, same as above.Signed on 2001-05-08. Completion date: 2001-09-28.
$46,835, same as above.Signed on 2000-08-08. Completion date: 2000-04-28.
$44,800, same as above.Signed on 2000-03-28. Completion date: 2000-04-28.
GLOBAL INSTALLER NETWORKS, INC (282 COTTONWOOD DR; small business) 50 employees, $0 revenue. Woman Owned Business
$60,946 with Department of Defense for ADP Support Equipment. Signed on 2002-08-29. Completion date: 2002-09-28.
JULARBAL, ALEJANDRO (640 BRUNSWICK DR; small business) : $11,400 in 2 contractsin 2000
$48,000 with Army for Other Professional Services. Taking place in MD. Signed on 2000-04-26. Completion date: 2001-04-27.
-$36,600, same as above.Signed on 2000-11-06. Completion date: 2001-04-27.
PERSONAL RECORD SPORTS (802 BRENTWOOD AVE; small business)
$8,547 with Army for Athletic and Sporting Equipment. Signed on 2004-05-13. Completion date: 2004-06-07.
HIBBARD, JOSEPHINE M (1023 CALDWELL AVE; small business) : $7,200 in 2 contractsin 2006
$7,200 with Air Force for Other Social Services. Signed on 2006-06-05. Completion date: 2006-09-30.
$0, same as above.Signed on 2006-06-05. Completion date: 2006-09-30.
M A K MANAGEMENT (1000 ADMIRAL CALLAGHAN LN; small business)
$1,518 with Army for Lodging - Hotel/Motel. Signed on 2003-10-31. Completion date: 2003-11-03.
Top industries in this zip code by the number of employees in 2005:
2005 - 2018 National Fire Incident Reporting System (NFIRS) incidents
According to the data from the years 2005 - 2018 the average number of fire incidents per year is 17. The highest number of reported fires - 112 took place in 2009, and the least - 0 in 2006. The data has a rising trend.
When looking into fire subcategories, the most reports belonged to: Outside Fires (41.5%), and Structure Fires (35.3%).
Fire incident types reported to NFIRS in Zip Code 94591


 Nearest zip codes: 94590, 94510, 94589, 94525, 94569, 94592.


 According to the data from the years 2005 - 2018 the average number of fire incidents per year is 17. The highest number of reported fires - 112 took place in 2009, and the least - 0 in 2006. The data has a rising trend.
 When looking into fire subcategories, the most reports belonged to: Outside Fires (41.5%), and Structure Fires (35.3%).