Estimated zip code population in 2022: 36,067 Zip code population in 2010: 36,079 Zip code population in 2000: 36,620
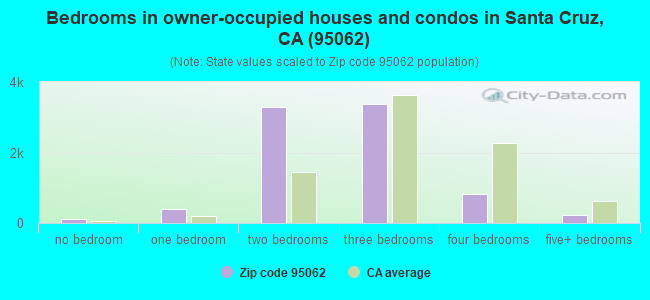
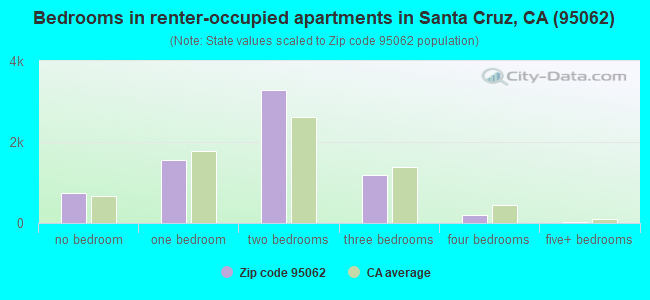
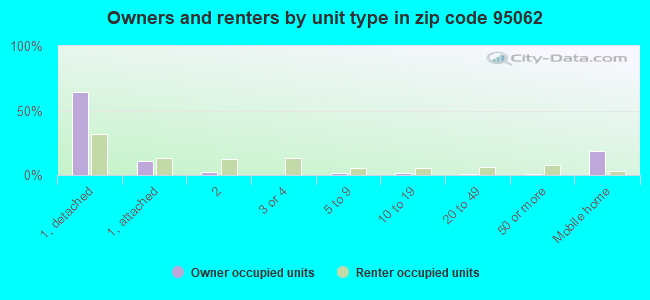
Houses and condos: 16,971 Renter-occupied apartments: 6,987
% of renters here:
46%
State:
44%
March 2022 cost of living index in zip code 95062: 130.3 (high, U.S. average is 100)
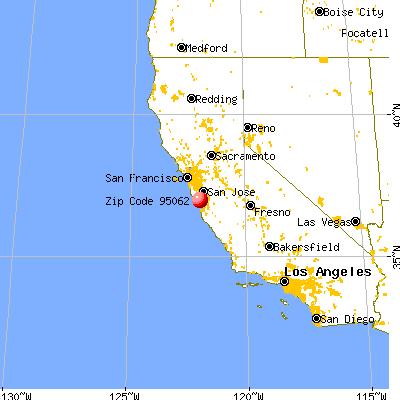
Land area: 5.0 sq. mi. Water area: 1.3 sq. mi.
Population density: 7,146 people per square mile
(high).
OSM Map
General Map
Google Map
MSN Map
OSM Map
General Map
Google Map
MSN Map
OSM Map
General Map
Google Map
MSN Map
OSM Map
General Map
Google Map
MSN Map
Please wait while loading the map...
Real estate property taxes paid for housing units in 2022:
This zip code:
0.6% ($6,400)
California:
0.7% ($4,831)
Median real estate property taxes paid for housing units with mortgages in 2022: $7,504 (0.7%) Median real estate property taxes paid for housing units with no mortgage in 2022: $4,120 (0.5%)
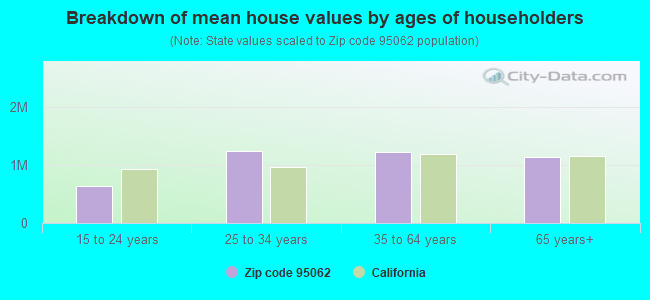
Estimated median house/condo value in 2022: $1,051,427
95062:
$1,051,427
California:
$715,900
According to our research of California and other state lists, there were 36 registered sex offenders living in 95062 zip code as of April 27, 2024. The ratio of all residents to sex offenders in zip code 95062 is 1,053 to 1. The ratio of registered sex offenders to all residents in this zip code is lower than the state average.
Median resident age:
This zip code:
42.2 years
California median age:
37.9 years
Average household size:
This zip code:
2.3 people
California:
2.8 people
Averages for the 2020 tax year for zip code 95062, filed in 2021:
Average Adjusted Gross Income (AGI) in 2020: $101,613 (Individual Income Tax Returns)
Here:
$101,613
State:
$95,910
Salary/wage: $80,528 (reported on 76.2% of returns)
Here:
$80,528
State:
$77,331
(% of AGI for various income ranges: 1233.7% for AGIs below $25k, 4150.4% for AGIs $25k-50k, 7330.6% for AGIs $50k-75k, 11107.2% for AGIs $75k-100k, 20124.4% for AGIs $100k-200k, 104305.5% for AGIs over 200k)
Taxable interest for individuals: $1,639 (reported on 38.4% of returns)
This zip code:
$1,639
California:
$2,294
(% of AGI for various income ranges: 28.1% for AGIs below $25k, 43.2% for AGIs $25k-50k, 60.9% for AGIs $50k-75k, 102.5% for AGIs $75k-100k, 197.0% for AGIs $100k-200k, 1080.0% for AGIs over 200k)
Ordinary dividends: $8,029 (reported on 28.5% of returns)
Here:
$8,029
State:
$10,949
(% of AGI for various income ranges: 67.8% for AGIs below $25k, 99.8% for AGIs $25k-50k, 185.2% for AGIs $50k-75k, 316.0% for AGIs $75k-100k, 654.5% for AGIs $100k-200k, 4940.2% for AGIs over 200k)
Net capital gain/loss in AGI: +$44,172 (reported on 27.0% of returns)
Here:
+$44,172
State:
+$49,306
(% of AGI for various income ranges: 24.8% for AGIs below $25k, 80.9% for AGIs $25k-50k, 195.9% for AGIs $50k-75k, 414.5% for AGIs $75k-100k, 948.1% for AGIs $100k-200k, 44112.7% for AGIs over 200k)
Profit/loss from business: +$20,570 (reported on 20.1% of returns)
Here:
+$20,570
State:
+$15,671
(% of AGI for various income ranges: 220.2% for AGIs below $25k, 403.9% for AGIs $25k-50k, 479.9% for AGIs $50k-75k, 779.9% for AGIs $75k-100k, 1174.6% for AGIs $100k-200k, 6126.6% for AGIs over 200k)
Taxable individual retirement arrangement distribution: $21,112 (reported on 9.3% of returns)
95062:
$21,112
California:
$23,505
(% of AGI for various income ranges: 64.8% for AGIs below $25k, 137.7% for AGIs $25k-50k, 235.9% for AGIs $50k-75k, 429.1% for AGIs $75k-100k, 888.9% for AGIs $100k-200k, 2190.9% for AGIs over 200k)
Self-employed (Keogh) retirement plans: $18,924 (reported on 1.6% of returns)
95062:
$18,924
California:
$30,163
(% of AGI for various income ranges: 12.6% for AGIs $25k-50k, 26.5% for AGIs $50k-75k, 46.1% for AGIs $75k-100k, 79.5% for AGIs $100k-200k, 706.4% for AGIs over 200k)
Total itemized deductions: $34,169 (reported on 15.9% of returns)
Here:
$34,169
State:
$39,517
(% of AGI for various income ranges: 158.6% for AGIs below $25k, 249.1% for AGIs $25k-50k, 506.9% for AGIs $50k-75k, 1032.2% for AGIs $75k-100k, 2106.6% for AGIs $100k-200k, 8899.3% for AGIs over 200k)
Charity contributions: $7,762 (reported on 12.4% of returns)
Here:
$7,762
State:
$12,598
(% of AGI for various income ranges: 5.4% for AGIs below $25k, 23.8% for AGIs $25k-50k, 38.4% for AGIs $50k-75k, 86.7% for AGIs $75k-100k, 202.0% for AGIs $100k-200k, 2798.9% for AGIs over 200k)
Taxes paid: $8,842 (reported on 15.7% of returns)
95062:
$8,842
State:
$8,807
(% of AGI for various income ranges: 29.9% for AGIs below $25k, 61.4% for AGIs $25k-50k, 142.9% for AGIs $50k-75k, 312.9% for AGIs $75k-100k, 618.3% for AGIs $100k-200k, 1932.7% for AGIs over 200k)
Earned income credit: $1,455 (reported on 8.5% of returns)
Here:
$1,455
State:
$2,074
(% of AGI for various income ranges: 53.3% for AGIs below $25k, 34.5% for AGIs $25k-50k)
Percentage of individuals using paid preparers for their 2020 taxes: 92.0%
Here:
92%
State:
92%
(% for various income ranges: 89.7% for AGIs below $25k, 91.2% for AGIs $25k-50k, 92.3% for AGIs $50k-75k, 92.8% for AGIs $75k-100k, 94.1% for AGIs $100k-200k, 95.4% for AGIs over 200k)
Averages for the 2012 tax year for zip code 95062, filed in 2013:
Average Adjusted Gross Income (AGI) in 2012: $62,311 (Individual Income Tax Returns)
Here:
$62,311
State:
$72,726
Salary/wage: $54,448 (reported on 80.3% of returns)
Here:
$54,448
State:
$59,079
(% of AGI for various income ranges: 71.4% for AGIs below $25k, 77.4% for AGIs $25k-50k, 74.5% for AGIs $50k-75k, 72.7% for AGIs $75k-100k, 75.0% for AGIs $100k-200k, 56.5% for AGIs over 200k)
Taxable interest for individuals: $1,633 (reported on 36.3% of returns)
This zip code:
$1,633
California:
$2,146
(% of AGI for various income ranges: 1.4% for AGIs below $25k, 0.8% for AGIs $25k-50k, 0.8% for AGIs $50k-75k, 0.9% for AGIs $75k-100k, 0.7% for AGIs $100k-200k, 1.2% for AGIs over 200k)
Ordinary dividends: $5,418 (reported on 23.2% of returns)
Here:
$5,418
State:
$9,308
(% of AGI for various income ranges: 2.3% for AGIs below $25k, 1.5% for AGIs $25k-50k, 1.7% for AGIs $50k-75k, 1.6% for AGIs $75k-100k, 1.8% for AGIs $100k-200k, 2.8% for AGIs over 200k)
Net capital gain/loss in AGI: +$12,619 (reported on 20.6% of returns)
Here:
+$12,619
State:
+$30,460
(% of AGI for various income ranges: 0.4% for AGIs $25k-50k, 0.7% for AGIs $50k-75k, 1.2% for AGIs $75k-100k, 2.0% for AGIs $100k-200k, 13.2% for AGIs over 200k)
Profit/loss from business: +$20,055 (reported on 20.7% of returns)
Here:
+$20,055
State:
+$17,064
(% of AGI for various income ranges: 12.7% for AGIs below $25k, 7.3% for AGIs $25k-50k, 6.3% for AGIs $50k-75k, 6.1% for AGIs $75k-100k, 5.0% for AGIs $100k-200k, 6.8% for AGIs over 200k)
Taxable individual retirement arrangement distribution: $16,724 (reported on 8.4% of returns)
95062:
$16,724
California:
$19,557
(% of AGI for various income ranges: 2.4% for AGIs below $25k, 1.9% for AGIs $25k-50k, 2.3% for AGIs $50k-75k, 2.9% for AGIs $75k-100k, 2.5% for AGIs $100k-200k, 1.8% for AGIs over 200k)
Self-employment retirement plans: $15,156 (reported on 1.5% of returns)
95062:
$15,156
California:
$24,530
(% of AGI for various income ranges: 0.2% for AGIs $25k-50k, 0.2% for AGIs $50k-75k, 0.4% for AGIs $75k-100k, 0.4% for AGIs $100k-200k, 0.6% for AGIs over 200k)
Total itemized deductions: $28,418 (24% of AGI, reported on 34.4% of returns)
Here:
$28,418
State:
$34,004
Here:
23.8% of AGI
State:
22.7% of AGI
(% of AGI for various income ranges: 12.8% for AGIs below $25k, 10.1% for AGIs $25k-50k, 15.0% for AGIs $50k-75k, 17.3% for AGIs $75k-100k, 18.3% for AGIs $100k-200k, 16.4% for AGIs over 200k)
Charity contributions: $2,599 (reported on 27.6% of returns)
Here:
$2,599
State:
$4,659
(% of AGI for various income ranges: 0.5% for AGIs below $25k, 0.6% for AGIs $25k-50k, 1.0% for AGIs $50k-75k, 1.3% for AGIs $75k-100k, 1.1% for AGIs $100k-200k, 1.7% for AGIs over 200k)
Taxes paid: $11,724 (reported on 34.2% of returns)
95062:
$11,724
State:
$14,448
(% of AGI for various income ranges: 2.7% for AGIs below $25k, 2.4% for AGIs $25k-50k, 4.2% for AGIs $50k-75k, 6.0% for AGIs $75k-100k, 7.9% for AGIs $100k-200k, 9.6% for AGIs over 200k)
Earned income credit: $1,571 (reported on 12.2% of returns)
Here:
$1,571
State:
$2,286
(% of AGI for various income ranges: 3.1% for AGIs below $25k, 0.5% for AGIs $25k-50k)
Percentage of individuals using paid preparers for their 2012 taxes: 54.4%
Here:
54%
State:
64%
(% for various income ranges: 49.0% for AGIs below $25k, 50.7% for AGIs $25k-50k, 56.3% for AGIs $50k-75k, 61.0% for AGIs $75k-100k, 63.1% for AGIs $100k-200k, 76.8% for AGIs over 200k)
Averages for the 2004 tax year for zip code 95062, filed in 2005:
Average Adjusted Gross Income (AGI) in 2004: $50,059 (Individual Income Tax Returns)
Here:
$50,059
State:
$58,600
Salary/wage: $44,717 (reported on 80.8% of returns)
Here:
$44,717
State:
$49,455
(% of AGI for various income ranges: 153.4% for AGIs below $10k, 73.6% for AGIs $10k-25k, 80.7% for AGIs $25k-50k, 79.5% for AGIs $50k-75k, 78.8% for AGIs $75k-100k, 61.4% for AGIs over 100k)
Taxable interest for individuals: $1,960 (reported on 46.2% of returns)
This zip code:
$1,960
California:
$2,365
(% of AGI for various income ranges: 12.9% for AGIs below $10k, 2.5% for AGIs $10k-25k, 1.4% for AGIs $25k-50k, 1.5% for AGIs $50k-75k, 1.5% for AGIs $75k-100k, 1.8% for AGIs over 100k)
Taxable dividends: $3,667 (reported on 26.0% of returns)
Here:
$3,667
State:
$4,746
(% of AGI for various income ranges: 10.3% for AGIs below $10k, 2.0% for AGIs $10k-25k, 1.4% for AGIs $25k-50k, 1.3% for AGIs $50k-75k, 1.5% for AGIs $75k-100k, 2.3% for AGIs over 100k)
Net capital gain/loss: +$16,273 (reported on 22.9% of returns)
Here:
+$16,273
State:
+$23,418
(% of AGI for various income ranges: -4.0% for AGIs below $10k, 0.3% for AGIs $10k-25k, 1.0% for AGIs $25k-50k, 0.8% for AGIs $50k-75k, 2.0% for AGIs $75k-100k, 16.1% for AGIs over 100k)
Profit/loss from business: +$16,947 (reported on 21.1% of returns)
Here:
+$16,947
State:
+$16,826
(% of AGI for various income ranges: 17.4% for AGIs below $10k, 11.0% for AGIs $10k-25k, 7.5% for AGIs $25k-50k, 7.3% for AGIs $50k-75k, 6.9% for AGIs $75k-100k, 6.1% for AGIs over 100k)
IRA payment deduction: $3,033 (reported on 3.6% of returns)
95062:
$3,033
California:
$3,192
(% of AGI for various income ranges: 1.1% for AGIs below $10k, 0.3% for AGIs $10k-25k, 0.4% for AGIs $25k-50k, 0.2% for AGIs $50k-75k, 0.3% for AGIs $75k-100k, 0.1% for AGIs over 100k)
Self-employed pension: $11,991 (reported on 2.1% of returns)
Here:
$11,991
California:
$17,688
(% of AGI for various income ranges: 0.4% for AGIs below $10k, 0.1% for AGIs $10k-25k, 0.3% for AGIs $25k-50k, 0.4% for AGIs $50k-75k, 0.5% for AGIs $75k-100k, 0.7% for AGIs over 100k)
Total itemized deductions: $24,863 (27% of AGI, reported on 36.2% of returns)
Here:
$24,863
State:
$28,113
Here:
26.6% of AGI
State:
25.3% of AGI
(% of AGI for various income ranges: 43.1% for AGIs below $10k, 13.1% for AGIs $10k-25k, 14.3% for AGIs $25k-50k, 18.4% for AGIs $50k-75k, 21.3% for AGIs $75k-100k, 18.7% for AGIs over 100k)
Charity contributions deductions: $2,427 (2% of AGI, reported on 31.4% of returns)
Here:
$2,427
State:
$3,923
Here:
2.5% of AGI
State:
3.3% of AGI
(% of AGI for various income ranges: 1.5% for AGIs below $10k, 0.8% for AGIs $10k-25k, 0.9% for AGIs $25k-50k, 1.4% for AGIs $50k-75k, 1.6% for AGIs $75k-100k, 1.9% for AGIs over 100k)
Total tax: $7,965 (reported on 79.8% of returns)
95062:
$7,965
State:
$10,761
(% of AGI for various income ranges: 8.9% for AGIs below $10k, 5.5% for AGIs $10k-25k, 8.5% for AGIs $25k-50k, 10.7% for AGIs $50k-75k, 11.5% for AGIs $75k-100k, 17.1% for AGIs over 100k)
Earned income credit: $1,263 (reported on 10.9% of returns)
Here:
$1,263
State:
$1,763
Percentage of individuals using paid preparers for their 2004 taxes: 56.4%
Here:
56%
State:
66%
(% for various income ranges: 47.5% for AGIs below $10k, 53.5% for AGIs $10k-25k, 53.8% for AGIs $25k-50k, 61.5% for AGIs $50k-75k, 63.8% for AGIs $75k-100k, 72.4% for AGIs over 100k)
Likely homosexual households (counted as self-reported same-sex unmarried-partner households)
Lesbian couples: 0.4% of all households
Gay men: 0.2% of all households
Household received Food Stamps/SNAP in the past 12 months: 1,383 Household did not receive Food Stamps/SNAP in the past 12 months: 13,779
Women who had a birth in the past 12 months: 520 (384 now married, 135 unmarried) Women who did not have a birth in the past 12 months: 8,722 (3,046 now married, 5,692 unmarried)
Housing units in zip code 95062 with a mortgage: 5,184 (534 second mortgage, 461 both second mortgage and home equity loan) Houses without a mortgage: 126
Median monthly owner costs for units with a mortgage: $3,003 Median monthly owner costs for units without a mortgage: $795
Residents with income below the poverty level in 2022:
This zip code:
13.8%
Whole state:
12.2%
Residents with income below 50% of the poverty level in 2022:
This zip code:
6.1%
Whole state:
6.2%
Median number of rooms in houses and condos:
Here:
5.1
State:
6.0
Median number of rooms in apartments:
Here:
3.9
State:
3.9
Notable locations in this zip code not listed on our city pages
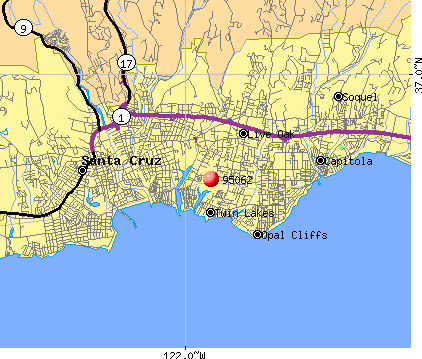
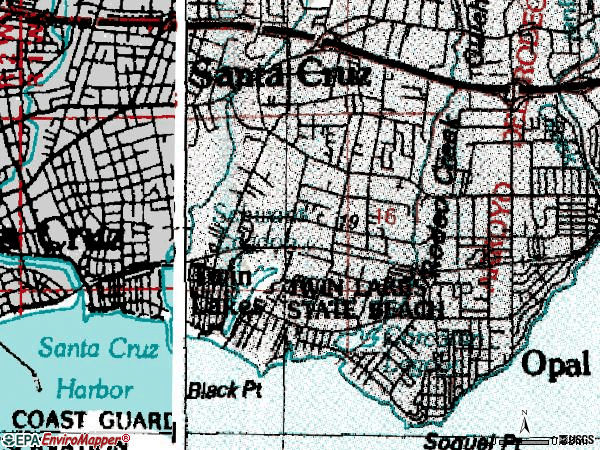
Notable locations in zip code 95062: Opal Cliffs Drive Overlook (A), Santa Cruz City Museum (B), Capitola Chamber of Commerce (C), Advent Christian Conference Center (D), Roy C Kepler Library on Nonviolence and Social Change (E), Branciforte Branch Santa Cruz City-County Library (F), Live Oak Branch Santa Cruz City-County Library (G), Dominican Rehabilitation Center (H), Santa Cruz Fire Department Station 2 (I), Central Fire Protection District of Santa Cruz County Station 1 (J). Display/hide their locations on the map
Shopping Centers: Shadowbrook Shopping Center (1), Kings Plaza Shopping Center (2), East Cliff Village Shopping Center (3), Aptos Center Shopping Center (4). Display/hide their locations on the map
Churches in zip code 95062 include: Kingdom Hall of Jehovahs Witnesses (A), Santa Cruz Bible Church (B), Star of the Sea Church (C), Central Presbyterian Church (D), Church In Santa Cruz (E), First Foursquare Church (F), Grace United Methodist Church (G), Landmark Missionary Baptist Church (H), Seventh Day Adventist Church (I). Display/hide their locations on the map
Parks in zip code 95062 include: Twin Lakes State Beach (1), Frederick Street Park (2), Oceanview Park (3), Tyrre Park (4), Twin Lakes State Beach (5), Eastside Park (6), Brommer Park (7), Coffee Lane Park (8), Fourtyfirst Avenue County Park (9). Display/hide their locations on the map
3,581 married couples with children.
1,387 single-parent households (335 men, 1,052 women).
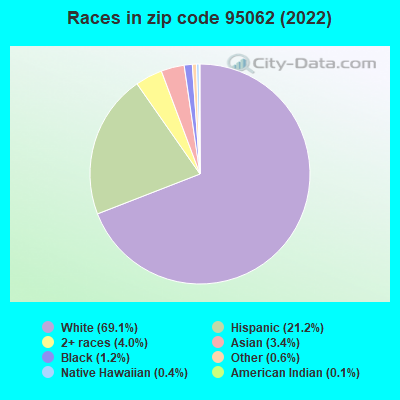
78.7% of residents of 95062 zip code speak English at home.
14.2% of residents speak Spanish at home (60% very well, 23% well, 12% not well, 4% not at all).
3.7% of residents speak other Indo-European language at home (78% very well, 20% well, 2% not well).
2.7% of residents speak Asian or Pacific Island language at home (60% very well, 28% well, 9% not well, 3% not at all).
0.4% of residents speak other language at home (73% very well, 20% well, 6% not well).
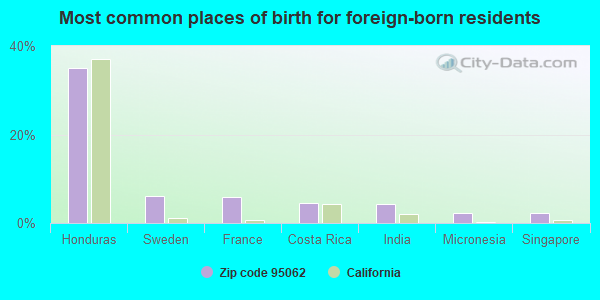
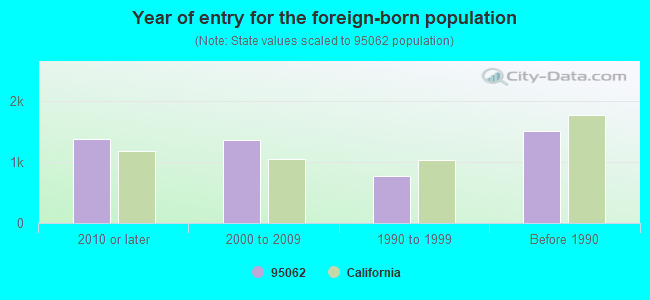
Foreign born population: 4,213 (11.7%) (43.7% of them are naturalized citizens)
Major facilities with environmental interests located in this zip code:
CHEVRON STATION 90499 (404 SOQUEL AVE in SANTA CRUZ, CA)
STATE MASTER (California - Hazardous Waste Tracking) - HAZARDOU WASTE PROGRAM CRITERIA AND HAZARDOUS AIR POLLUTANT INVENTORY (Inventory of air pollution sources) Small Quantity Generators, between 100 kg and 1000 kg of hazardous waste/month (Resource Conservation and Recovery Act (tracking hazardous waste)) - notification Business SIC classification: GASOLINE SERVICE STATIONS Organizations: CHEVRON PRODUCTS CO (CONTACT/OWNER)
Alternative names: CHEVRON PRODUCTS COMPANY, OCEAN STREET CHEVRON
MISSION PRINTERS (522 SOQUEL AVE in SANTA CRUZ, CA)
STATE MASTER (California - Hazardous Waste Tracking) - HAZARDOU WASTE PROGRAM Large Quantity Generators, more that 1000 kg of hazardous waste/month (Resource Conservation and Recovery Act (tracking hazardous waste)) - notification Organizations: PAUL COUCHMAN (CONTACT/OWNER)
CARMAT COLLISION CTR (1650 MANSFIELD ST in SANTA CRUZ, CA)
STATE MASTER (California - Hazardous Waste Tracking) - HAZARDOU WASTE PROGRAM (Resource Conservation and Recovery Act (tracking hazardous waste)) Organizations: MATTHEW KOUE (CONTACT/OWNER)
M & H PERFORMANCE INC (2852 A SOQUEL AVE in SANTA CRUZ, CA)
STATE MASTER (California - Hazardous Waste Tracking) - HAZARDOU WASTE PROGRAM Small Quantity Generators, between 100 kg and 1000 kg of hazardous waste/month (Resource Conservation and Recovery Act (tracking hazardous waste)) Business NAICS classification: GENERAL AUTOMOTIVE REPAIR.
CATALPA STREET GARAGE (2844 SOQUEL AVE in SANTA CRUZ, CA)
STATE MASTER (California - Hazardous Waste Tracking) - HAZARDOU WASTE PROGRAM Small Quantity Generators, between 100 kg and 1000 kg of hazardous waste/month (Resource Conservation and Recovery Act (tracking hazardous waste)) - notification Organizations: WAYNE STRONG (CONTACT/OWNER)
ALTERNATIVE FAMILY EDUCATION (AFE) (300 LA FONDA AVE. in SANTA CRUZ, CA)
(National Center for Education Statistics) - STATE ID-4430195 Organizations: SANTA CRUZ CITY HIGH (SCHOOL DISTRICT)
GAULT ELEMENTARY (1320 SEABRIGHT AVE. in SANTA CRUZ, CA)
(National Center for Education Statistics) - STATE ID-6049894 Organizations: SANTA CRUZ CITY ELEMENTARY (SCHOOL DISTRICT)
GREEN ACRES ELEMENTARY (966 BOSTWICK LANE in SANTA CRUZ, CA)
(National Center for Education Statistics) - STATE ID-6049597 Organizations: LIVE OAK ELEMENTARY (SCHOOL DISTRICT)
HARBOR HIGH (300 LAFONDA AVE. in SANTA CRUZ, CA)
(National Center for Education Statistics) - STATE ID-4432340 Organizations: SANTA CRUZ CITY HIGH (SCHOOL DISTRICT)
LIVE OAK ELEMENTARY (1916 CAPITOLA ROAD in SANTA CRUZ, CA)
(National Center for Education Statistics) - STATE ID-6049605
LOMA PRIETA HIGH (CONT.) (319 LAFONDA AVE. in SANTA CRUZ, CA)
(National Center for Education Statistics) - STATE ID-4436960 Organizations: SANTA CRUZ CITY HIGH (SCHOOL DISTRICT)
HARBOR SHELL (705 CAPITOLA ROAD in SANTA CRUZ, CA)
CRITERIA AND HAZARDOUS AIR POLLUTANT INVENTORY (Inventory of air pollution sources) Small Quantity Generators, between 100 kg and 1000 kg of hazardous waste/month (Resource Conservation and Recovery Act (tracking hazardous waste)) - notification Business SIC classification: GASOLINE SERVICE STATIONS Organizations: EQUILON ENTERPRISES L L C (CONTACT/OWNER)
Alternative names: SHELL SERVICE STATION, SHELL SERV STATION SANTA CRUZ
HASHIMOTO TOYOTA AUTO REPAIR (1005 WATER ST in SANTA CRUZ, CA)
Small Quantity Generators, between 100 kg and 1000 kg of hazardous waste/month (Resource Conservation and Recovery Act (tracking hazardous waste)) - notification Organizations: CALVIN SAKAE HASHIMOTO (CONTACT/OWNER)
Housing units lacking complete plumbing facilities: 0.8% Housing units lacking complete kitchen facilities: 1.4%
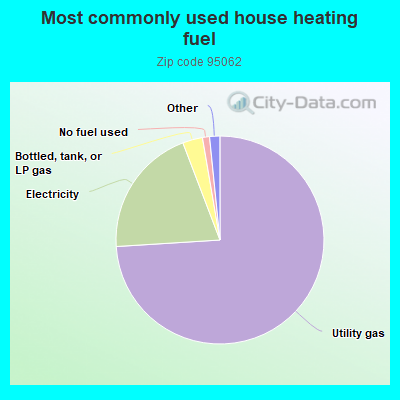
74.0%Utility gas
20.2%Electricity
3.1%Bottled, tank, or LP gas
1.1%No fuel used
0.7%Solar energy
0.7%Wood
Population in 1990: 34,287. Population change in the 1990s: +2,333 (+6.8%).
Place of birth for U.S.-born residents:
This state: 21,659
Northeast: 2,873
Midwest: 2,750
South: 2,009
West: 1,634
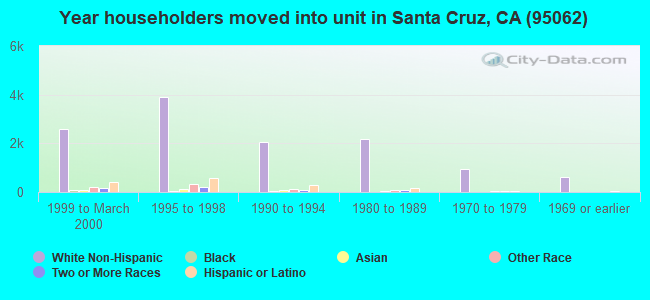
46% of the 95062 zip code residents lived in the same house 5 years ago. Out of people who lived in different houses, 63% lived in this county. Out of people who lived in different counties, 50% lived in California.
84% of the 95062 zip code residents lived in the same house 1 year ago. Out of people who lived in different houses, 50% moved from this county. Out of people who lived in different houses, 34% moved from different county within same state. Out of people who lived in different houses, 8% moved from different state. Out of people who lived in different houses, 5% moved from abroad.
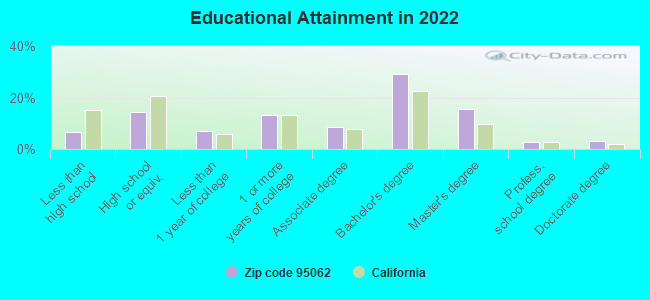
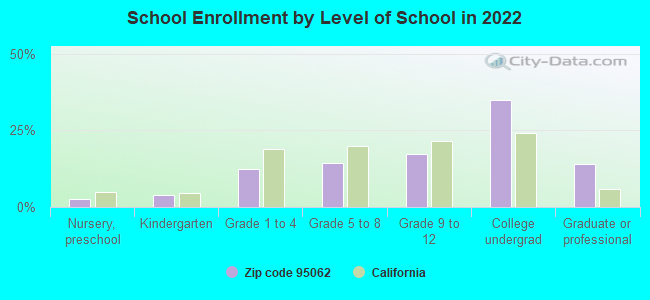
Private vs. public school enrollment:
Students in private schools in grades 1 to 8 (elementary and middle school): 295
Here:
13.2%
California:
10.5%
Students in private schools in grades 9 to 12 (high school): 8
Here:
0.6%
California:
8.5%
Students in private undergraduate colleges: 268
Here:
9.3%
California:
15.9%
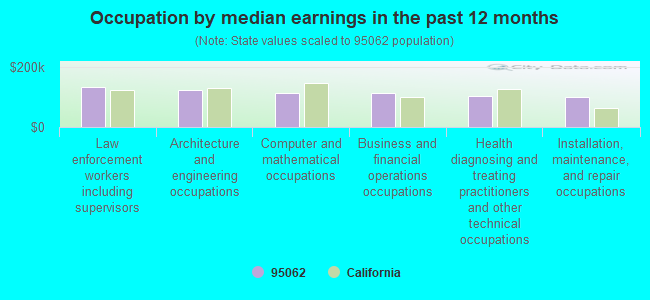
Occupation by median earnings in the past 12 months ($)
135,345Law enforcement workers including supervisors
124,864Architecture and engineering occupations
114,881Computer and mathematical occupations
112,614Business and financial operations occupations
105,211Health diagnosing and treating practitioners and other technical occupations
99,913Installation, maintenance, and repair occupations
Companies with federal contracts located in this zip code (SANTA CRUZ, CA):
GRAPHON CORPORATION (5400 SOQUEL AVE , SUITE A-; small business) : $123,092 in 13 contractsfrom 2001 to 2005
Contracts for ADP Software, Other Management Support Services, Miscellaneous Items, Installation of Equipment -- Automatic Data Processing Equipment (Including Firmware), Software, Supplies and Support Equipment, and moreby Department of Defense, Navy, Defense Information Systems Agency, Army, and others Signed by year:2000: $0; 2001: $0; 2002: $0; 2003: $27,600; 2004: $60,169; 2005: $35,323; 2006: $0.
Biggest contracts:
$217,600 with Department of Defense for ADP Software. Signed on 2001-07-30. Completion date: 2002-07-30.
$28,723 with Navy for ADP Software. Signed on 2005-12-28. Completion date: 2006-01-01.
$27,600, same as above.Signed on 2003-09-25. Completion date: 2003-10-31.
$18,325 with Defense Information Systems Agency for Other Management Support Services. Signed on 2004-07-28. Completion date: 2005-07-27.
PROVAC SALES, INC (2535 7TH AVE STE 4; small business) : $108,461 in 6 contractsfrom 2004 to 2006
Contracts for Compressors and Vacuum Pumps, Laboratory Equipment and Supplies, , Miscellaneous Aircraft Accessories and Components, and moreby NASA, National Oceanic and Atmospheric Administration/Under Secretary for Oceans and Atmosphere, Navy Signed by year:2000: $0; 2001: $0; 2002: $0; 2003: $0; 2004: $9,985; 2005: $91,101; 2006: $7,375.
Biggest contracts:
$67,245 with NASA for Compressors and Vacuum Pumps. Signed on 2005-08-17. Completion date: 2005-09-30.
$15,500 with National Oceanic and Atmospheric Administration/Under Secretary for Oceans and Atmosphere for Laboratory Equipment and Supplies. Signed on 2005-04-05. Completion date: 2005-04-15.
$9,985 with NASA for . Signed on 2004-09-17. Completion date: 2004-09-27.
$8,356 with NASA for Compressors and Vacuum Pumps. Signed on 2005-07-13. Completion date: 2005-08-05.
MARCUS FEARNEHOUGH (705 NO BRANCIFORTE AVE; small business) : $54,124 in 4 contractsfrom 2000 to 2003
$27,456 with Army for Lease or Rental of Equipment -- Service and Trade Equipment. Signed on 2000-10-01. Completion date: 2001-09-30.
$21,869, same as above.Signed on 2002-11-26. Completion date: 2003-09-30.
$4,339, same as above.Signed on 2002-10-18. Completion date: 2003-09-30.
$460, same as above.Signed on 2003-08-04. Completion date: 2003-09-30.
BECKMANNS OLD WORLD BAKERY LTD (104 BRONSON ST STE 6; small business) : $50,827 in 6 contractsfrom 2004 to 2006
Contracts for Food Items For Resale by Defense Commissary Agency Signed by year:2000: $0; 2001: $0; 2002: $0; 2003: $0; 2004: $9,141; 2005: $27,783; 2006: $13,903.
Biggest contracts:
$13,903 with Defense Commissary Agency for Food Items For Resale. Signed on 2006-01-01. Completion date: 2006-03-31.
$12,143, same as above.Signed on 2005-04-01. Completion date: 2005-08-31.
$9,141, same as above.Signed on 2004-10-01. Completion date: 2005-02-28.
$8,236, same as above.Signed on 2005-10-01. Completion date: 2005-12-31.
TAYLOR, SHARON L (2210 LAGOON CT)
$31,253 with Defense Logistics Agency for Semiconductor Devices and Associated Hardware. Signed on 2000-07-21. Completion date: 2001-07-30.
CRESTOR INC (23 ROCKVIEW DRIVE; small business) : $15,885 in 4 contractsfrom 2003 to 2006
$5,388 with Navy for Signs, Advertising Displays, and Identification Plates. Signed on 2006-01-20. Completion date: 2006-02-24.
$3,947, same as above.Signed on 2005-03-29. Completion date: 2005-04-29.
$3,903, same as above.Signed on 2006-01-23. Completion date: 2006-02-27.
$2,647, same as above.Signed on 2003-02-28. Completion date: 2003-03-31.
MOORE & SONS MOTORCYCLE (21431 E CLIFF DR; small business)
$13,360 with Army for Motorcycles, Motor Scooters, and Bicycles. Signed on 2004-08-31. Completion date: 2004-10-28.
WAREHOUSE DRIECT INTERIORS INC (1001 SOQUEL AVE; small business) : $13,232 in 2 contractsfrom 2003 to 2004
$9,852 with Navy for Maintenance, Repair or Alteration of Real Property -- Miscellaneous Buildings. Signed on 2004-08-04. Completion date: 2004-08-30.
$3,380 with Navy for Carpet Laying and Cleaning. Signed on 2003-03-27. Completion date: 2003-05-30.
REMEDIATION RISK MANAGEMENT, I (2560 SOQUEL AVENUE; small business)
$4,800 with Army for Other Quality Control, Testing and Inspection Services -- Miscellaneous. Signed on 2005-12-15. Completion date: 2005-12-30.
WESTEK ELECTRONICS, INC (2450 17TH AVENUE; small business)
$0 with Defense Logistics Agency for Fiber Optic Cables. Signed on 2002-09-25. Completion date: 2004-09-25.
Top industries in this zip code by the number of employees in 2005:
Health Care and Social Assistance: Nursing Care Facilities (100-249 employees: 3 establishments, 20-49 employees: 1 establishment)
2005 - 2018 National Fire Incident Reporting System (NFIRS) incidents
Based on the data from the years 2005 - 2018 the average number of fire incidents per year is 63. The highest number of fires - 141 took place in 2010, and the least - 0 in 2006. The data has a rising trend.
When looking into fire subcategories, the most incidents belonged to: Outside Fires (41.5%), and Structure Fires (37.3%).
Fire incident types reported to NFIRS in Zip Code 95062


 Nearest zip codes: 95010, 95065, 95064, 95073, 95066, 95041.


 Based on the data from the years 2005 - 2018 the average number of fire incidents per year is 63. The highest number of fires - 141 took place in 2010, and the least - 0 in 2006. The data has a rising trend.
 When looking into fire subcategories, the most incidents belonged to: Outside Fires (41.5%), and Structure Fires (37.3%).