Estimated zip code population in 2022: 32,758 Zip code population in 2010: 30,918 Zip code population in 2000: 26,038
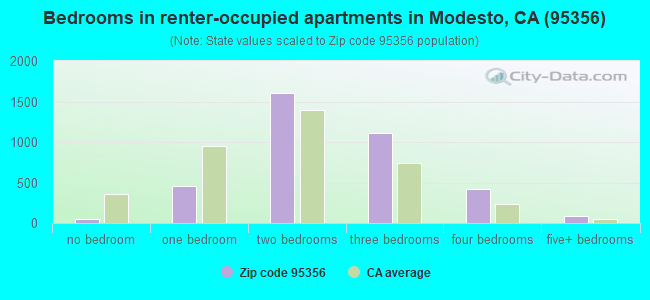
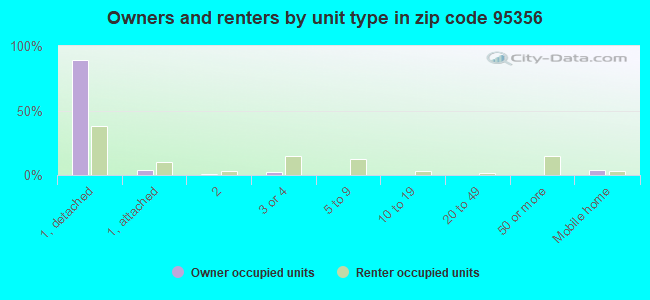
Houses and condos: 11,791 Renter-occupied apartments: 3,743
% of renters here:
33%
State:
44%
March 2022 cost of living index in zip code 95356: 98.7 (near average, U.S. average is 100)
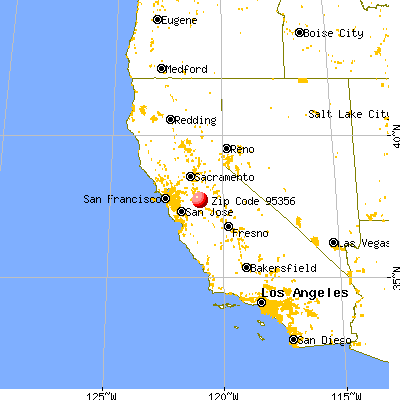
Land area: 21.4 sq. mi. Water area: 1.2 sq. mi.
Population density: 1,532 people per square mile
(low).
OSM Map
General Map
Google Map
MSN Map
OSM Map
General Map
Google Map
MSN Map
OSM Map
General Map
Google Map
MSN Map
OSM Map
General Map
Google Map
MSN Map
Please wait while loading the map...
Real estate property taxes paid for housing units in 2022:
This zip code:
0.8% ($3,807)
California:
0.7% ($4,831)
Median real estate property taxes paid for housing units with mortgages in 2022: $4,285 (0.8%) Median real estate property taxes paid for housing units with no mortgage in 2022: $3,021 (0.7%)
Averages for the 2020 tax year for zip code 95356, filed in 2021:
Average Adjusted Gross Income (AGI) in 2020: $89,548 (Individual Income Tax Returns)
Here:
$89,548
State:
$95,910
Salary/wage: $72,378 (reported on 79.9% of returns)
Here:
$72,378
State:
$77,331
(% of AGI for various income ranges: 1200.9% for AGIs below $25k, 3811.8% for AGIs $25k-50k, 7177.8% for AGIs $50k-75k, 10789.0% for AGIs $75k-100k, 20475.0% for AGIs $100k-200k, 118861.5% for AGIs over 200k)
Taxable interest for individuals: $2,211 (reported on 36.8% of returns)
This zip code:
$2,211
California:
$2,294
(% of AGI for various income ranges: 11.5% for AGIs below $25k, 28.5% for AGIs $25k-50k, 46.9% for AGIs $50k-75k, 90.8% for AGIs $75k-100k, 169.9% for AGIs $100k-200k, 3049.6% for AGIs over 200k)
Ordinary dividends: $11,286 (reported on 16.8% of returns)
Here:
$11,286
State:
$10,949
(% of AGI for various income ranges: 26.5% for AGIs below $25k, 38.5% for AGIs $25k-50k, 86.1% for AGIs $50k-75k, 148.9% for AGIs $75k-100k, 377.5% for AGIs $100k-200k, 7787.3% for AGIs over 200k)
Net capital gain/loss in AGI: +$30,113 (reported on 17.1% of returns)
Here:
+$30,113
State:
+$49,306
(% of AGI for various income ranges: 22.8% for AGIs below $25k, 38.8% for AGIs $25k-50k, 65.4% for AGIs $50k-75k, 212.2% for AGIs $75k-100k, 614.6% for AGIs $100k-200k, 25941.5% for AGIs over 200k)
Profit/loss from business: +$19,643 (reported on 16.1% of returns)
Here:
+$19,643
State:
+$15,671
(% of AGI for various income ranges: 106.9% for AGIs below $25k, 226.6% for AGIs $25k-50k, 302.0% for AGIs $50k-75k, 355.3% for AGIs $75k-100k, 794.2% for AGIs $100k-200k, 8767.3% for AGIs over 200k)
Taxable individual retirement arrangement distribution: $19,512 (reported on 7.4% of returns)
95356:
$19,512
California:
$23,505
(% of AGI for various income ranges: 55.3% for AGIs below $25k, 80.7% for AGIs $25k-50k, 190.4% for AGIs $50k-75k, 343.5% for AGIs $75k-100k, 540.0% for AGIs $100k-200k, 2311.2% for AGIs over 200k)
Self-employed (Keogh) retirement plans: $31,092 (reported on 0.8% of returns)
95356:
$31,092
California:
$30,163
(% of AGI for various income ranges: 33.4% for AGIs $100k-200k, 1279.6% for AGIs over 200k)
Total itemized deductions: $37,738 (reported on 14.1% of returns)
Here:
$37,738
State:
$39,517
(% of AGI for various income ranges: 65.8% for AGIs below $25k, 159.2% for AGIs $25k-50k, 474.9% for AGIs $50k-75k, 902.2% for AGIs $75k-100k, 1831.8% for AGIs $100k-200k, 14858.5% for AGIs over 200k)
Charity contributions: $13,053 (reported on 11.7% of returns)
Here:
$13,053
State:
$12,598
(% of AGI for various income ranges: 4.5% for AGIs below $25k, 21.0% for AGIs $25k-50k, 73.5% for AGIs $50k-75k, 147.9% for AGIs $75k-100k, 372.4% for AGIs $100k-200k, 6143.5% for AGIs over 200k)
Taxes paid: $8,266 (reported on 14.1% of returns)
95356:
$8,266
State:
$8,807
(% of AGI for various income ranges: 11.4% for AGIs below $25k, 30.9% for AGIs $25k-50k, 119.9% for AGIs $50k-75k, 260.6% for AGIs $75k-100k, 556.3% for AGIs $100k-200k, 2280.4% for AGIs over 200k)
Earned income credit: $2,009 (reported on 13.5% of returns)
Here:
$2,009
State:
$2,074
(% of AGI for various income ranges: 80.2% for AGIs below $25k, 74.3% for AGIs $25k-50k, 1.8% for AGIs $50k-75k)
Percentage of individuals using paid preparers for their 2020 taxes: 93.5%
Here:
94%
State:
92%
(% for various income ranges: 92.3% for AGIs below $25k, 93.4% for AGIs $25k-50k, 94.8% for AGIs $50k-75k, 92.7% for AGIs $75k-100k, 93.9% for AGIs $100k-200k, 96.4% for AGIs over 200k)
Averages for the 2012 tax year for zip code 95356, filed in 2013:
Average Adjusted Gross Income (AGI) in 2012: $74,117 (Individual Income Tax Returns)
Here:
$74,117
State:
$72,726
Salary/wage: $59,348 (reported on 82.4% of returns)
Here:
$59,348
State:
$59,079
(% of AGI for various income ranges: 72.1% for AGIs below $25k, 77.5% for AGIs $25k-50k, 76.8% for AGIs $50k-75k, 72.4% for AGIs $75k-100k, 74.9% for AGIs $100k-200k, 50.3% for AGIs over 200k)
Taxable interest for individuals: $3,574 (reported on 38.6% of returns)
This zip code:
$3,574
California:
$2,146
(% of AGI for various income ranges: 0.8% for AGIs below $25k, 0.6% for AGIs $25k-50k, 0.6% for AGIs $50k-75k, 0.6% for AGIs $75k-100k, 0.6% for AGIs $100k-200k, 4.0% for AGIs over 200k)
Ordinary dividends: $7,614 (reported on 17.1% of returns)
Here:
$7,614
State:
$9,308
(% of AGI for various income ranges: 1.3% for AGIs below $25k, 1.2% for AGIs $25k-50k, 1.0% for AGIs $50k-75k, 1.0% for AGIs $75k-100k, 1.1% for AGIs $100k-200k, 2.9% for AGIs over 200k)
Net capital gain/loss in AGI: +$15,373 (reported on 15.5% of returns)
Here:
+$15,373
State:
+$30,460
(% of AGI for various income ranges: 0.2% for AGIs $50k-75k, 0.6% for AGIs $75k-100k, 1.1% for AGIs $100k-200k, 7.9% for AGIs over 200k)
Profit/loss from business: +$22,341 (reported on 15.2% of returns)
Here:
+$22,341
State:
+$17,064
(% of AGI for various income ranges: 9.5% for AGIs below $25k, 5.7% for AGIs $25k-50k, 3.0% for AGIs $50k-75k, 3.8% for AGIs $75k-100k, 4.5% for AGIs $100k-200k, 4.3% for AGIs over 200k)
Taxable individual retirement arrangement distribution: $17,926 (reported on 8.7% of returns)
95356:
$17,926
California:
$19,557
(% of AGI for various income ranges: 2.1% for AGIs below $25k, 2.2% for AGIs $25k-50k, 2.5% for AGIs $50k-75k, 2.8% for AGIs $75k-100k, 2.7% for AGIs $100k-200k, 1.3% for AGIs over 200k)
Self-employment retirement plans: $27,862 (reported on 1.0% of returns)
95356:
$27,862
California:
$24,530
(% of AGI for various income ranges: 0.3% for AGIs $25k-50k, 0.5% for AGIs $100k-200k, 0.6% for AGIs over 200k)
Total itemized deductions: $31,087 (22% of AGI, reported on 38.5% of returns)
Here:
$31,087
State:
$34,004
Here:
21.7% of AGI
State:
22.7% of AGI
(% of AGI for various income ranges: 9.4% for AGIs below $25k, 11.2% for AGIs $25k-50k, 15.1% for AGIs $50k-75k, 16.8% for AGIs $75k-100k, 18.8% for AGIs $100k-200k, 17.1% for AGIs over 200k)
Charity contributions: $4,786 (reported on 32.9% of returns)
Here:
$4,786
State:
$4,659
(% of AGI for various income ranges: 0.7% for AGIs below $25k, 1.1% for AGIs $25k-50k, 2.0% for AGIs $50k-75k, 2.3% for AGIs $75k-100k, 2.6% for AGIs $100k-200k, 2.3% for AGIs over 200k)
Taxes paid: $13,144 (reported on 38.2% of returns)
95356:
$13,144
State:
$14,448
(% of AGI for various income ranges: 1.6% for AGIs below $25k, 2.7% for AGIs $25k-50k, 3.8% for AGIs $50k-75k, 5.1% for AGIs $75k-100k, 7.2% for AGIs $100k-200k, 10.1% for AGIs over 200k)
Earned income credit: $2,149 (reported on 17.5% of returns)
Here:
$2,149
State:
$2,286
(% of AGI for various income ranges: 6.4% for AGIs below $25k, 1.2% for AGIs $25k-50k)
Percentage of individuals using paid preparers for their 2012 taxes: 60.2%
Here:
60%
State:
64%
(% for various income ranges: 54.1% for AGIs below $25k, 56.9% for AGIs $25k-50k, 63.0% for AGIs $50k-75k, 63.8% for AGIs $75k-100k, 67.3% for AGIs $100k-200k, 83.1% for AGIs over 200k)
Averages for the 2004 tax year for zip code 95356, filed in 2005:
Average Adjusted Gross Income (AGI) in 2004: $71,316 (Individual Income Tax Returns)
Here:
$71,316
State:
$58,600
Salary/wage: $52,584 (reported on 84.4% of returns)
Here:
$52,584
State:
$49,455
(% of AGI for various income ranges: 75.1% for AGIs $10k-25k, 81.0% for AGIs $25k-50k, 81.5% for AGIs $50k-75k, 81.9% for AGIs $75k-100k, 48.0% for AGIs over 100k)
Taxable interest for individuals: $2,970 (reported on 49.0% of returns)
This zip code:
$2,970
California:
$2,365
(% of AGI for various income ranges: 2.3% for AGIs $10k-25k, 1.2% for AGIs $25k-50k, 1.2% for AGIs $50k-75k, 0.9% for AGIs $75k-100k, 2.4% for AGIs over 100k)
Taxable dividends: $3,394 (reported on 22.2% of returns)
Here:
$3,394
State:
$4,746
(% of AGI for various income ranges: 1.3% for AGIs $10k-25k, 0.8% for AGIs $25k-50k, 0.7% for AGIs $50k-75k, 0.5% for AGIs $75k-100k, 1.2% for AGIs over 100k)
Net capital gain/loss: +$25,694 (reported on 19.9% of returns)
Here:
+$25,694
State:
+$23,418
(% of AGI for various income ranges: 0.6% for AGIs $10k-25k, 0.4% for AGIs $25k-50k, 1.0% for AGIs $50k-75k, 1.7% for AGIs $75k-100k, 11.2% for AGIs over 100k)
Profit/loss from business: +$25,555 (reported on 15.7% of returns)
Here:
+$25,555
State:
+$16,826
(% of AGI for various income ranges: 6.0% for AGIs $10k-25k, 4.9% for AGIs $25k-50k, 3.6% for AGIs $50k-75k, 5.3% for AGIs $75k-100k, 6.0% for AGIs over 100k)
Profit/loss from farming: +$3,550 (reported on 1.0% of returns)
Here:
+$3,550
State:
-$7,562
(% of AGI for various income ranges: -0.1% for AGIs $25k-50k, 0.1% for AGIs $50k-75k, 0.1% for AGIs over 100k)
IRA payment deduction: $3,345 (reported on 2.6% of returns)
95356:
$3,345
California:
$3,192
(% of AGI for various income ranges: 0.2% for AGIs $10k-25k, 0.2% for AGIs $25k-50k, 0.2% for AGIs $50k-75k, 0.2% for AGIs $75k-100k, 0.1% for AGIs over 100k)
Self-employed pension: $21,740 (reported on 1.6% of returns)
Here:
$21,740
California:
$17,688
(% of AGI for various income ranges: 0.1% for AGIs $25k-50k, 0.1% for AGIs $50k-75k, 0.1% for AGIs $75k-100k, 0.7% for AGIs over 100k)
Total itemized deductions: $28,583 (22% of AGI, reported on 45.6% of returns)
Here:
$28,583
State:
$28,113
Here:
22.1% of AGI
State:
25.3% of AGI
(% of AGI for various income ranges: 14.7% for AGIs $10k-25k, 18.2% for AGIs $25k-50k, 22.0% for AGIs $50k-75k, 23.4% for AGIs $75k-100k, 16.5% for AGIs over 100k)
Charity contributions deductions: $4,820 (4% of AGI, reported on 40.7% of returns)
Here:
$4,820
State:
$3,923
Here:
3.5% of AGI
State:
3.3% of AGI
(% of AGI for various income ranges: 1.2% for AGIs $10k-25k, 1.8% for AGIs $25k-50k, 2.4% for AGIs $50k-75k, 2.8% for AGIs $75k-100k, 3.1% for AGIs over 100k)
Total tax: $14,636 (reported on 77.4% of returns)
95356:
$14,636
State:
$10,761
(% of AGI for various income ranges: 4.3% for AGIs $10k-25k, 6.8% for AGIs $25k-50k, 8.2% for AGIs $50k-75k, 9.7% for AGIs $75k-100k, 21.2% for AGIs over 100k)
Earned income credit: $1,672 (reported on 12.3% of returns)
Here:
$1,672
State:
$1,763
Percentage of individuals using paid preparers for their 2004 taxes: 64.1%
Here:
64%
State:
66%
(% for various income ranges: 53.3% for AGIs below $10k, 59.8% for AGIs $10k-25k, 63.1% for AGIs $25k-50k, 69.0% for AGIs $50k-75k, 71.0% for AGIs $75k-100k, 75.4% for AGIs over 100k)
Likely homosexual households (counted as self-reported same-sex unmarried-partner households)
Lesbian couples: 0.0% of all households
Gay men: 1.1% of all households
Household received Food Stamps/SNAP in the past 12 months: 1,540 Household did not receive Food Stamps/SNAP in the past 12 months: 9,962
Women who had a birth in the past 12 months: 232 (179 now married, 53 unmarried) Women who did not have a birth in the past 12 months: 6,862 (2,953 now married, 3,899 unmarried)
Housing units in zip code 95356 with a mortgage: 4,916 (477 second mortgage, 47 home equity loan, 309 both second mortgage and home equity loan) Houses without a mortgage: 10
Median monthly owner costs for units with a mortgage: $2,142 Median monthly owner costs for units without a mortgage: $766
Residents with income below the poverty level in 2022:
This zip code:
9.2%
Whole state:
12.2%
Residents with income below 50% of the poverty level in 2022:
This zip code:
5.5%
Whole state:
6.2%
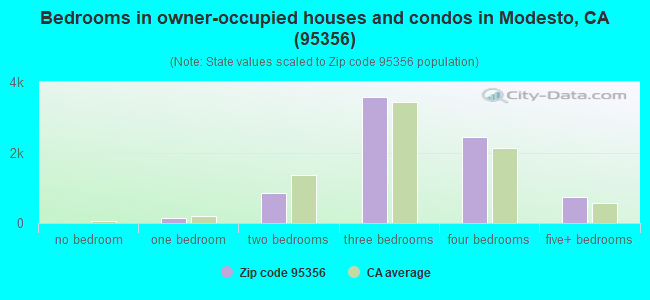
Median number of rooms in houses and condos:
Here:
6.3
State:
6.0
Median number of rooms in apartments:
Here:
4.7
State:
3.9
Notable locations in this zip code not listed on our city pages
Notable locations in zip code 95356: Rocking S Dairy Number 1 (A), Rocking S Dairy Number 2 (B), Del Rio Golf and Country Club (C), Modesto Fire Department Station 11 (D), Salida Fire Protection District Station 2 (E). Display/hide their locations on the map
4,958 married couples with children.
1,641 single-parent households (549 men, 1,092 women).
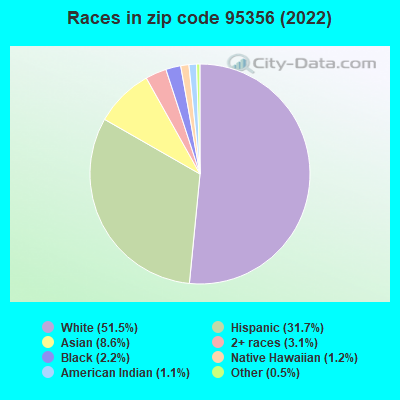
66.6% of residents of 95356 zip code speak English at home.
17.3% of residents speak Spanish at home (62% very well, 21% well, 15% not well, 3% not at all).
7.9% of residents speak other Indo-European language at home (69% very well, 16% well, 11% not well, 5% not at all).
4.2% of residents speak Asian or Pacific Island language at home (58% very well, 34% well, 8% not well).
4.1% of residents speak other language at home (67% very well, 19% well, 11% not well, 3% not at all).
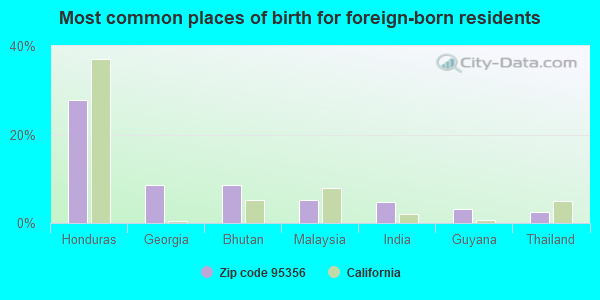
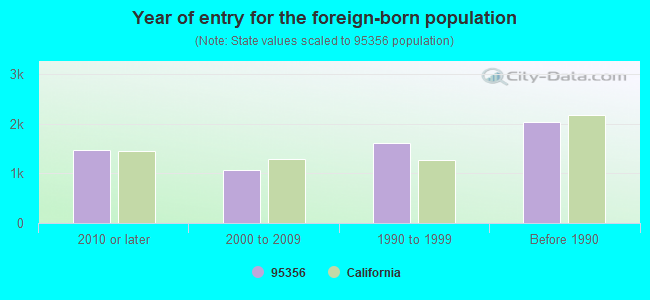
Foreign born population: 5,902 (18.0%) (58.4% of them are naturalized citizens)
Major facilities with environmental interests located in this zip code:
GUARDIAN PROTECTION PRODUCTS (812 KIERNAN RD in MODESTO, CA)
(Integrated Compliance Information System) - ICIS-09-1996-0007, FORMAL ENFORCEMENT ACTION, ICIS-09-1996-0089, (Integrated Compliance Information System) - ICIS-09-2001-0066, FORMAL ENFORCEMENT ACTION COMPLIANCE ACTIVITY (Tracking inspections of insecticide, fungicide, and rodenticide, and toxic substances) Business SIC classification: HARDWARE; FABRICATED METAL PRODUCTS; COMMUNICATIONS EQUIPMENT
ACME CLNR (3501 MCHENRY AVE A2 in MODESTO, CA)
STATE MASTER (California - Hazardous Waste Tracking) - HAZARDOU WASTE PROGRAM CRITERIA AND HAZARDOUS AIR POLLUTANT INVENTORY (Inventory of air pollution sources) Small Quantity Generators, between 100 kg and 1000 kg of hazardous waste/month (Resource Conservation and Recovery Act (tracking hazardous waste)) - notification Business SIC classification: DRYCLEANING PLANTS, EXCEPT RUG CLEANING Organizations: MARK NAZMI OWNER (CONTACT/OWNER)
ALFRED MATTHEWS INC (3807 MCHENRY AVENUE in MODESTO, CA)
STATE MASTER (California - Hazardous Waste Tracking) - HAZARDOU WASTE PROGRAM CRITERIA AND HAZARDOUS AIR POLLUTANT INVENTORY (Inventory of air pollution sources) Small Quantity Generators, between 100 kg and 1000 kg of hazardous waste/month (Resource Conservation and Recovery Act (tracking hazardous waste)) - notification Business SIC classification: MOTOR VEHICLE DEALERS (NEW AND USED) Organizations: JIM CLARK (CONTACT/OWNER)
Alternative names: ALFRED MATTHEWS-CADS.,OLDS.
CHEVRON STATION NO 201456 (3900 PELANDALE AVE in MODESTO, CA)
STATE MASTER (California - Hazardous Waste Tracking) - HAZARDOU WASTE PROGRAM CRITERIA AND HAZARDOUS AIR POLLUTANT INVENTORY (Inventory of air pollution sources) Small Quantity Generators, between 100 kg and 1000 kg of hazardous waste/month (Resource Conservation and Recovery Act (tracking hazardous waste)) - notification Business SIC classification: GASOLINE SERVICE STATIONS Organizations: CHEVRON PRODUCTS CO (CONTACT/OWNER)
Alternative names: CHEVRON USA PRODUCTS COMPANY
FIRESIDE DODGE (4620 N MCHENRY AVE in MODESTO, CA)
STATE MASTER (California - Hazardous Waste Tracking) - HAZARDOU WASTE PROGRAM Small Quantity Generators, between 100 kg and 1000 kg of hazardous waste/month (Resource Conservation and Recovery Act (tracking hazardous waste))
JIM SARAS (6061 CARVER RD in MODESTO, CA)
STATE MASTER (California - Hazardous Waste Tracking) - HAZARDOU WASTE PROGRAM Small Quantity Generators, between 100 kg and 1000 kg of hazardous waste/month (Resource Conservation and Recovery Act (tracking hazardous waste))
INDALEX WEST, INC. (4555 NORTH STAR WAY in MODESTO, CA)
(Integrated Compliance Information System) - ICIS-09-2004-0381, FORMAL ENFORCEMENT ACTION, ENFORCEMENT/COMPLIANCE ACTIVITY COMPLIANCE ACTIVITY (Tracking inspections of insecticide, fungicide, and rodenticide, and toxic substances)
BAPTIST (AGNES M.) ELEMENTARY (1825 CHEYENNE WAY in MODESTO, CA)
(National Center for Education Statistics) - STATE ID-6108302 Organizations: STANISLAUS UNION ELEMENTARY (SCHOOL DISTRICT)
ADVANCED AUTO BODY (319 BANGS AVENUE in MODESTO, CA)
CRITERIA AND HAZARDOUS AIR POLLUTANT INVENTORY (Inventory of air pollution sources) Small Quantity Generators, between 100 kg and 1000 kg of hazardous waste/month (Resource Conservation and Recovery Act (tracking hazardous waste)) - notification HAZARDOUS WASTE BIENNIAL REPORTER (Resource Conservation and Recovery Act (tracking hazardous waste)) Large Quantity Generators, more that 1000 kg of hazardous waste/month (Resource Conservation and Recovery Act (tracking hazardous waste)) Business SIC classification: TOP, BODY, AND UPHOLSTERY REPAIR SHOPS AND PAINT SHOPS Organizations: MICHAEL DUMAS (CONTACT/OWNER)
Alternative names: SUPERIOR PAINT AND AUTO BODY
GUARDIAN PROTECTION CON WHSE (4628 4632 in MODESTO, CA)
MODESTO COLLISION CENTER (4736 STRATOS WY in MODESTO, CA)
HAZARDOUS WASTE BIENNIAL REPORTER (Resource Conservation and Recovery Act (tracking hazardous waste)) Large Quantity Generators, more that 1000 kg of hazardous waste/month (Resource Conservation and Recovery Act (tracking hazardous waste)) Business NAICS classification: AUTOMOTIVE BODY, PAINT, AND INTERIOR REPAIR AND MAINTENANCE.
INFINITI OF MODESTO (4301 MCHENRY AVE in MODESTO, CA)
Small Quantity Generators, between 100 kg and 1000 kg of hazardous waste/month (Resource Conservation and Recovery Act (tracking hazardous waste)) Organizations: JOHN W GARDNER (CONTACT/OPERATOR)
LAMAR TOOL & DIE CASTING (4230 TECHNOLOGY DR. in MODESTO, CA)
CRITERIA AND HAZARDOUS AIR POLLUTANT INVENTORY (Inventory of air pollution sources) AIR MAJOR ("Best Available" air pollution technologies tracking) TRI REPORTER (Tracking of toxic chemicals releasing facilities) Business SIC classification: ALUMINUM DIE-CASTINGS; SPECIAL DIES AND TOOLS, DIE SETS, JIGS AND FIXTURES, AND INDUSTRIAL MOLDS; INDUSTRIAL INSTRUMENTS FOR MEASUREMENT, DISPLAY, AND CONTROL OF PROCESS VARIABLES; AND RELATED PRODUCTS
Housing units lacking complete kitchen facilities: 0.9%
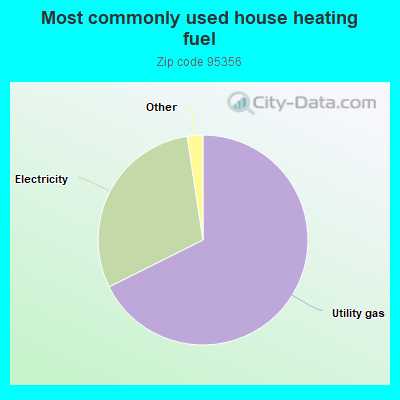
67.7%Utility gas
30.0%Electricity
0.9%Bottled, tank, or LP gas
0.6%Solar energy
Population in 1990: 26,202.
Place of birth for U.S.-born residents:
This state: 22,747
Northeast: 670
Midwest: 980
South: 1,067
West: 1,145
50% of the 95356 zip code residents lived in the same house 5 years ago. Out of people who lived in different houses, 64% lived in this county. Out of people who lived in different counties, 50% lived in California.
93% of the 95356 zip code residents lived in the same house 1 year ago. Out of people who lived in different houses, 57% moved from this county. Out of people who lived in different houses, 39% moved from different county within same state. Out of people who lived in different houses, 0% moved from different state. Out of people who lived in different houses, 4% moved from abroad.
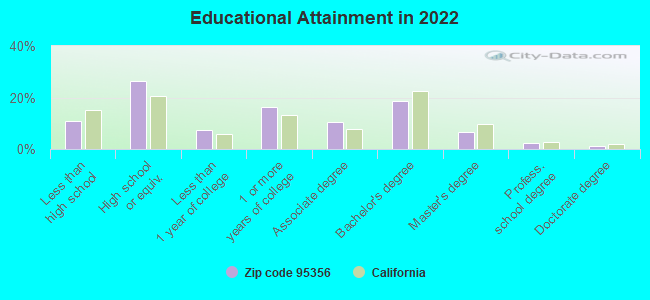
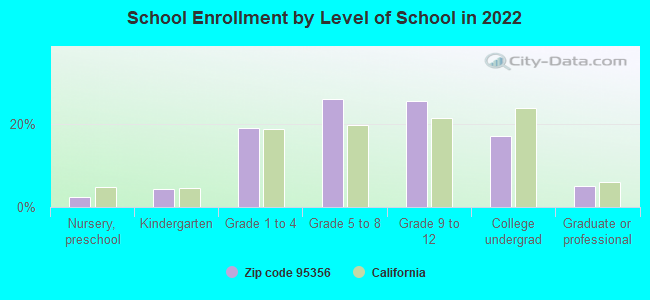
Private vs. public school enrollment:
Students in private schools in grades 1 to 8 (elementary and middle school): 378
Here:
10.1%
California:
10.5%
Students in private schools in grades 9 to 12 (high school): 75
Here:
3.6%
California:
8.5%
Students in private undergraduate colleges: 279
Here:
19.9%
California:
15.9%
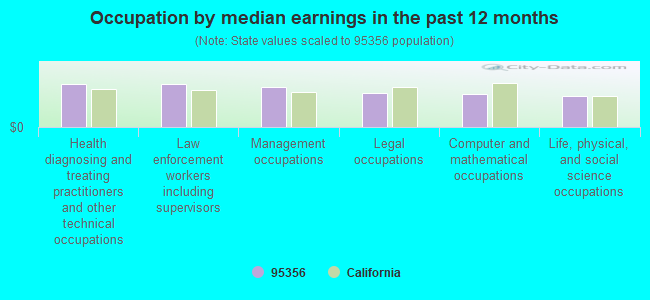
Occupation by median earnings in the past 12 months ($)
116,205Health diagnosing and treating practitioners and other technical occupations
115,799Law enforcement workers including supervisors
107,039Management occupations
91,719Legal occupations
88,322Computer and mathematical occupations
83,130Life, physical, and social science occupations
Companies with federal contracts located in this zip code:
VICTORIA TRUJILLO (4619 SPYRES WAY, UNIT J in MODESTO, CA; small business) : $967,508 in 65 contractsfrom 2004 to 2006
Contracts for Heat Exchangers and Steam Condensers, Fuses, Arresters, Absorbers, and Protectors, Oscillators and Piezoelectric Crystals, Switches, and moreby Defense Logistics Agency, Army, Navy Signed by year:2000: $0; 2001: $0; 2002: $0; 2003: $0; 2004: $57,129; 2005: $771,741; 2006: $138,638.
Biggest contracts:
$100,000 with Defense Logistics Agency for Heat Exchangers and Steam Condensers. Signed on 2005-12-05. Completion date: 2006-08-03.
$99,738 with Defense Logistics Agency for Fuses, Arresters, Absorbers, and Protectors. Signed on 2005-04-15. Completion date: 2005-11-11.
$75,558 with Defense Logistics Agency for Oscillators and Piezoelectric Crystals. Signed on 2005-08-05. Completion date: 2006-04-02.
$48,741 with Defense Logistics Agency for Switches. Signed on 2005-08-05. Completion date: 2005-09-04.
CRANBROOK REALTY INVESTMENT FUND, L ( in Modesto, CA; small business) : $258,214 in 20 contractsfrom 2003 to 2006
Contracts for Lease or Rental of Facilities -- Office Buildings by Public Buildings Service Signed by year:2000: $0; 2001: $0; 2002: $0; 2003: $13,507; 2004: $40,800; 2005: $122,307; 2006: $81,600.
Biggest contracts:
$13,600 with Public Buildings Service for Lease or Rental of Facilities -- Office Buildings. Signed on 2006-04-01. Completion date: 2006-09-30.
$13,600, same as above.Signed on 2006-07-01. Completion date: 2006-09-30.
$13,600, same as above.Signed on 2006-04-01. Completion date: 2006-09-30.
$13,600, same as above.Signed on 2006-04-01. Completion date: 2006-09-30.
RUMBLE SPRAY CALIFORNIA INC (2949 LADD RD in MODESTO, CA; small business) : $56,822 in 12 contractsfrom 2003 to 2006
Contracts for Landscaping/Groundskeeping Services, Miscellaneous Chemical Specialties by Army, U.S. Army Corps of Engineers - civil program financing only, U.S. Fish and Wildlife Service Signed by year:2000: $0; 2001: $0; 2002: $0; 2003: $43,504; 2004: -$8,712; 2005: $14,718; 2006: $7,312.
Biggest contracts:
$21,752 with Army for Landscaping/Groundskeeping Services. Signed on 2003-12-04. Completion date: 2004-09-30.
$21,752 with U.S. Army Corps of Engineers - civil program financing only for Landscaping/Groundskeeping Services. Signed on 2003-12-04. Completion date: 2004-09-30.
$13,431 with Army for Landscaping/Groundskeeping Services. Signed on 2006-02-14. Completion date: 2006-09-30.
$9,718, same as above.Signed on 2005-04-08. Completion date: 2006-09-30.
GROVER LANDSCAPE SERVICES INC (2825 KIERNAN AVE in MODESTO, CA; small business) : $37,830 in 2 contractsfrom 2005 to 2006
$24,180 with Defense Logistics Agency for Landscaping/Groundskeeping Services. Taking place in MS. Signed on 2005-05-23. Completion date: 2005-06-30.
$13,650 with Defense Logistics Agency for Trash/Garbage Collection Services - Including Portable Sanitation Services. Signed on 2006-06-27. Completion date: 2006-06-27.
HI-TEC SPORTS USA (4801 STODDARD ROAD in MODESTO, CA; small business) : $34,929 in 3 contractsin 2003
$15,243 with Army for Footwear, Men's. Taking place in MO. Signed on 2003-03-27. Completion date: 2003-04-15.
$9,965 with Army for Footwear, Men's. Signed on 2003-09-02. Completion date: 2003-09-15.
$9,721 with Army for Footwear, Men's. Taking place in MO. Signed on 2003-02-12. Completion date: 2003-02-19.
Top industries in this zip code by the number of employees in 2005:
2005 - 2018 National Fire Incident Reporting System (NFIRS) incidents
Based on the data from the years 2005 - 2018 the average number of fire incidents per year is 87. The highest number of reported fire incidents - 145 took place in 2005, and the least - 3 in 2013. The data has a dropping trend.
When looking into fire subcategories, the most reports belonged to: Outside Fires (43.5%), and Structure Fires (34.5%).
Fire incident types reported to NFIRS in Zip Code 95356


+$3,550
-$7,562
(% of AGI for various income ranges: -0.1% for AGIs $25k-50k, 0.1% for AGIs $50k-75k, 0.1% for AGIs over 100k) Nearest zip codes: 95350, 95368, 95367, 95355, 95351, 95366.


 Based on the data from the years 2005 - 2018 the average number of fire incidents per year is 87. The highest number of reported fire incidents - 145 took place in 2005, and the least - 3 in 2013. The data has a dropping trend.
 When looking into fire subcategories, the most reports belonged to: Outside Fires (43.5%), and Structure Fires (34.5%).