Estimated zip code population in 2022: 54,908 Zip code population in 2010: 51,046 Zip code population in 2000: 52,862
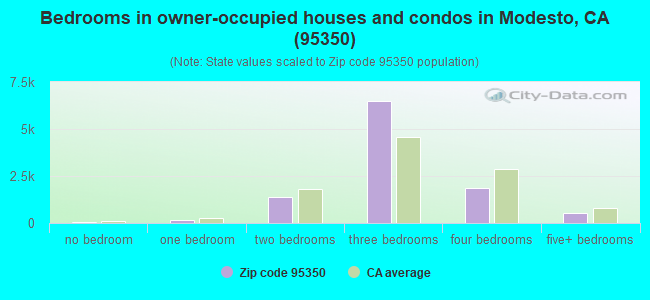
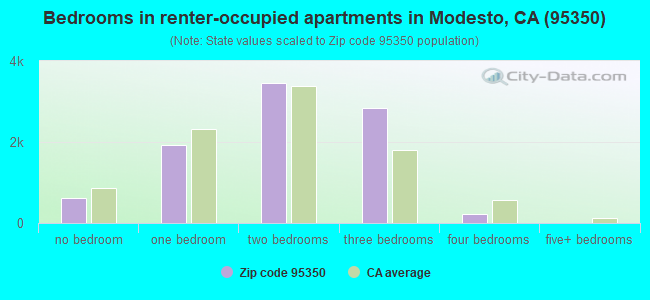
Houses and condos: 20,382 Renter-occupied apartments: 9,073
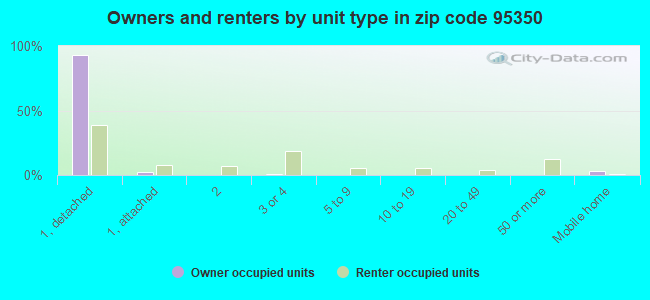
% of renters here:
46%
State:
44%
March 2022 cost of living index in zip code 95350: 98.7 (near average, U.S. average is 100)
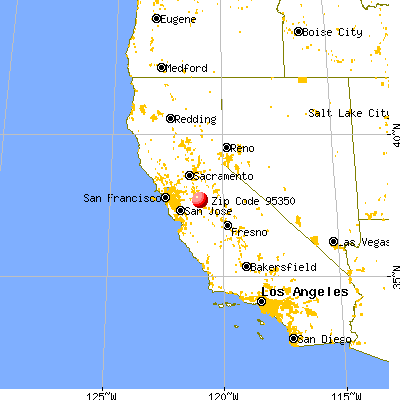
Land area: 8.9 sq. mi. Water area: 0.0 sq. mi.
Population density: 6,184 people per square mile
(high).
OSM Map
General Map
Google Map
MSN Map
OSM Map
General Map
Google Map
MSN Map
OSM Map
General Map
Google Map
MSN Map
OSM Map
General Map
Google Map
MSN Map
Please wait while loading the map...
Real estate property taxes paid for housing units in 2022:
This zip code:
0.5% ($2,191)
California:
0.7% ($4,831)
Median real estate property taxes paid for housing units with mortgages in 2022: $2,562 (0.6%) Median real estate property taxes paid for housing units with no mortgage in 2022: $1,619 (0.4%)
Averages for the 2020 tax year for zip code 95350, filed in 2021:
Average Adjusted Gross Income (AGI) in 2020: $55,293 (Individual Income Tax Returns)
Here:
$55,293
State:
$95,910
Salary/wage: $48,785 (reported on 80.9% of returns)
Here:
$48,785
State:
$77,331
(% of AGI for various income ranges: 1143.4% for AGIs below $25k, 3697.3% for AGIs $25k-50k, 7324.1% for AGIs $50k-75k, 10237.6% for AGIs $75k-100k, 19360.1% for AGIs $100k-200k, 74859.3% for AGIs over 200k)
Taxable interest for individuals: $1,117 (reported on 28.8% of returns)
This zip code:
$1,117
California:
$2,294
(% of AGI for various income ranges: 8.4% for AGIs below $25k, 12.4% for AGIs $25k-50k, 26.6% for AGIs $50k-75k, 47.7% for AGIs $75k-100k, 130.6% for AGIs $100k-200k, 2572.9% for AGIs over 200k)
Ordinary dividends: $4,948 (reported on 10.6% of returns)
Here:
$4,948
State:
$10,949
(% of AGI for various income ranges: 12.3% for AGIs below $25k, 22.0% for AGIs $25k-50k, 50.2% for AGIs $50k-75k, 81.1% for AGIs $75k-100k, 281.2% for AGIs $100k-200k, 3377.9% for AGIs over 200k)
Net capital gain/loss in AGI: +$11,849 (reported on 10.8% of returns)
Here:
+$11,849
State:
+$49,306
(% of AGI for various income ranges: 3.9% for AGIs below $25k, 17.8% for AGIs $25k-50k, 50.4% for AGIs $50k-75k, 121.5% for AGIs $75k-100k, 544.7% for AGIs $100k-200k, 14134.3% for AGIs over 200k)
Profit/loss from business: +$11,268 (reported on 13.4% of returns)
Here:
+$11,268
State:
+$15,671
(% of AGI for various income ranges: 96.2% for AGIs below $25k, 133.6% for AGIs $25k-50k, 206.1% for AGIs $50k-75k, 225.5% for AGIs $75k-100k, 552.7% for AGIs $100k-200k, 5983.6% for AGIs over 200k)
Taxable individual retirement arrangement distribution: $17,294 (reported on 6.3% of returns)
95350:
$17,294
California:
$23,505
(% of AGI for various income ranges: 37.7% for AGIs below $25k, 74.7% for AGIs $25k-50k, 152.0% for AGIs $50k-75k, 229.7% for AGIs $75k-100k, 621.3% for AGIs $100k-200k, 3373.6% for AGIs over 200k)
Self-employed (Keogh) retirement plans: $27,889 (reported on 0.4% of returns)
95350:
$27,889
California:
$30,163
(% of AGI for various income ranges: 13.7% for AGIs $50k-75k, 39.1% for AGIs $100k-200k, 1150.7% for AGIs over 200k)
Total itemized deductions: $28,168 (reported on 8.5% of returns)
Here:
$28,168
State:
$39,517
(% of AGI for various income ranges: 40.3% for AGIs below $25k, 96.9% for AGIs $25k-50k, 343.9% for AGIs $50k-75k, 647.4% for AGIs $75k-100k, 1501.4% for AGIs $100k-200k, 8566.4% for AGIs over 200k)
Charity contributions: $7,210 (reported on 6.6% of returns)
Here:
$7,210
State:
$12,598
(% of AGI for various income ranges: 2.8% for AGIs below $25k, 11.8% for AGIs $25k-50k, 46.7% for AGIs $50k-75k, 104.3% for AGIs $75k-100k, 341.3% for AGIs $100k-200k, 2417.1% for AGIs over 200k)
Taxes paid: $7,501 (reported on 8.4% of returns)
95350:
$7,501
State:
$8,807
(% of AGI for various income ranges: 6.3% for AGIs below $25k, 19.9% for AGIs $25k-50k, 89.2% for AGIs $50k-75k, 190.7% for AGIs $75k-100k, 460.0% for AGIs $100k-200k, 1823.6% for AGIs over 200k)
Earned income credit: $2,160 (reported on 19.2% of returns)
Here:
$2,160
State:
$2,074
(% of AGI for various income ranges: 100.9% for AGIs below $25k, 83.3% for AGIs $25k-50k, 1.5% for AGIs $50k-75k)
Percentage of individuals using paid preparers for their 2020 taxes: 93.5%
Here:
93%
State:
92%
(% for various income ranges: 92.6% for AGIs below $25k, 94.4% for AGIs $25k-50k, 93.4% for AGIs $50k-75k, 93.1% for AGIs $75k-100k, 94.2% for AGIs $100k-200k, 94.5% for AGIs over 200k)
Averages for the 2012 tax year for zip code 95350, filed in 2013:
Average Adjusted Gross Income (AGI) in 2012: $45,588 (Individual Income Tax Returns)
Here:
$45,588
State:
$72,726
Salary/wage: $38,988 (reported on 80.7% of returns)
Here:
$38,988
State:
$59,079
(% of AGI for various income ranges: 71.4% for AGIs below $25k, 78.2% for AGIs $25k-50k, 74.6% for AGIs $50k-75k, 73.3% for AGIs $75k-100k, 67.3% for AGIs $100k-200k, 42.2% for AGIs over 200k)
Taxable interest for individuals: $1,167 (reported on 30.9% of returns)
This zip code:
$1,167
California:
$2,146
(% of AGI for various income ranges: 0.8% for AGIs below $25k, 0.5% for AGIs $25k-50k, 0.5% for AGIs $50k-75k, 0.6% for AGIs $75k-100k, 0.9% for AGIs $100k-200k, 1.6% for AGIs over 200k)
Ordinary dividends: $4,655 (reported on 13.5% of returns)
Here:
$4,655
State:
$9,308
(% of AGI for various income ranges: 1.1% for AGIs below $25k, 0.8% for AGIs $25k-50k, 0.9% for AGIs $50k-75k, 1.0% for AGIs $75k-100k, 1.6% for AGIs $100k-200k, 3.2% for AGIs over 200k)
Net capital gain/loss in AGI: +$7,024 (reported on 11.1% of returns)
Here:
+$7,024
State:
+$30,460
(% of AGI for various income ranges: 0.3% for AGIs $50k-75k, 0.6% for AGIs $75k-100k, 1.0% for AGIs $100k-200k, 10.2% for AGIs over 200k)
Profit/loss from business: +$13,213 (reported on 13.3% of returns)
Here:
+$13,213
State:
+$17,064
(% of AGI for various income ranges: 8.3% for AGIs below $25k, 2.9% for AGIs $25k-50k, 2.5% for AGIs $50k-75k, 1.9% for AGIs $75k-100k, 3.3% for AGIs $100k-200k, 6.1% for AGIs over 200k)
Taxable individual retirement arrangement distribution: $13,632 (reported on 9.6% of returns)
95350:
$13,632
California:
$19,557
(% of AGI for various income ranges: 2.9% for AGIs below $25k, 2.5% for AGIs $25k-50k, 2.4% for AGIs $50k-75k, 3.3% for AGIs $75k-100k, 3.4% for AGIs $100k-200k, 3.0% for AGIs over 200k)
Self-employment retirement plans: $16,300 (reported on 0.4% of returns)
95350:
$16,300
California:
$24,530
(% of AGI for various income ranges: 0.1% for AGIs $25k-50k, 0.2% for AGIs $100k-200k, 0.7% for AGIs over 200k)
Total itemized deductions: $21,097 (23% of AGI, reported on 27.0% of returns)
Here:
$21,097
State:
$34,004
Here:
23.3% of AGI
State:
22.7% of AGI
(% of AGI for various income ranges: 7.2% for AGIs below $25k, 9.8% for AGIs $25k-50k, 12.4% for AGIs $50k-75k, 13.7% for AGIs $75k-100k, 16.6% for AGIs $100k-200k, 13.7% for AGIs over 200k)
Charity contributions: $3,748 (reported on 22.0% of returns)
Here:
$3,748
State:
$4,659
(% of AGI for various income ranges: 0.6% for AGIs below $25k, 1.1% for AGIs $25k-50k, 1.5% for AGIs $50k-75k, 1.8% for AGIs $75k-100k, 2.7% for AGIs $100k-200k, 3.0% for AGIs over 200k)
Taxes paid: $6,482 (reported on 26.8% of returns)
95350:
$6,482
State:
$14,448
(% of AGI for various income ranges: 1.1% for AGIs below $25k, 1.8% for AGIs $25k-50k, 3.0% for AGIs $50k-75k, 3.8% for AGIs $75k-100k, 6.1% for AGIs $100k-200k, 7.2% for AGIs over 200k)
Earned income credit: $2,251 (reported on 24.2% of returns)
Here:
$2,251
State:
$2,286
(% of AGI for various income ranges: 7.6% for AGIs below $25k, 1.2% for AGIs $25k-50k)
Percentage of individuals using paid preparers for their 2012 taxes: 57.1%
Here:
57%
State:
64%
(% for various income ranges: 51.5% for AGIs below $25k, 57.4% for AGIs $25k-50k, 61.6% for AGIs $50k-75k, 63.8% for AGIs $75k-100k, 69.0% for AGIs $100k-200k, 85.7% for AGIs over 200k)
Averages for the 2004 tax year for zip code 95350, filed in 2005:
Average Adjusted Gross Income (AGI) in 2004: $41,299 (Individual Income Tax Returns)
Here:
$41,299
State:
$58,600
Salary/wage: $36,689 (reported on 82.5% of returns)
Here:
$36,689
State:
$49,455
(% of AGI for various income ranges: 123.0% for AGIs below $10k, 74.7% for AGIs $10k-25k, 80.5% for AGIs $25k-50k, 79.5% for AGIs $50k-75k, 75.9% for AGIs $75k-100k, 57.6% for AGIs over 100k)
Taxable interest for individuals: $1,543 (reported on 43.1% of returns)
This zip code:
$1,543
California:
$2,365
(% of AGI for various income ranges: 6.9% for AGIs below $10k, 2.1% for AGIs $10k-25k, 1.2% for AGIs $25k-50k, 1.1% for AGIs $50k-75k, 1.3% for AGIs $75k-100k, 2.0% for AGIs over 100k)
Taxable dividends: $3,204 (reported on 18.6% of returns)
Here:
$3,204
State:
$4,746
(% of AGI for various income ranges: 3.7% for AGIs below $10k, 1.4% for AGIs $10k-25k, 0.8% for AGIs $25k-50k, 0.9% for AGIs $50k-75k, 1.0% for AGIs $75k-100k, 2.5% for AGIs over 100k)
Net capital gain/loss: +$10,289 (reported on 15.3% of returns)
Here:
+$10,289
State:
+$23,418
(% of AGI for various income ranges: -2.9% for AGIs below $10k, -0.0% for AGIs $10k-25k, 0.4% for AGIs $25k-50k, 0.8% for AGIs $50k-75k, 2.0% for AGIs $75k-100k, 11.9% for AGIs over 100k)
Profit/loss from business: +$14,305 (reported on 12.8% of returns)
Here:
+$14,305
State:
+$16,826
(% of AGI for various income ranges: 4.6% for AGIs below $10k, 4.9% for AGIs $10k-25k, 3.3% for AGIs $25k-50k, 2.9% for AGIs $50k-75k, 3.5% for AGIs $75k-100k, 6.8% for AGIs over 100k)
IRA payment deduction: $2,958 (reported on 1.8% of returns)
95350:
$2,958
California:
$3,192
(% of AGI for various income ranges: 0.3% for AGIs below $10k, 0.1% for AGIs $10k-25k, 0.2% for AGIs $25k-50k, 0.1% for AGIs $50k-75k, 0.1% for AGIs $75k-100k, 0.1% for AGIs over 100k)
Self-employed pension: $13,828 (reported on 0.9% of returns)
Here:
$13,828
California:
$17,688
(% of AGI for various income ranges: 0.1% for AGIs $10k-25k, 0.1% for AGIs $25k-50k, 0.1% for AGIs $50k-75k, 0.2% for AGIs $75k-100k, 0.8% for AGIs over 100k)
Total itemized deductions: $19,014 (26% of AGI, reported on 34.7% of returns)
Here:
$19,014
State:
$28,113
Here:
25.7% of AGI
State:
25.3% of AGI
(% of AGI for various income ranges: 27.0% for AGIs below $10k, 10.3% for AGIs $10k-25k, 14.2% for AGIs $25k-50k, 18.2% for AGIs $50k-75k, 18.6% for AGIs $75k-100k, 16.0% for AGIs over 100k)
Charity contributions deductions: $2,906 (4% of AGI, reported on 30.7% of returns)
Here:
$2,906
State:
$3,923
Here:
3.8% of AGI
State:
3.3% of AGI
(% of AGI for various income ranges: 1.1% for AGIs below $10k, 1.0% for AGIs $10k-25k, 1.6% for AGIs $25k-50k, 2.3% for AGIs $50k-75k, 2.6% for AGIs $75k-100k, 2.9% for AGIs over 100k)
Total tax: $5,712 (reported on 73.8% of returns)
95350:
$5,712
State:
$10,761
(% of AGI for various income ranges: 3.7% for AGIs below $10k, 4.0% for AGIs $10k-25k, 6.5% for AGIs $25k-50k, 8.6% for AGIs $50k-75k, 10.2% for AGIs $75k-100k, 17.4% for AGIs over 100k)
Earned income credit: $1,675 (reported on 16.9% of returns)
Here:
$1,675
State:
$1,763
Percentage of individuals using paid preparers for their 2004 taxes: 62.5%
Here:
62%
State:
66%
(% for various income ranges: 52.1% for AGIs below $10k, 61.2% for AGIs $10k-25k, 63.3% for AGIs $25k-50k, 67.3% for AGIs $50k-75k, 68.4% for AGIs $75k-100k, 76.3% for AGIs over 100k)
Likely homosexual households (counted as self-reported same-sex unmarried-partner households)
Lesbian couples: 0.3% of all households
Gay men: 0.2% of all households
Household received Food Stamps/SNAP in the past 12 months: 4,088 Household did not receive Food Stamps/SNAP in the past 12 months: 15,795
Women who had a birth in the past 12 months: 811 (353 now married, 462 unmarried) Women who did not have a birth in the past 12 months: 12,148 (4,579 now married, 7,578 unmarried)
Housing units in zip code 95350 with a mortgage: 6,655 (409 second mortgage, 22 home equity loan, 203 both second mortgage and home equity loan) Houses without a mortgage: 20
Median monthly owner costs for units with a mortgage: $1,837 Median monthly owner costs for units without a mortgage: $614
Residents with income below the poverty level in 2022:
This zip code:
15.8%
Whole state:
12.2%
Residents with income below 50% of the poverty level in 2022:
This zip code:
7.6%
Whole state:
6.2%
Median number of rooms in houses and condos:
Here:
6.0
State:
6.0
Median number of rooms in apartments:
Here:
4.2
State:
3.9
Notable locations in this zip code not listed on our city pages
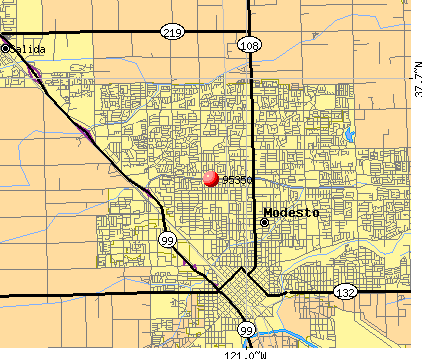
Notable locations in zip code 95350: Scott Park (A), Valley Museum (B), South Hall (C), North Hall (D), Modesto Junior College Library (E), American Medical Response (F), The Living Center Alcohol and Drug Addiction (G), Modesto Fire Department Station 6 (H), Modesto Fire Department Station 5 (I). Display/hide their locations on the map
Shopping Centers: Sylvan Square Shopping Center (1), Northland Shopping Center (2), Modesto Promenade Shopping Center (3), Mervyns McHenry Mall Shopping Center (4), McHenry Village Shopping Center (5), Briggsmore Square Shopping Center (6), Tully Manor Shopping Center (7), Roosevelt Shopping Center (8), Gregory Gardens Shopping Center (9). Display/hide their locations on the map
Parks in zip code 95350 include: Ashby Park (1), Moose Park (2), Revard Manor Park (3), Chrysler Park (4), Davis Community Park (5), Pike Park (6), Roosevelt Park (7), Whitmore Park (8), Eisenhut Park (9). Display/hide their locations on the map
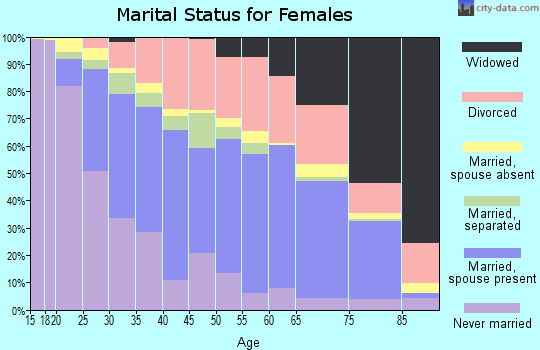
7,602 married couples with children.
4,249 single-parent households (988 men, 3,261 women).
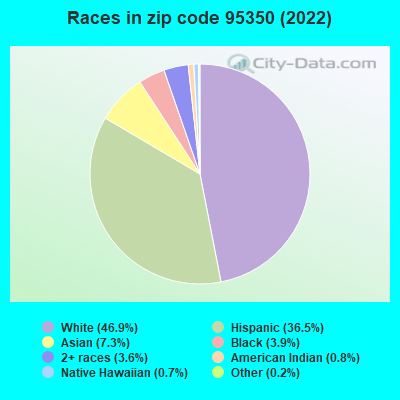
69.7% of residents of 95350 zip code speak English at home.
21.4% of residents speak Spanish at home (71% very well, 15% well, 8% not well, 7% not at all).
4.8% of residents speak other Indo-European language at home (57% very well, 28% well, 10% not well, 5% not at all).
3.2% of residents speak Asian or Pacific Island language at home (46% very well, 20% well, 29% not well, 6% not at all).
0.7% of residents speak other language at home (43% very well, 26% well, 5% not well, 26% not at all).
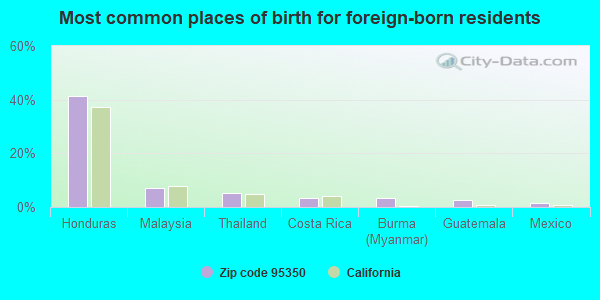
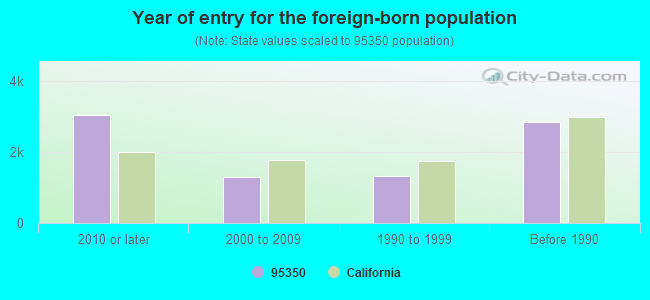
Foreign born population: 7,610 (13.9%) (47.1% of them are naturalized citizens)
Major facilities with environmental interests located in this zip code:
EQUILON ENTERPRISES (3225 MCHENRY in MODESTO, CA) . Federal Facility
STATE MASTER (California - Hazardous Waste Tracking) - HAZARDOU WASTE PROGRAM CRITERIA AND HAZARDOUS AIR POLLUTANT INVENTORY (Inventory of air pollution sources) HAZARDOUS WASTE BIENNIAL REPORTER (Resource Conservation and Recovery Act (tracking hazardous waste)) Small Quantity Generators, between 100 kg and 1000 kg of hazardous waste/month (Resource Conservation and Recovery Act (tracking hazardous waste)) - notification Business SIC classification: GASOLINE SERVICE STATIONS Organizations: EQUILON ENTERPRISES, LLC (CONTACT/OWNER)
Alternative names: SHELL OIL CO, SHERWOOD SHELL SERVICE
MIRACLE AUTO PAINTING (900 NORTH 9TH STREET in MODESTO, CA)
STATE MASTER (California - Hazardous Waste Tracking) - HAZARDOU WASTE PROGRAM CRITERIA AND HAZARDOUS AIR POLLUTANT INVENTORY (Inventory of air pollution sources) Small Quantity Generators, between 100 kg and 1000 kg of hazardous waste/month (Resource Conservation and Recovery Act (tracking hazardous waste)) - notification Business SIC classification: TOP, BODY, AND UPHOLSTERY REPAIR SHOPS AND PAINT SHOPS Business NAICS classification: AUTOMOTIVE BODY, PAINT, AND INTERIOR REPAIR AND MAINTENANCE. Organizations: HELBLING INC (CONTACT/OWNER)
EQUILON ENTERPRISES (1400 COFFEE RD in MODESTO, CA) . Federal Facility
STATE MASTER (California - Hazardous Waste Tracking) - HAZARDOU WASTE PROGRAM CRITERIA AND HAZARDOUS AIR POLLUTANT INVENTORY (Inventory of air pollution sources) Small Quantity Generators, between 100 kg and 1000 kg of hazardous waste/month (Resource Conservation and Recovery Act (tracking hazardous waste)) - notification Business SIC classification: GASOLINE SERVICE STATIONS Organizations: EQUILON ENT LLC DBA S O P U S (CONTACT/OWNER)
Alternative names: GRIFFIN SHELL INC., GRIFFIN SHELL SERVICE, SHELL OIL CO, SHELL SERVICE STATION
NU WAY CLEANERS (2110B COLLEGE AVE in MODESTO, CA)
STATE MASTER (California - Hazardous Waste Tracking) - HAZARDOU WASTE PROGRAM Small Quantity Generators, between 100 kg and 1000 kg of hazardous waste/month (Resource Conservation and Recovery Act (tracking hazardous waste)) - notification Organizations: BRIAN BLAND (CONTACT/OWNER)
AMERICAN CHEVROLET GEO (4742 MCHENRY AVE in MODESTO, CA)
STATE MASTER (California - Hazardous Waste Tracking) - HAZARDOU WASTE PROGRAM Small Quantity Generators, between 100 kg and 1000 kg of hazardous waste/month (Resource Conservation and Recovery Act (tracking hazardous waste)) - notification Organizations: MR BILL HALVORSON (CONTACT/OWNER)
FOSTER FARMS DAIRY (1707 MCHENRY AVE. in MODESTO, CA)
(Integrated Compliance Information System) - ICIS-09-1999-0010, FORMAL ENFORCEMENT ACTION COMPLIANCE ACTIVITY (Tracking inspections of insecticide, fungicide, and rodenticide, and toxic substances) TRI REPORTER (Tracking of toxic chemicals releasing facilities) Business SIC classification: NATURAL, PROCESSED, AND IMITATION CHEESE; ICE CREAM AND FROZEN DESSERTS; FLUID MILK Alternative names: FOSTER DAIRY FARMS
HERITAGE FORD INC (2100 SISK RD in MODESTO, CA)
STATE MASTER (California - Hazardous Waste Tracking) - HAZARDOU WASTE PROGRAM Small Quantity Generators, between 100 kg and 1000 kg of hazardous waste/month (Resource Conservation and Recovery Act (tracking hazardous waste)) Alternative names: HERITAGE FORD PAINT & BODY
MCHENRY MEDICAL GROUP INC (1541 FLORIDA AVE STE 200 in MODESTO, CA)
STATE MASTER (California - Hazardous Waste Tracking) - HAZARDOU WASTE PROGRAM Small Quantity Generators, between 100 kg and 1000 kg of hazardous waste/month (Resource Conservation and Recovery Act (tracking hazardous waste)) - notification
MCHENRY AVE ISUZU (931 MCHENRY AVE in MODESTO, CA)
Small Quantity Generators, between 100 kg and 1000 kg of hazardous waste/month (Resource Conservation and Recovery Act (tracking hazardous waste)) - notification (Resource Conservation and Recovery Act (tracking hazardous waste)) Organizations: CHUCK HILLERY (CONTACT/OWNER)
, KENNETH AM (CONTACT/OWNER)
Alternative names: TRANSMATIC
EISENHUT (GEORGE) ELEMENTARY (1809 SHELDON in MODESTO, CA)
(National Center for Education Statistics) - STATE ID-6098297 Organizations: STANISLAUS UNION ELEMENTARY (SCHOOL DISTRICT)
ELLIOT (ROBERT) ALTER. ED. (1440 SUNRISE AVE. in MODESTO, CA)
(National Center for Education Statistics) - STATE ID-5034913 Organizations: MODESTO CITY HIGH (SCHOOL DISTRICT)
GARRISON ELEMENTARY (1811 TERESA ST. in MODESTO, CA)
(National Center for Education Statistics) - STATE ID-6052716 Organizations: MODESTO CITY ELEMENTARY (SCHOOL DISTRICT)
EVERETT ELEMENTARY (1530 MT. VERNON DR. in MODESTO, CA)
(National Center for Education Statistics) - STATE ID-6052674 Organizations: MODESTO CITY ELEMENTARY (SCHOOL DISTRICT)
Housing units lacking complete plumbing facilities: 0.6% Housing units lacking complete kitchen facilities: 1.8%
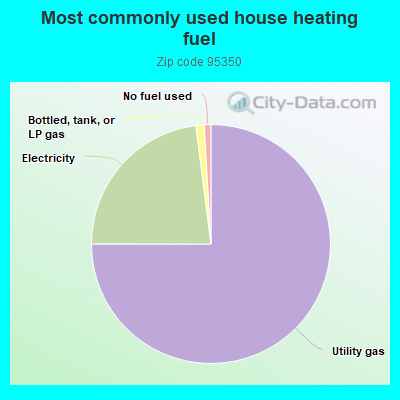
74.7%Utility gas
22.9%Electricity
1.1%Bottled, tank, or LP gas
0.9%No fuel used
Population in 1990: 50,618. Population change in the 1990s: +2,244 (+4.4%).
Place of birth for U.S.-born residents:
This state: 39,750
Northeast: 1,222
Midwest: 1,840
South: 1,976
West: 1,840
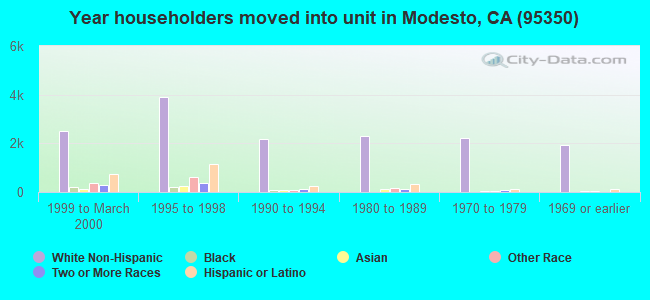
52% of the 95350 zip code residents lived in the same house 5 years ago. Out of people who lived in different houses, 69% lived in this county. Out of people who lived in different counties, 50% lived in California.
88% of the 95350 zip code residents lived in the same house 1 year ago. Out of people who lived in different houses, 54% moved from this county. Out of people who lived in different houses, 34% moved from different county within same state. Out of people who lived in different houses, 8% moved from different state. Out of people who lived in different houses, 4% moved from abroad.
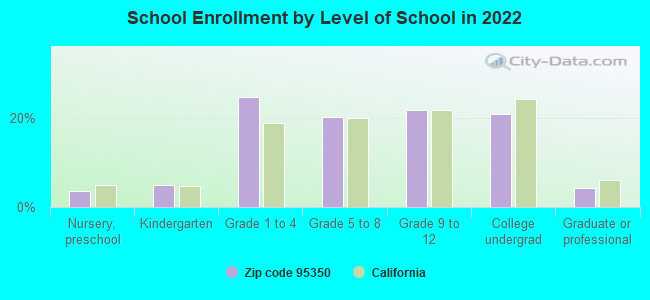
Private vs. public school enrollment:
Students in private schools in grades 1 to 8 (elementary and middle school): 658
Here:
10.8%
California:
10.5%
Students in private schools in grades 9 to 12 (high school): 183
Here:
6.2%
California:
8.5%
Students in private undergraduate colleges: 340
Here:
11.9%
California:
15.9%
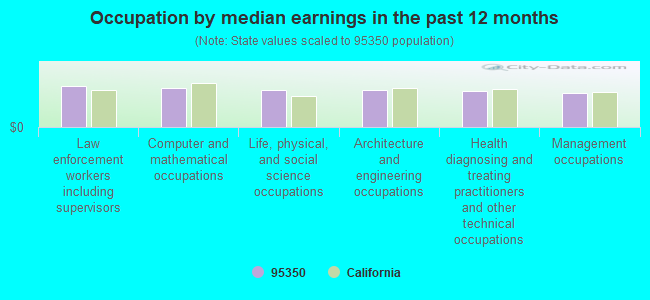
Occupation by median earnings in the past 12 months ($)
94,960Law enforcement workers including supervisors
91,147Computer and mathematical occupations
86,721Life, physical, and social science occupations
85,594Architecture and engineering occupations
83,857Health diagnosing and treating practitioners and other technical occupations
78,855Management occupations
Companies with federal contracts located in this zip code (MODESTO, CA):
BOOKER GERY HICKMAN ARCHITECTS (809 SYLVAN AVE, SUITE 101; small business) : $2,642,266 in 38 contractsfrom 1999 to 2005
Contracts for Architect - Engineer Services (including landscaping, interior layout, and designing), Maintenance, Repair or Alteration of Real Property -- Restoration of real property, Maintenance, Repair or Alteration of Real Property -- Miscellaneous Buildings, Other Buildings, and moreby Army, Employment and Training Administration, Air Force Signed by year:2000: $442,778; 2001: $392,847; 2002: $287,145; 2003: $640,447; 2004: $422,429; 2005: $446,650; 2006: $0.
Biggest contracts:
$301,669 with Army for Architect - Engineer Services (including landscaping, interior layout, and designing). Signed on 2004-08-04. Completion date: 2005-02-28.
$231,618, same as above.Signed on 2003-04-21. Completion date: 2003-06-14.
$224,976, same as above.Signed on 2000-06-22. Completion date: 2001-11-27.
$166,827 with Army for Maintenance, Repair or Alteration of Real Property -- Restoration of real property. Signed on 2001-08-28. Completion date: 2001-10-30.
FOSTER DAIRY FARMS (1707 MCHENRY AVE) : $174,597 in 6 contractsfrom 2004 to 2006
Contracts for Food Items For Resale by Defense Commissary Agency Signed by year:2000: $0; 2001: $0; 2002: $0; 2003: $0; 2004: $36,440; 2005: $96,189; 2006: $41,968.
Biggest contracts:
$41,968 with Defense Commissary Agency for Food Items For Resale. Signed on 2006-01-01. Completion date: 2006-03-31.
$41,318, same as above.Signed on 2005-04-01. Completion date: 2005-08-31.
$36,440, same as above.Signed on 2004-10-01. Completion date: 2005-02-28.
$26,375, same as above.Signed on 2005-10-01. Completion date: 2005-12-31.
U S RENTALS INC (1331 COLDWELL AVE) : $90,792 in 3 contractsfrom 1999 to 2001
$49,792 with Navy for Electric Services. Signed on 1999-11-16. Completion date: 1999-12-15.
$41,000 with Army for Traffic and Transit Signal Systems. Signed on 2001-12-17. Completion date: 2001-12-11.
$0, same as above.Signed on 2001-12-17. Completion date: 2001-12-11.
BRENTON SAFETY, INC (1349 COLDWELL STE B; small business) : $24,595 in 2 contractsin 2004
$16,895 with Army for Safety and Rescue Equipment. Signed on 2004-03-31. Completion date: 2004-04-26.
$7,700, same as above.Signed on 2004-04-01. Completion date: 2004-05-03.
JACK FROST ICE SERVICE, INC (1440 COLDWELL AVE) : $3,391 in 6 contractsfrom 2004 to 2006
Contracts for Food Items For Resale, Non-Food Items For Resale by Defense Commissary Agency Signed by year:2000: $0; 2001: $0; 2002: $0; 2003: $0; 2004: $474; 2005: $2,373; 2006: $544.
Biggest contracts:
$1,346 with Defense Commissary Agency for Food Items For Resale. Signed on 2005-04-01. Completion date: 2005-08-31.
$544 with Defense Commissary Agency for Non-Food Items For Resale. Signed on 2006-01-01. Completion date: 2006-03-31.
$474 with Defense Commissary Agency for Food Items For Resale. Signed on 2004-10-01. Completion date: 2005-02-28.
$389 with Defense Commissary Agency for Non-Food Items For Resale. Signed on 2005-10-01. Completion date: 2005-12-31.
Top industries in this zip code by the number of employees in 2005:
Health Care and Social Assistance: General Medical and Surgical Hospitals (over 1000 employees: 1 establishment)
Health Care and Social Assistance: Offices of Physicians (except Mental Health Specialists) (100-249: 1, 50-99: 4, 20-49: 7, 10-19: 15, 5-9: 16, 1-4: 51)
Management of Companies and Enterprises: Corporate, Subsidiary, and Regional Managing Offices (500-999: 1, 100-249: 1, 50-99: 1, 10-19: 1, 5-9: 3, 1-4: 5)
Administrative and Support and Waste Management and Remediation Services: Temporary Help Services (100-249: 1, 50-99: 8, 20-49: 2, 10-19: 3)
Health Care and Social Assistance: Nursing Care Facilities (100-249: 3, 50-99: 2, 20-49: 1)
Health Care and Social Assistance: Offices of Dentists (20-49: 5, 10-19: 13, 5-9: 22, 1-4: 16)
People in group quarters in 2010:
645 people in nursing facilities/skilled-nursing facilities
115 people in residential treatment centers for adults
92 people in group homes intended for adults
48 people in workers' group living quarters and job corps centers
17 people in other noninstitutional facilities
14 people in emergency and transitional shelters (with sleeping facilities) for people experiencing homelessness
6 people in group homes for juveniles (non-correctional)
People in group quarters in 2000:
780 people in nursing homes
118 people in other noninstitutional group quarters
61 people in other group homes
44 people in homes or halfway houses for drug/alcohol abuse
11 people in homes for the mentally retarded
8 people in other nonhousehold living situations
6 people in hospitals or wards for drug/alcohol abuse
5 people in religious group quarters
Fatal accident statistics in 2014:
Fatal accident count: 5
Vehicles involved in fatal accidents: 8
Fatal accidents caused by drunken drivers: 3
Fatalities: 6
Persons involved in fatal accidents: 16
Pedestrians involved in fatal accidents: 1
Fatal accident statistics in 2013:
Fatal accident count: 5
Vehicles involved in fatal accidents: 8
Fatal accidents caused by drunken drivers: 2
Fatalities: 5
Persons involved in fatal accidents: 10
Pedestrians involved in fatal accidents: 1
Home Mortgage Disclosure Act Aggregated Statistics For Year 2009 (Based on 10 full and 12 partial tracts)
A) FHA, FSA/RHS & VA Home Purchase Loans
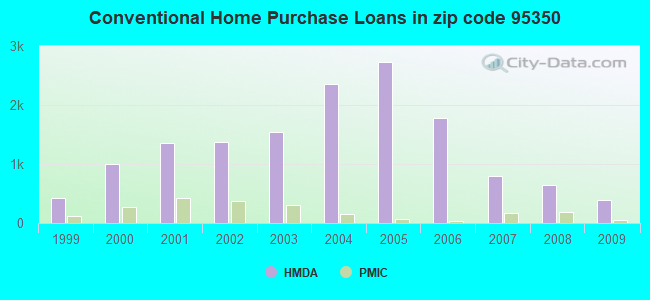
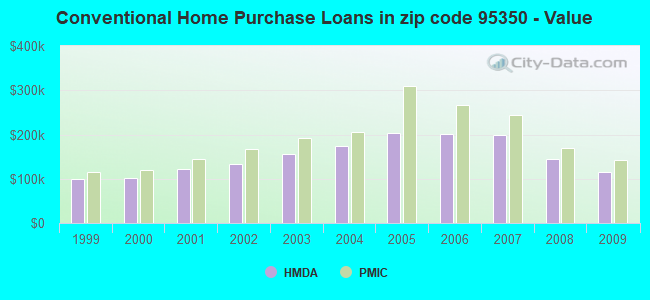
B) Conventional Home Purchase Loans
C) Refinancings
D) Home Improvement Loans
E) Loans on Dwellings For 5+ Families
F) Non-occupant Loans on < 5 Family Dwellings (A B C & D)
G) Loans On Manufactured Home Dwelling (A B C & D)
Number
Average Value
Number
Average Value
Number
Average Value
Number
Average Value
Number
Average Value
Number
Average Value
Number
Average Value
LOANS ORIGINATED
598
$144,412
394
$115,409
663
$165,099
29
$68,263
15
$621,229
220
$92,603
2
$15,000
APPLICATIONS APPROVED, NOT ACCEPTED
51
$135,102
45
$139,072
84
$174,501
5
$17,752
0
$0
22
$95,259
3
$145,393
APPLICATIONS DENIED
66
$116,409
92
$113,295
388
$175,280
33
$40,437
2
$3,606,770
108
$102,338
0
$0
APPLICATIONS WITHDRAWN
75
$136,413
67
$138,440
194
$163,860
9
$110,869
0
$0
55
$98,156
2
$233,355
FILES CLOSED FOR INCOMPLETENESS
6
$169,648
4
$116,930
66
$182,745
6
$251,363
0
$0
11
$180,058
0
$0
Aggregated Statistics For Year 2008 (Based on 10 full and 12 partial tracts)
A) FHA, FSA/RHS & VA Home Purchase Loans
B) Conventional Home Purchase Loans
C) Refinancings
D) Home Improvement Loans
E) Loans on Dwellings For 5+ Families
F) Non-occupant Loans on < 5 Family Dwellings (A B C & D)
G) Loans On Manufactured Home Dwelling (A B C & D)
Number
Average Value
Number
Average Value
Number
Average Value
Number
Average Value
Number
Average Value
Number
Average Value
Number
Average Value
LOANS ORIGINATED
467
$173,472
643
$145,618
541
$166,407
88
$89,633
12
$1,605,248
314
$131,932
7
$77,260
APPLICATIONS APPROVED, NOT ACCEPTED
53
$155,288
81
$174,975
132
$226,146
34
$44,584
0
$0
30
$153,736
5
$89,304
APPLICATIONS DENIED
77
$181,614
176
$159,971
625
$208,318
103
$87,675
4
$1,605,452
156
$170,214
13
$57,987
APPLICATIONS WITHDRAWN
40
$167,214
123
$149,049
236
$195,200
27
$89,582
1
$240,000
75
$163,470
0
$0
FILES CLOSED FOR INCOMPLETENESS
15
$199,185
40
$171,561
116
$201,003
6
$256,025
0
$0
27
$190,266
0
$0
Aggregated Statistics For Year 2007 (Based on 10 full and 12 partial tracts)
A) FHA, FSA/RHS & VA Home Purchase Loans
B) Conventional Home Purchase Loans
C) Refinancings
D) Home Improvement Loans
E) Loans on Dwellings For 5+ Families
F) Non-occupant Loans on < 5 Family Dwellings (A B C & D)
G) Loans On Manufactured Home Dwelling (A B C & D)
Number
Average Value
Number
Average Value
Number
Average Value
Number
Average Value
Number
Average Value
Number
Average Value
Number
Average Value
LOANS ORIGINATED
12
$255,189
792
$199,995
1,686
$203,175
240
$129,225
12
$1,326,228
348
$213,654
4
$145,418
APPLICATIONS APPROVED, NOT ACCEPTED
2
$297,405
203
$196,338
453
$232,690
79
$68,244
2
$1,258,600
74
$221,466
10
$53,487
APPLICATIONS DENIED
9
$225,350
469
$223,565
1,580
$250,720
219
$127,408
2
$360,000
274
$283,727
27
$64,050
APPLICATIONS WITHDRAWN
6
$231,267
154
$203,235
605
$230,379
52
$147,405
1
$699,240
75
$225,552
1
$244,300
FILES CLOSED FOR INCOMPLETENESS
0
$0
62
$222,853
226
$255,824
6
$378,360
0
$0
27
$259,866
0
$0
Aggregated Statistics For Year 2006 (Based on 10 full and 12 partial tracts)
A) FHA, FSA/RHS & VA Home Purchase Loans
B) Conventional Home Purchase Loans
C) Refinancings
D) Home Improvement Loans
E) Loans on Dwellings For 5+ Families
F) Non-occupant Loans on < 5 Family Dwellings (A B C & D)
G) Loans On Manufactured Home Dwelling (A B C & D)
Number
Average Value
Number
Average Value
Number
Average Value
Number
Average Value
Number
Average Value
Number
Average Value
Number
Average Value
LOANS ORIGINATED
5
$284,036
1,784
$202,073
3,127
$217,773
468
$140,496
16
$1,042,872
609
$220,084
7
$56,279
APPLICATIONS APPROVED, NOT ACCEPTED
2
$311,000
383
$200,251
611
$224,984
62
$173,939
0
$0
135
$229,293
4
$111,648
APPLICATIONS DENIED
0
$0
708
$202,771
1,506
$243,348
257
$124,502
3
$461,660
230
$253,282
6
$148,333
APPLICATIONS WITHDRAWN
2
$309,955
250
$230,101
1,055
$239,963
107
$173,666
0
$0
125
$247,069
4
$123,060
FILES CLOSED FOR INCOMPLETENESS
2
$301,000
67
$176,041
332
$243,611
18
$244,824
0
$0
29
$222,441
0
$0
Aggregated Statistics For Year 2005 (Based on 10 full and 12 partial tracts)
A) FHA, FSA/RHS & VA Home Purchase Loans
B) Conventional Home Purchase Loans
C) Refinancings
D) Home Improvement Loans
E) Loans on Dwellings For 5+ Families
F) Non-occupant Loans on < 5 Family Dwellings (A B C & D)
G) Loans On Manufactured Home Dwelling (A B C & D)
Number
Average Value
Number
Average Value
Number
Average Value
Number
Average Value
Number
Average Value
Number
Average Value
Number
Average Value
LOANS ORIGINATED
7
$254,261
2,727
$203,922
4,468
$208,765
467
$145,691
7
$2,038,013
1,027
$226,890
9
$136,479
APPLICATIONS APPROVED, NOT ACCEPTED
4
$230,385
507
$192,136
560
$228,522
69
$124,141
0
$0
175
$214,998
9
$94,389
APPLICATIONS DENIED
0
$0
850
$210,862
1,545
$219,422
280
$101,150
2
$992,010
341
$265,426
24
$85,388
APPLICATIONS WITHDRAWN
7
$162,217
488
$200,307
1,323
$213,993
207
$140,559
0
$0
210
$219,022
3
$79,890
FILES CLOSED FOR INCOMPLETENESS
0
$0
87
$194,418
399
$212,854
19
$154,896
0
$0
49
$187,847
0
$0
Aggregated Statistics For Year 2004 (Based on 10 full and 12 partial tracts)
A) FHA, FSA/RHS & VA Home Purchase Loans
B) Conventional Home Purchase Loans
C) Refinancings
D) Home Improvement Loans
E) Loans on Dwellings For 5+ Families
F) Non-occupant Loans on < 5 Family Dwellings (A B C & D)
G) Loans On Manufactured Home Dwelling (A B C & D)
Number
Average Value
Number
Average Value
Number
Average Value
Number
Average Value
Number
Average Value
Number
Average Value
Number
Average Value
LOANS ORIGINATED
39
$183,714
2,358
$172,955
3,761
$164,062
417
$105,061
14
$593,985
858
$173,608
6
$46,455
APPLICATIONS APPROVED, NOT ACCEPTED
2
$100,000
372
$182,771
560
$172,921
75
$98,436
2
$321,355
135
$206,377
10
$88,007
APPLICATIONS DENIED
3
$176,340
499
$199,567
1,342
$163,270
283
$71,820
0
$0
257
$208,234
20
$70,020
APPLICATIONS WITHDRAWN
16
$182,187
318
$183,696
1,063
$170,022
87
$81,030
2
$2,535,430
125
$182,604
3
$137,390
FILES CLOSED FOR INCOMPLETENESS
3
$194,667
75
$190,272
428
$168,007
28
$72,996
0
$0
45
$190,107
0
$0
Aggregated Statistics For Year 2003 (Based on 10 full and 12 partial tracts)
A) FHA, FSA/RHS & VA Home Purchase Loans
B) Conventional Home Purchase Loans
C) Refinancings
D) Home Improvement Loans
E) Loans on Dwellings For 5+ Families
F) Non-occupant Loans on < 5 Family Dwellings (A B C & D)
Number
Average Value
Number
Average Value
Number
Average Value
Number
Average Value
Number
Average Value
Number
Average Value
LOANS ORIGINATED
153
$162,945
1,548
$154,974
6,376
$141,288
192
$37,831
22
$759,309
874
$130,978
APPLICATIONS APPROVED, NOT ACCEPTED
11
$187,196
196
$150,155
725
$147,684
59
$43,551
2
$1,047,900
77
$144,361
APPLICATIONS DENIED
8
$193,150
284
$136,975
1,590
$144,245
176
$39,240
2
$249,500
170
$139,876
APPLICATIONS WITHDRAWN
21
$176,443
216
$155,372
1,288
$147,529
34
$45,807
2
$95,950
104
$134,723
FILES CLOSED FOR INCOMPLETENESS
0
$0
42
$174,665
219
$150,458
11
$47,957
0
$0
21
$137,569
Aggregated Statistics For Year 2002 (Based on 9 full and 10 partial tracts)
A) FHA, FSA/RHS & VA Home Purchase Loans
B) Conventional Home Purchase Loans
C) Refinancings
D) Home Improvement Loans
E) Loans on Dwellings For 5+ Families
F) Non-occupant Loans on < 5 Family Dwellings (A B C & D)
Number
Average Value
Number
Average Value
Number
Average Value
Number
Average Value
Number
Average Value
Number
Average Value
LOANS ORIGINATED
231
$145,790
1,376
$134,298
3,832
$127,567
151
$30,665
28
$869,190
591
$110,114
APPLICATIONS APPROVED, NOT ACCEPTED
14
$137,523
151
$140,968
498
$120,043
49
$29,233
0
$0
50
$121,257
APPLICATIONS DENIED
36
$155,330
250
$113,731
943
$122,748
154
$25,195
0
$0
101
$121,837
APPLICATIONS WITHDRAWN
19
$153,041
151
$138,155
799
$131,011
25
$35,718
0
$0
71
$112,110
FILES CLOSED FOR INCOMPLETENESS
4
$145,708
36
$145,732
180
$124,297
0
$0
0
$0
14
$124,301
Aggregated Statistics For Year 2001 (Based on 9 full and 10 partial tracts)
A) FHA, FSA/RHS & VA Home Purchase Loans
B) Conventional Home Purchase Loans
C) Refinancings
D) Home Improvement Loans
E) Loans on Dwellings For 5+ Families
F) Non-occupant Loans on < 5 Family Dwellings (A B C & D)
Number
Average Value
Number
Average Value
Number
Average Value
Number
Average Value
Number
Average Value
Number
Average Value
LOANS ORIGINATED
421
$129,211
1,356
$122,319
2,940
$119,108
174
$30,217
7
$736,497
491
$103,808
APPLICATIONS APPROVED, NOT ACCEPTED
14
$113,326
144
$120,572
361
$113,205
32
$23,998
0
$0
48
$114,665
APPLICATIONS DENIED
35
$132,288
223
$102,479
931
$98,924
103
$20,956
2
$319,425
91
$102,044
APPLICATIONS WITHDRAWN
38
$124,450
169
$119,951
829
$117,385
62
$29,938
2
$585,900
70
$101,358
FILES CLOSED FOR INCOMPLETENESS
7
$130,430
32
$102,205
113
$103,649
6
$22,985
0
$0
20
$90,914
Aggregated Statistics For Year 2000 (Based on 9 full and 10 partial tracts)
A) FHA, FSA/RHS & VA Home Purchase Loans
B) Conventional Home Purchase Loans
C) Refinancings
D) Home Improvement Loans
E) Loans on Dwellings For 5+ Families
F) Non-occupant Loans on < 5 Family Dwellings (A B C & D)
Number
Average Value
Number
Average Value
Number
Average Value
Number
Average Value
Number
Average Value
Number
Average Value
LOANS ORIGINATED
487
$108,090
1,008
$101,381
643
$85,460
168
$27,187
4
$477,105
220
$87,827
APPLICATIONS APPROVED, NOT ACCEPTED
25
$108,094
101
$101,140
150
$82,491
87
$28,039
2
$243,040
13
$70,301
APPLICATIONS DENIED
29
$117,594
244
$89,259
545
$70,400
198
$23,940
4
$560,542
53
$77,659
APPLICATIONS WITHDRAWN
38
$109,044
125
$94,196
306
$76,500
27
$29,376
0
$0
22
$94,527
FILES CLOSED FOR INCOMPLETENESS
15
$88,083
25
$94,480
78
$102,649
7
$32,081
0
$0
12
$80,682
Aggregated Statistics For Year 1999 (Based on 4 full and 8 partial tracts)
A) FHA, FSA/RHS & VA Home Purchase Loans
B) Conventional Home Purchase Loans
C) Refinancings
D) Home Improvement Loans
E) Loans on Dwellings For 5+ Families
F) Non-occupant Loans on < 5 Family Dwellings (A B C & D)
2005 - 2018 National Fire Incident Reporting System (NFIRS) incidents
According to the data from the years 2005 - 2018 the average number of fire incidents per year is 185. The highest number of fires - 473 took place in 2005, and the least - 6 in 2013. The data has a declining trend.
When looking into fire subcategories, the most incidents belonged to: Outside Fires (44.7%), and Structure Fires (35.8%).
Fire incident types reported to NFIRS in Zip Code 95350


 Nearest zip codes: 95351, 95356, 95354, 95355, 95367, 95368.


 . Federal Facility
 According to the data from the years 2005 - 2018 the average number of fire incidents per year is 185. The highest number of fires - 473 took place in 2005, and the least - 6 in 2013. The data has a declining trend.
 When looking into fire subcategories, the most incidents belonged to: Outside Fires (44.7%), and Structure Fires (35.8%).