Estimated zip code population in 2022: 14,741 Zip code population in 2010: 14,799 Zip code population in 2000: 14,410
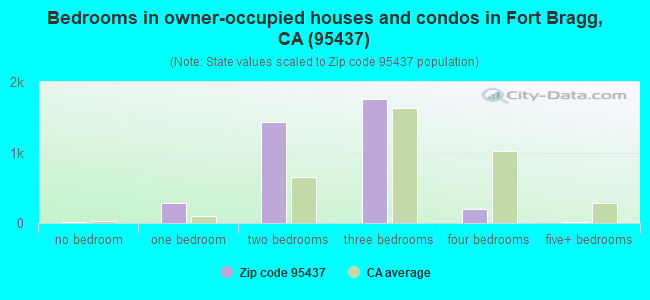
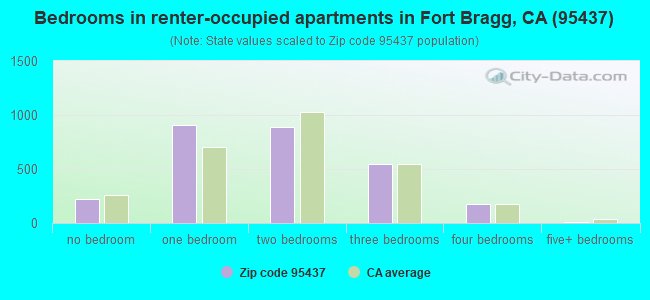
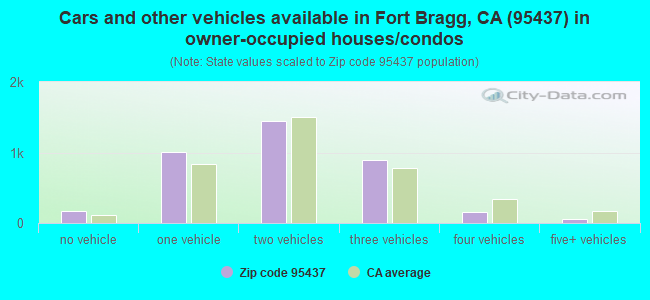
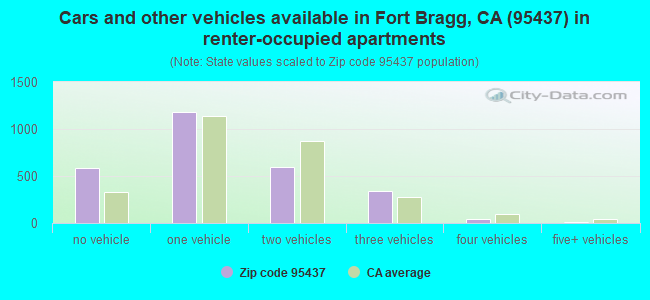
Houses and condos: 7,814 Renter-occupied apartments: 2,746
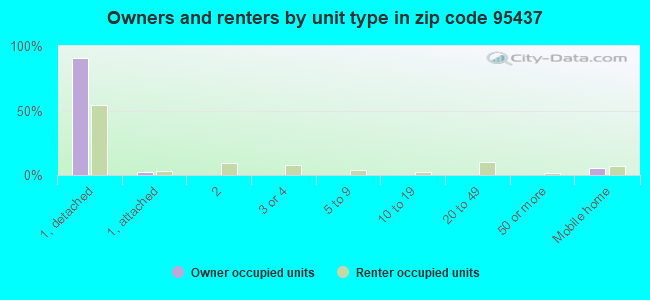
% of renters here:
42%
State:
44%
March 2022 cost of living index in zip code 95437: 102.6 (near average, U.S. average is 100)
Land area: 97.8 sq. mi. Water area: 4.0 sq. mi.
Population density: 151 people per square mile
(very low).
OSM Map
General Map
Google Map
MSN Map
OSM Map
General Map
Google Map
MSN Map
OSM Map
General Map
Google Map
MSN Map
OSM Map
General Map
Google Map
MSN Map
Please wait while loading the map...
Real estate property taxes paid for housing units in 2022:
This zip code:
0.6% ($3,442)
California:
0.7% ($4,831)
Median real estate property taxes paid for housing units with mortgages in 2022: $4,081 (0.7%) Median real estate property taxes paid for housing units with no mortgage in 2022: $2,888 (0.6%)
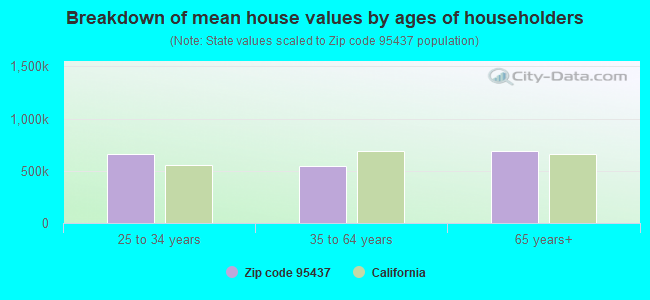
Estimated median house/condo value in 2022: $537,278
95437:
$537,278
California:
$715,900
According to our research of California and other state lists, there were 19 registered sex offenders living in 95437 zip code as of April 27, 2024. The ratio of all residents to sex offenders in zip code 95437 is 778 to 1. The ratio of registered sex offenders to all residents in this zip code is near the state average.
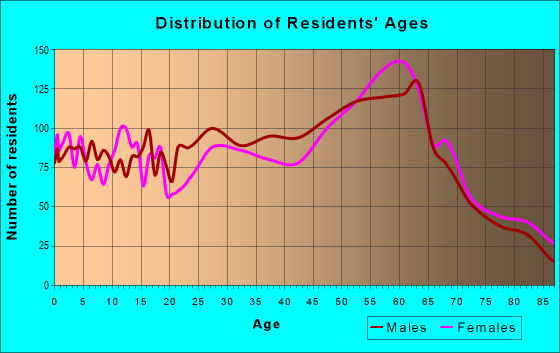
Median resident age:
This zip code:
50.9 years
California median age:
37.9 years
Average household size:
This zip code:
2.2 people
California:
2.8 people
Averages for the 2020 tax year for zip code 95437, filed in 2021:
Average Adjusted Gross Income (AGI) in 2020: $55,273 (Individual Income Tax Returns)
Here:
$55,273
State:
$95,910
Salary/wage: $41,116 (reported on 70.5% of returns)
Here:
$41,116
State:
$77,331
(% of AGI for various income ranges: 1237.9% for AGIs below $25k, 4040.0% for AGIs $25k-50k, 7028.0% for AGIs $50k-75k, 9477.2% for AGIs $75k-100k, 16309.1% for AGIs $100k-200k, 65636.7% for AGIs over 200k)
Taxable interest for individuals: $1,947 (reported on 36.1% of returns)
This zip code:
$1,947
California:
$2,294
(% of AGI for various income ranges: 38.0% for AGIs below $25k, 40.8% for AGIs $25k-50k, 85.0% for AGIs $50k-75k, 199.7% for AGIs $75k-100k, 369.1% for AGIs $100k-200k, 5500.0% for AGIs over 200k)
Ordinary dividends: $8,192 (reported on 18.2% of returns)
Here:
$8,192
State:
$10,949
(% of AGI for various income ranges: 60.0% for AGIs below $25k, 70.8% for AGIs $25k-50k, 192.8% for AGIs $50k-75k, 305.5% for AGIs $75k-100k, 773.1% for AGIs $100k-200k, 14413.3% for AGIs over 200k)
Net capital gain/loss in AGI: +$28,381 (reported on 18.1% of returns)
Here:
+$28,381
State:
+$49,306
(% of AGI for various income ranges: 20.8% for AGIs below $25k, 68.6% for AGIs $25k-50k, 167.8% for AGIs $50k-75k, 450.3% for AGIs $75k-100k, 1722.8% for AGIs $100k-200k, 89803.3% for AGIs over 200k)
Profit/loss from business: +$15,519 (reported on 21.4% of returns)
Here:
+$15,519
State:
+$15,671
(% of AGI for various income ranges: 217.9% for AGIs below $25k, 303.6% for AGIs $25k-50k, 661.1% for AGIs $50k-75k, 994.1% for AGIs $75k-100k, 1828.8% for AGIs $100k-200k, 13936.7% for AGIs over 200k)
Taxable individual retirement arrangement distribution: $14,659 (reported on 10.5% of returns)
95437:
$14,659
California:
$23,505
(% of AGI for various income ranges: 72.9% for AGIs below $25k, 129.7% for AGIs $25k-50k, 353.3% for AGIs $50k-75k, 465.9% for AGIs $75k-100k, 995.3% for AGIs $100k-200k, 5696.7% for AGIs over 200k)
Self-employed (Keogh) retirement plans: $17,260 (reported on 0.7% of returns)
95437:
$17,260
California:
$30,163
(% of AGI for various income ranges: 269.7% for AGIs $100k-200k)
Total itemized deductions: $33,423 (reported on 8.2% of returns)
Here:
$33,423
State:
$39,517
(% of AGI for various income ranges: 106.4% for AGIs below $25k, 165.6% for AGIs $25k-50k, 547.8% for AGIs $50k-75k, 752.8% for AGIs $75k-100k, 1600.0% for AGIs $100k-200k, 17826.7% for AGIs over 200k)
Charity contributions: $5,314 (reported on 6.3% of returns)
Here:
$5,314
State:
$12,598
(% of AGI for various income ranges: 4.8% for AGIs below $25k, 12.2% for AGIs $25k-50k, 42.0% for AGIs $50k-75k, 78.3% for AGIs $75k-100k, 270.3% for AGIs $100k-200k, 2696.7% for AGIs over 200k)
Taxes paid: $7,605 (reported on 8.2% of returns)
95437:
$7,605
State:
$8,807
(% of AGI for various income ranges: 20.9% for AGIs below $25k, 34.9% for AGIs $25k-50k, 137.6% for AGIs $50k-75k, 213.8% for AGIs $75k-100k, 488.4% for AGIs $100k-200k, 2350.0% for AGIs over 200k)
Earned income credit: $1,875 (reported on 15.4% of returns)
Here:
$1,875
State:
$2,074
(% of AGI for various income ranges: 91.3% for AGIs below $25k, 59.2% for AGIs $25k-50k, 2.4% for AGIs $50k-75k)
Percentage of individuals using paid preparers for their 2020 taxes: 92.8%
Here:
93%
State:
92%
(% for various income ranges: 90.3% for AGIs below $25k, 93.7% for AGIs $25k-50k, 94.1% for AGIs $50k-75k, 96.4% for AGIs $75k-100k, 94.4% for AGIs $100k-200k, 95.0% for AGIs over 200k)
Averages for the 2012 tax year for zip code 95437, filed in 2013:
Average Adjusted Gross Income (AGI) in 2012: $44,430 (Individual Income Tax Returns)
Here:
$44,430
State:
$72,726
Salary/wage: $33,396 (reported on 74.8% of returns)
Here:
$33,396
State:
$59,079
(% of AGI for various income ranges: 67.2% for AGIs below $25k, 69.6% for AGIs $25k-50k, 62.7% for AGIs $50k-75k, 58.8% for AGIs $75k-100k, 47.8% for AGIs $100k-200k, 26.1% for AGIs over 200k)
Taxable interest for individuals: $1,952 (reported on 33.8% of returns)
This zip code:
$1,952
California:
$2,146
(% of AGI for various income ranges: 1.8% for AGIs below $25k, 1.1% for AGIs $25k-50k, 0.9% for AGIs $50k-75k, 1.3% for AGIs $75k-100k, 2.1% for AGIs $100k-200k, 2.0% for AGIs over 200k)
Ordinary dividends: $5,405 (reported on 18.6% of returns)
Here:
$5,405
State:
$9,308
(% of AGI for various income ranges: 2.6% for AGIs below $25k, 1.5% for AGIs $25k-50k, 1.5% for AGIs $50k-75k, 2.5% for AGIs $75k-100k, 3.4% for AGIs $100k-200k, 2.4% for AGIs over 200k)
Net capital gain/loss in AGI: +$6,385 (reported on 16.8% of returns)
Here:
+$6,385
State:
+$30,460
(% of AGI for various income ranges: 0.4% for AGIs $25k-50k, 1.0% for AGIs $50k-75k, 1.7% for AGIs $75k-100k, 3.6% for AGIs $100k-200k, 8.8% for AGIs over 200k)
Profit/loss from business: +$19,711 (reported on 23.1% of returns)
Here:
+$19,711
State:
+$17,064
(% of AGI for various income ranges: 13.3% for AGIs below $25k, 9.0% for AGIs $25k-50k, 9.4% for AGIs $50k-75k, 8.4% for AGIs $75k-100k, 12.8% for AGIs $100k-200k, 9.3% for AGIs over 200k)
Taxable individual retirement arrangement distribution: $12,664 (reported on 11.6% of returns)
95437:
$12,664
California:
$19,557
(% of AGI for various income ranges: 3.2% for AGIs below $25k, 2.4% for AGIs $25k-50k, 2.9% for AGIs $50k-75k, 4.1% for AGIs $75k-100k, 6.8% for AGIs $100k-200k)
Self-employment retirement plans: $15,629 (reported on 1.2% of returns)
95437:
$15,629
California:
$24,530
Total itemized deductions: $22,726 (26% of AGI, reported on 26.7% of returns)
Here:
$22,726
State:
$34,004
Here:
26.3% of AGI
State:
22.7% of AGI
(% of AGI for various income ranges: 10.5% for AGIs below $25k, 10.5% for AGIs $25k-50k, 13.6% for AGIs $50k-75k, 15.9% for AGIs $75k-100k, 16.7% for AGIs $100k-200k, 15.3% for AGIs over 200k)
Charity contributions: $2,132 (reported on 20.8% of returns)
Here:
$2,132
State:
$4,659
(% of AGI for various income ranges: 0.5% for AGIs below $25k, 0.7% for AGIs $25k-50k, 0.9% for AGIs $50k-75k, 1.3% for AGIs $75k-100k, 1.6% for AGIs $100k-200k, 1.1% for AGIs over 200k)
Taxes paid: $7,848 (reported on 26.4% of returns)
95437:
$7,848
State:
$14,448
(% of AGI for various income ranges: 2.2% for AGIs below $25k, 2.6% for AGIs $25k-50k, 3.9% for AGIs $50k-75k, 4.9% for AGIs $75k-100k, 6.5% for AGIs $100k-200k, 8.3% for AGIs over 200k)
Earned income credit: $1,903 (reported on 19.6% of returns)
Here:
$1,903
State:
$2,286
(% of AGI for various income ranges: 5.1% for AGIs below $25k, 0.9% for AGIs $25k-50k)
Percentage of individuals using paid preparers for their 2012 taxes: 69.6%
Here:
70%
State:
64%
(% for various income ranges: 64.7% for AGIs below $25k, 70.8% for AGIs $25k-50k, 73.7% for AGIs $50k-75k, 73.9% for AGIs $75k-100k, 78.9% for AGIs $100k-200k, 100.0% for AGIs over 200k)
Averages for the 2004 tax year for zip code 95437, filed in 2005:
Average Adjusted Gross Income (AGI) in 2004: $37,706 (Individual Income Tax Returns)
Here:
$37,706
State:
$58,600
Salary/wage: $28,524 (reported on 75.7% of returns)
Here:
$28,524
State:
$49,455
(% of AGI for various income ranges: 108.3% for AGIs below $10k, 67.1% for AGIs $10k-25k, 70.5% for AGIs $25k-50k, 65.3% for AGIs $50k-75k, 63.8% for AGIs $75k-100k, 29.6% for AGIs over 100k)
Taxable interest for individuals: $2,240 (reported on 49.4% of returns)
This zip code:
$2,240
California:
$2,365
(% of AGI for various income ranges: 11.3% for AGIs below $10k, 3.0% for AGIs $10k-25k, 2.4% for AGIs $25k-50k, 2.3% for AGIs $50k-75k, 2.1% for AGIs $75k-100k, 3.6% for AGIs over 100k)
Taxable dividends: $3,261 (reported on 25.0% of returns)
Here:
$3,261
State:
$4,746
(% of AGI for various income ranges: 8.2% for AGIs below $10k, 1.9% for AGIs $10k-25k, 1.5% for AGIs $25k-50k, 1.8% for AGIs $50k-75k, 2.0% for AGIs $75k-100k, 2.8% for AGIs over 100k)
Net capital gain/loss: +$17,676 (reported on 22.3% of returns)
Here:
+$17,676
State:
+$23,418
(% of AGI for various income ranges: -1.2% for AGIs below $10k, 0.4% for AGIs $10k-25k, 1.3% for AGIs $25k-50k, 3.0% for AGIs $50k-75k, 3.8% for AGIs $75k-100k, 31.8% for AGIs over 100k)
Profit/loss from business: +$15,936 (reported on 23.4% of returns)
Here:
+$15,936
State:
+$16,826
(% of AGI for various income ranges: 16.8% for AGIs below $10k, 11.5% for AGIs $10k-25k, 7.4% for AGIs $25k-50k, 9.0% for AGIs $50k-75k, 11.7% for AGIs $75k-100k, 10.8% for AGIs over 100k)
IRA payment deduction: $3,147 (reported on 4.2% of returns)
95437:
$3,147
California:
$3,192
(% of AGI for various income ranges: 1.0% for AGIs below $10k, 0.4% for AGIs $10k-25k, 0.4% for AGIs $25k-50k, 0.5% for AGIs $50k-75k, 0.3% for AGIs $75k-100k, 0.2% for AGIs over 100k)
Self-employed pension: $11,078 (reported on 1.6% of returns)
Here:
$11,078
California:
$17,688
(% of AGI for various income ranges: 0.1% for AGIs $10k-25k, 0.2% for AGIs $25k-50k, 0.5% for AGIs $50k-75k, 0.6% for AGIs $75k-100k, 0.9% for AGIs over 100k)
Total itemized deductions: $19,411 (27% of AGI, reported on 28.2% of returns)
Here:
$19,411
State:
$28,113
Here:
26.9% of AGI
State:
25.3% of AGI
(% of AGI for various income ranges: 30.7% for AGIs below $10k, 11.0% for AGIs $10k-25k, 13.1% for AGIs $25k-50k, 15.3% for AGIs $50k-75k, 17.0% for AGIs $75k-100k, 14.9% for AGIs over 100k)
Charity contributions deductions: $1,972 (3% of AGI, reported on 23.5% of returns)
Here:
$1,972
State:
$3,923
Here:
2.5% of AGI
State:
3.3% of AGI
(% of AGI for various income ranges: 1.2% for AGIs below $10k, 0.7% for AGIs $10k-25k, 0.9% for AGIs $25k-50k, 1.5% for AGIs $50k-75k, 1.4% for AGIs $75k-100k, 1.5% for AGIs over 100k)
Total tax: $5,395 (reported on 74.0% of returns)
95437:
$5,395
State:
$10,761
(% of AGI for various income ranges: 4.6% for AGIs below $10k, 4.9% for AGIs $10k-25k, 7.1% for AGIs $25k-50k, 9.7% for AGIs $50k-75k, 11.9% for AGIs $75k-100k, 16.8% for AGIs over 100k)
Earned income credit: $1,434 (reported on 16.3% of returns)
Here:
$1,434
State:
$1,763
Percentage of individuals using paid preparers for their 2004 taxes: 71.7%
Here:
72%
State:
66%
(% for various income ranges: 63.3% for AGIs below $10k, 69.4% for AGIs $10k-25k, 73.3% for AGIs $25k-50k, 79.4% for AGIs $50k-75k, 75.4% for AGIs $75k-100k, 87.6% for AGIs over 100k)
Likely homosexual households (counted as self-reported same-sex unmarried-partner households)
Lesbian couples: 0.2% of all households
Gay men: 0.0% of all households
Household received Food Stamps/SNAP in the past 12 months: 1,523 Household did not receive Food Stamps/SNAP in the past 12 months: 5,103
Women who had a birth in the past 12 months: 102 (50 now married, 52 unmarried) Women who did not have a birth in the past 12 months: 2,315 (1,031 now married, 1,279 unmarried)
Housing units in zip code 95437 with a mortgage: 1,854 (101 second mortgage, 5 home equity loan, 71 both second mortgage and home equity loan) Houses without a mortgage: 23
Median monthly owner costs for units with a mortgage: $2,001 Median monthly owner costs for units without a mortgage: $727
Residents with income below the poverty level in 2022:
This zip code:
15.6%
Whole state:
12.2%
Residents with income below 50% of the poverty level in 2022:
This zip code:
8.9%
Whole state:
6.2%
Median number of rooms in houses and condos:
Here:
5.2
State:
6.0
Median number of rooms in apartments:
Here:
3.9
State:
3.9
Notable locations in this zip code not listed on our city pages
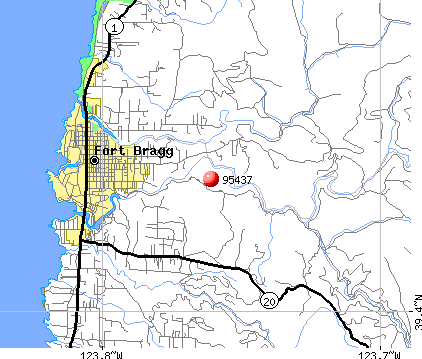
Notable locations in zip code 95437: McDonald Ranch (A), City of Fort Bragg Wastewater Treatment Plant (B), Parlin Fork Conservation Camp (C), Hayshed Siding (D), Fort Bragg Landing (E), McGuire Mill (F), Surfwood Campground (G), Pinewood Campground (H), Cleone Campground (I), Mendocino Coast Botanical Gardens (J), Fort Bragg City Hall (K), Fort Bragg Branch Mendocino County Library (L), Fort Bragg Grange (M), California Department of Forestry and Fire Protection Fort Bragg (N), Fort Bragg Volunteer Fire Department Station 2 (O), Fort Bragg Volunteer Fire Department Station 830 (P). Display/hide their locations on the map
Churches in zip code 95437 include: Evergreen United Methodist Church (A), First Baptist Church (B), Fort Bragg Seventh Day Adventist Church (C), Grace Community Church (D), Lighthouse Foursquare Gospel Church (E), Our Lady of Good Counsel Roman Catholic Church (F), Saint Michael and All Angels Episcopal Church (G), Trinity Lutheran Church (H). Display/hide their locations on the map
Rivers and creeks: Campbell Creek (A), Chamberlain Creek (B), Churchman Creek (C), Digger Creek (D), Hare Creek (E), Inglenook Creek (F), Kass Creek (G), Little Valley Creek (H), Mitchell Creek (I). Display/hide their locations on the map
Parks in zip code 95437 include: Green Memorial Park (1), Main Street Historic Commercial District (2), Otis R Johnson Park (3), MacKerricher State Park (4). Display/hide their locations on the map
In group quarters: 322 (-1 institutionalized population)
Size of family households: 1,710 2-persons, 817 3-persons, 509 4-persons, 271 5-persons, 31 6-persons, 77 7-or-more-persons
Size of nonfamily households: 2,627 1-person, 482 2-persons
1,344 married couples with children.
1,179 single-parent households (290 men, 889 women).
84.6% of residents of 95437 zip code speak English at home.
12.4% of residents speak Spanish at home (62% very well, 20% well, 12% not well, 6% not at all).
1.5% of residents speak other Indo-European language at home (87% very well, 13% well).
1.4% of residents speak Asian or Pacific Island language at home (61% very well, 27% well, 5% not well, 7% not at all).
0.1% of residents speak other language at home (100% very well).
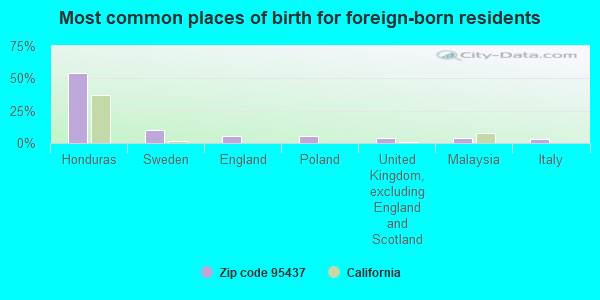
Foreign born population: 1,573 (10.7%) (47.0% of them are naturalized citizens)
This zip code:
10.7%
Whole state:
26.7%
54%Honduras
10%Sweden
6%England
6%Poland
4%United Kingdom, excluding England and Scotland
4%Malaysia
3%Italy
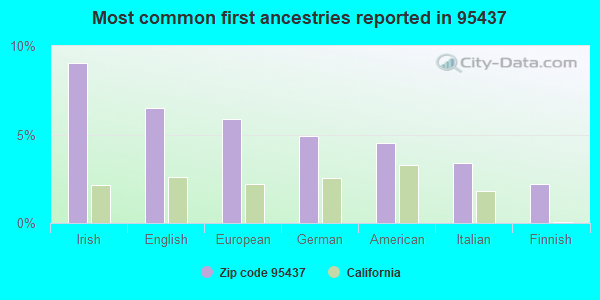
9%Irish
7%English
6%European
5%German
5%American
3%Italian
2%Finnish
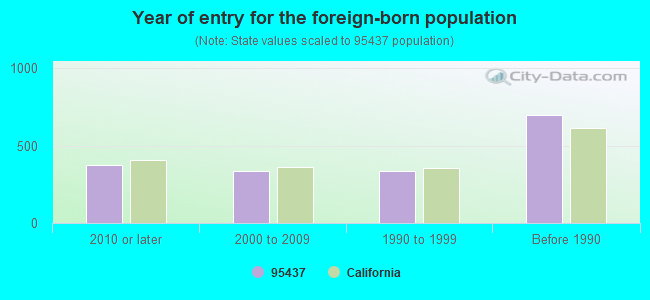
Year of entry for the foreign-born population
3752010 or later
3352000 to 2009
3391990 to 1999
698Before 1990
Major facilities with environmental interests located in this zip code:
GEORGIA PACIFIC WEST CORPORATION FT BRAGG SAWMILL (90 W. REDWOOD AVE. in FORT BRAGG, CA)
STATE MASTER (California - Hazardous Waste Tracking) - HAZARDOU WASTE PROGRAM ENFORCEMENT/COMPLIANCE ACTIVITY (Integrated Compliance Information System) COMPLIANCE ACTIVITY (Tracking inspections of insecticide, fungicide, and rodenticide, and toxic substances) CRITERIA AND HAZARDOUS AIR POLLUTANT INVENTORY (Inventory of air pollution sources) Large Quantity Generators, more that 1000 kg of hazardous waste/month (Resource Conservation and Recovery Act (tracking hazardous waste)) TRI REPORTER (Tracking of toxic chemicals releasing facilities) Business SIC classification: SAWMILLS AND PLANING MILLS, GENERAL Business NAICS classification: SAWMILLS. Organizations: GEORGIA-PACIFIC (CONTACT/OPERATOR)
Alternative names: GEORGIA PACIFIC CORPORATION, GEORGIA PACIFIC - FORT BRAGG FACILITY, GEORGIA PACIFIC WEST INC
MENDOCINO COAST DISTRICT HOSPITAL (700 RIVER DRIVE in FORT BRAGG, CA)
STATE MASTER (California - Hazardous Waste Tracking) - HAZARDOU WASTE PROGRAM Small Quantity Generators, between 100 kg and 1000 kg of hazardous waste/month (Resource Conservation and Recovery Act (tracking hazardous waste)) - notification Organizations: NEBDICUBI COAST DISTRICT HOSPITAL (CONTACT/OWNER)
FORT BRAGG DIESEL (32388 N MITCHELL CREEK in FORT BRAGG, CA)
STATE MASTER (California - Hazardous Waste Tracking) - HAZARDOU WASTE PROGRAM Small Quantity Generators, between 100 kg and 1000 kg of hazardous waste/month (Resource Conservation and Recovery Act (tracking hazardous waste)) - notification Organizations: GARY LANCASTER (CONTACT/OWNER)
MENDOCINO FOREST PROD LLC-FORT BRAGG STU (32600 HOLIQUIST LN in FORT BRAGG, CA) . Federal Facility
SUPERFUND (Superfund database) STATE MASTER (California - Hazardous Waste Tracking) - HAZARDOU WASTE PROGRAM TRI REPORTER (Tracking of toxic chemicals releasing facilities) Business SIC classification: SAWMILLS AND PLANING MILLS, GENERAL Alternative names: LOUSIANA PACIFIC-FORT BRAGG STUDMILL, MENDOCINO FOREST PRODS. L.L.C., MENDOCINO FOREST PRODS. L.L.C. FORT BRAGG SAWMILL
CAL TRANS FORT BRAGG MS (N FRANKLIN & MANZANITA in FORT BRAGG, CA)
STATE MASTER (California - Hazardous Waste Tracking) - HAZARDOU WASTE PROGRAM Small Quantity Generators, between 100 kg and 1000 kg of hazardous waste/month (Resource Conservation and Recovery Act (tracking hazardous waste)) Alternative names: CALTRANS DISTRICT 1
CALIFORNIA WESTERN RAILROAD (FOOT OF LAUREL ST in FORT BRAGG, CA)
STATE MASTER (California - Hazardous Waste Tracking) - HAZARDOU WASTE PROGRAM Small Quantity Generators, between 100 kg and 1000 kg of hazardous waste/month (Resource Conservation and Recovery Act (tracking hazardous waste))
FORT BRAGG HIGH (300 DANA ST. in FORT BRAGG, CA)
(National Center for Education Statistics) - STATE ID-2331361 Organizations: FORT BRAGG UNIFIED (SCHOOL DISTRICT)
FORT BRAGG MIDDLE (500 HAROLD ST. in FORT BRAGG, CA)
(National Center for Education Statistics) - STATE ID-6061667 Organizations: FORT BRAGG UNIFIED (SCHOOL DISTRICT)
GRAY (DANA) ELEMENTARY (1197 E. CHESTNUT ST. in FORT BRAGG, CA)
(National Center for Education Statistics) - STATE ID-6025100 Organizations: FORT BRAGG UNIFIED (SCHOOL DISTRICT)
LIGHTHOUSE COMMUNITY DAY (300C DANA STREET in FT BRAGG, CA)
(National Center for Education Statistics) - STATE ID-2330355 Organizations: FORT BRAGG UNIFIED (SCHOOL DISTRICT)
NOYO HIGH (CONT.) (250 S. SANDERSON WAY in FORT BRAGG, CA)
(National Center for Education Statistics) - STATE ID-2330215 Organizations: FORT BRAGG UNIFIED (SCHOOL DISTRICT)
LP-FORT BRAGG (GIBNEY LANE in FORT BRAGG, CA)
National Pollutant Discharge Elimination System NON-MAJOR (Tracking pollutant discharge elimination systems) - permit Business SIC classification: SAWMILLS AND PLANING MILLS, GENERAL Organizations: LOUISIANA PACIFIC CORPORATION (CONTACT/OWNER)
Alternative names: LOUISIANA PACIFIC CORPORATION
JACKS MUFFLER SHOP (110 MANZANITA in FORT BRAGG, CA)
Small Quantity Generators, between 100 kg and 1000 kg of hazardous waste/month (Resource Conservation and Recovery Act (tracking hazardous waste)) - notification Business NAICS classification: AUTOMOTIVE EXHAUST SYSTEM REPAIR. Organizations: JAK LUOMA (CONTACT/OWNER)
Housing units lacking complete plumbing facilities: 1.2% Housing units lacking complete kitchen facilities: 1.6%
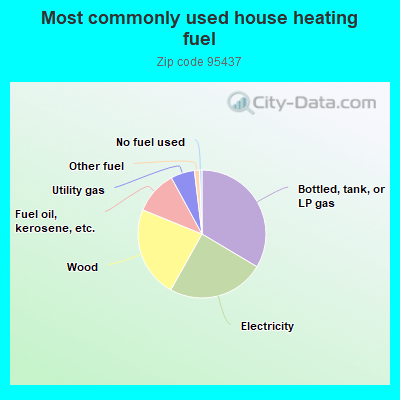
33.5%Bottled, tank, or LP gas
24.5%Electricity
23.0%Wood
10.9%Fuel oil, kerosene, etc.
6.0%Utility gas
1.3%Other fuel
0.6%No fuel used
Population in 1990: 13,535. Population change in the 1990s: +875 (+6.5%).
Place of birth for U.S.-born residents:
This state: 9,855
Northeast: 651
Midwest: 973
South: 700
West: 752
57% of the 95437 zip code residents lived in the same house 5 years ago. Out of people who lived in different houses, 60% lived in this county. Out of people who lived in different counties, 50% lived in California.
90% of the 95437 zip code residents lived in the same house 1 year ago. Out of people who lived in different houses, 49% moved from this county. Out of people who lived in different houses, 31% moved from different county within same state. Out of people who lived in different houses, 19% moved from different state. Out of people who lived in different houses, 1% moved from abroad.
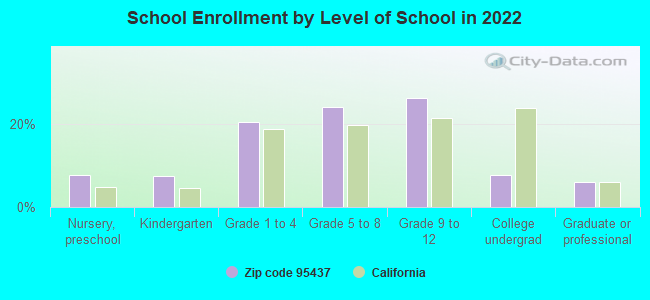
Private vs. public school enrollment:
Students in private schools in grades 1 to 8 (elementary and middle school): 65
Here:
5.8%
California:
10.5%
Students in private schools in grades 9 to 12 (high school): 65
Here:
9.8%
California:
8.5%
Students in private undergraduate colleges:
Here:
0.0%
California:
15.9%
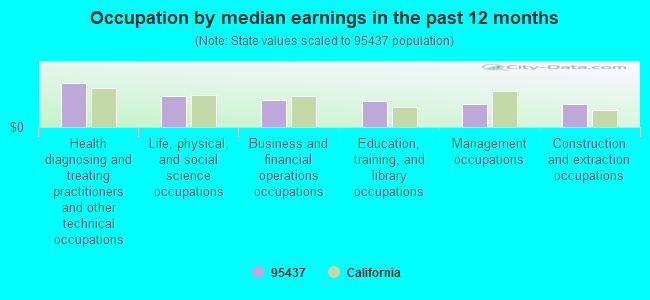
Occupation by median earnings in the past 12 months ($)
108,900Health diagnosing and treating practitioners and other technical occupations
77,503Life, physical, and social science occupations
67,485Business and financial operations occupations
64,162Education, training, and library occupations
57,262Management occupations
56,448Construction and extraction occupations
Top industries in this zip code by the number of employees in 2005:
66 people in nursing facilities/skilled-nursing facilities
54 people in emergency and transitional shelters (with sleeping facilities) for people experiencing homelessness
20 people in residential treatment centers for adults
13 people in workers' group living quarters and job corps centers
4 people in group homes for juveniles (non-correctional)
People in group quarters in 2000:
212 people in agriculture workers' dormitories on farms
78 people in nursing homes
37 people in other noninstitutional group quarters
14 people in homes or halfway houses for drug/alcohol abuse
6 people in hospitals/wards and hospices for chronically ill
6 people in other hospitals or wards for chronically ill
4 people in homes for the mentally retarded
Fatal accident statistics in 2014:
Fatal accident count: 2
Vehicles involved in fatal accidents: 3
Fatal accidents caused by drunken drivers: 0
Fatalities: 2
Persons involved in fatal accidents: 4
Pedestrians involved in fatal accidents: 1
Fatal accident statistics in 2013:
Fatal accident count: 1
Vehicles involved in fatal accidents: 1
Fatal accidents caused by drunken drivers: 1
Fatalities: 1
Persons involved in fatal accidents: 2
Pedestrians involved in fatal accidents: 0
2005 - 2018 National Fire Incident Reporting System (NFIRS) incidents
According to the data from the years 2005 - 2018 the average number of fire incidents per year is 42. The highest number of reported fire incidents - 93 took place in 2007, and the least - 19 in 2012. The data has a dropping trend.
When looking into fire subcategories, the most reports belonged to: Outside Fires (47.8%), and Structure Fires (36.6%).
Fire incident types reported to NFIRS in Zip Code 95437
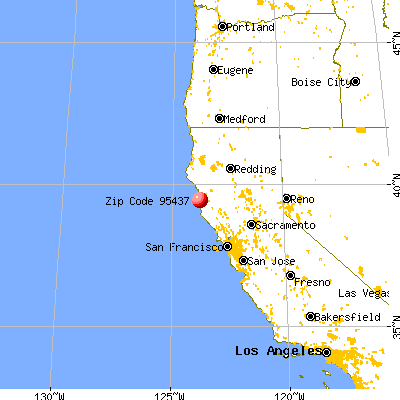


 Nearest zip codes: 95420, 95460, 95488, 95456, 95417, 95410.
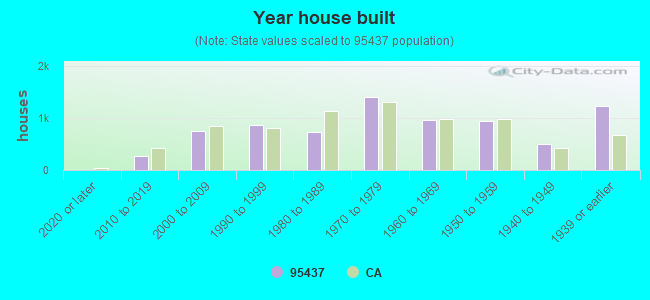


 According to the data from the years 2005 - 2018 the average number of fire incidents per year is 42. The highest number of reported fire incidents - 93 took place in 2007, and the least - 19 in 2012. The data has a dropping trend.
 When looking into fire subcategories, the most reports belonged to: Outside Fires (47.8%), and Structure Fires (36.6%).