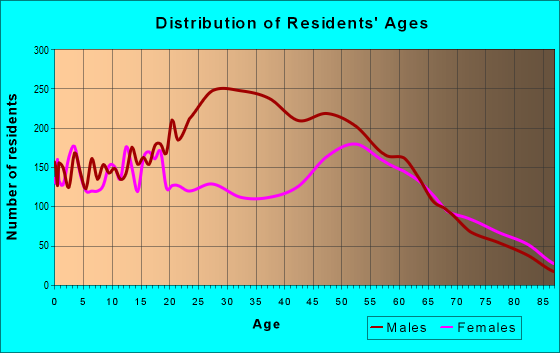
Estimated zip code population in 2022: 22,837 Zip code population in 2010: 24,528 Zip code population in 2000: 23,785
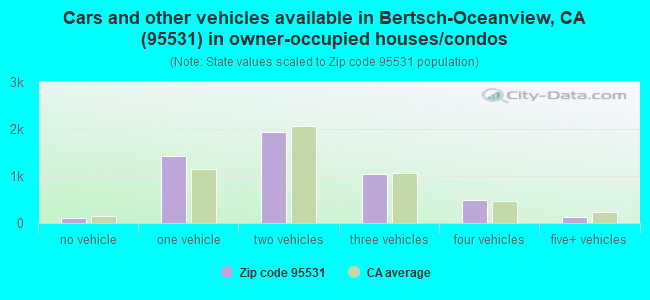
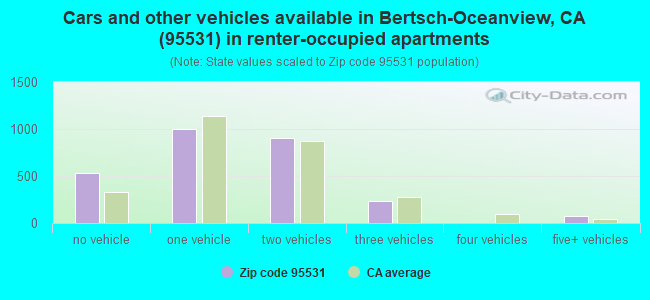
Houses and condos: 8,890 Renter-occupied apartments: 2,762
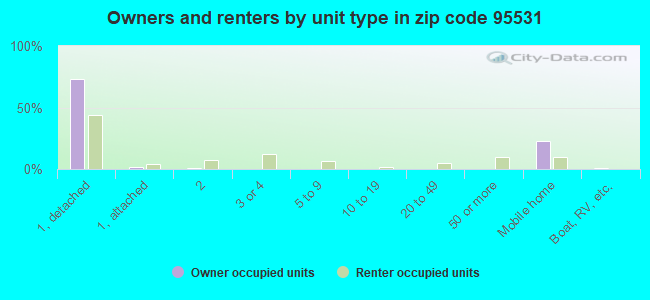
% of renters here:
35%
State:
44%
March 2022 cost of living index in zip code 95531: 91.7 (less than average, U.S. average is 100)
Land area: 195.2 sq. mi. Water area: 29.7 sq. mi.
Population density: 117 people per square mile
(very low).
OSM Map
General Map
Google Map
MSN Map
OSM Map
General Map
Google Map
MSN Map
OSM Map
General Map
Google Map
MSN Map
OSM Map
General Map
Google Map
MSN Map
Please wait while loading the map...
Real estate property taxes paid for housing units in 2022:
This zip code:
0.6% ($1,970)
California:
0.7% ($4,831)
Median real estate property taxes paid for housing units with mortgages in 2022: $2,258 (0.6%) Median real estate property taxes paid for housing units with no mortgage in 2022: $1,549 (0.6%)
Averages for the 2020 tax year for zip code 95531, filed in 2021:
Average Adjusted Gross Income (AGI) in 2020: $52,928 (Individual Income Tax Returns)
Here:
$52,928
State:
$95,910
Salary/wage: $46,176 (reported on 72.4% of returns)
Here:
$46,176
State:
$77,331
(% of AGI for various income ranges: 1169.3% for AGIs below $25k, 3612.0% for AGIs $25k-50k, 6404.4% for AGIs $50k-75k, 9891.7% for AGIs $75k-100k, 16670.9% for AGIs $100k-200k, 100373.3% for AGIs over 200k)
Taxable interest for individuals: $989 (reported on 34.4% of returns)
This zip code:
$989
California:
$2,294
(% of AGI for various income ranges: 21.0% for AGIs below $25k, 21.1% for AGIs $25k-50k, 62.8% for AGIs $50k-75k, 103.7% for AGIs $75k-100k, 133.3% for AGIs $100k-200k, 1933.3% for AGIs over 200k)
Ordinary dividends: $4,041 (reported on 12.2% of returns)
Here:
$4,041
State:
$10,949
(% of AGI for various income ranges: 21.2% for AGIs below $25k, 26.0% for AGIs $25k-50k, 99.9% for AGIs $50k-75k, 102.0% for AGIs $75k-100k, 225.2% for AGIs $100k-200k, 3650.0% for AGIs over 200k)
Net capital gain/loss in AGI: +$17,507 (reported on 12.3% of returns)
Here:
+$17,507
State:
+$49,306
(% of AGI for various income ranges: 6.1% for AGIs below $25k, 37.7% for AGIs $25k-50k, 143.1% for AGIs $50k-75k, 187.6% for AGIs $75k-100k, 638.9% for AGIs $100k-200k, 44533.3% for AGIs over 200k)
Profit/loss from business: +$17,199 (reported on 13.2% of returns)
Here:
+$17,199
State:
+$15,671
(% of AGI for various income ranges: 94.2% for AGIs below $25k, 212.4% for AGIs $25k-50k, 317.5% for AGIs $50k-75k, 544.3% for AGIs $75k-100k, 761.9% for AGIs $100k-200k, 19336.7% for AGIs over 200k)
Taxable individual retirement arrangement distribution: $15,326 (reported on 6.3% of returns)
95531:
$15,326
California:
$23,505
(% of AGI for various income ranges: 44.9% for AGIs below $25k, 52.6% for AGIs $25k-50k, 146.9% for AGIs $50k-75k, 299.8% for AGIs $75k-100k, 632.6% for AGIs $100k-200k, 2970.0% for AGIs over 200k)
Self-employed (Keogh) retirement plans: $24,500 (reported on 0.4% of returns)
95531:
$24,500
California:
$30,163
(% of AGI for various income ranges: 181.5% for AGIs $100k-200k)
Total itemized deductions: $28,596 (reported on 5.7% of returns)
Here:
$28,596
State:
$39,517
(% of AGI for various income ranges: 37.9% for AGIs below $25k, 92.7% for AGIs $25k-50k, 265.1% for AGIs $50k-75k, 562.0% for AGIs $75k-100k, 889.8% for AGIs $100k-200k, 9786.7% for AGIs over 200k)
Charity contributions: $7,827 (reported on 4.1% of returns)
Here:
$7,827
State:
$12,598
(% of AGI for various income ranges: 3.0% for AGIs below $25k, 7.8% for AGIs $25k-50k, 39.4% for AGIs $50k-75k, 70.7% for AGIs $75k-100k, 172.4% for AGIs $100k-200k, 3746.7% for AGIs over 200k)
Taxes paid: $6,845 (reported on 5.6% of returns)
95531:
$6,845
State:
$8,807
(% of AGI for various income ranges: 5.3% for AGIs below $25k, 15.8% for AGIs $25k-50k, 61.2% for AGIs $50k-75k, 152.8% for AGIs $75k-100k, 261.1% for AGIs $100k-200k, 1663.3% for AGIs over 200k)
Earned income credit: $2,197 (reported on 19.9% of returns)
Here:
$2,197
State:
$2,074
(% of AGI for various income ranges: 111.4% for AGIs below $25k, 92.2% for AGIs $25k-50k, 2.1% for AGIs $50k-75k)
Percentage of individuals using paid preparers for their 2020 taxes: 90.0%
Here:
90%
State:
92%
(% for various income ranges: 84.3% for AGIs below $25k, 93.6% for AGIs $25k-50k, 93.8% for AGIs $50k-75k, 92.7% for AGIs $75k-100k, 93.2% for AGIs $100k-200k, 94.4% for AGIs over 200k)
Averages for the 2012 tax year for zip code 95531, filed in 2013:
Average Adjusted Gross Income (AGI) in 2012: $45,389 (Individual Income Tax Returns)
Here:
$45,389
State:
$72,726
Salary/wage: $38,551 (reported on 79.3% of returns)
Here:
$38,551
State:
$59,079
(% of AGI for various income ranges: 71.5% for AGIs below $25k, 71.2% for AGIs $25k-50k, 69.1% for AGIs $50k-75k, 69.5% for AGIs $75k-100k, 70.7% for AGIs $100k-200k, 40.6% for AGIs over 200k)
Taxable interest for individuals: $1,055 (reported on 33.9% of returns)
This zip code:
$1,055
California:
$2,146
(% of AGI for various income ranges: 1.2% for AGIs below $25k, 0.9% for AGIs $25k-50k, 0.8% for AGIs $50k-75k, 0.6% for AGIs $75k-100k, 0.6% for AGIs $100k-200k, 1.0% for AGIs over 200k)
Ordinary dividends: $3,143 (reported on 14.6% of returns)
Here:
$3,143
State:
$9,308
(% of AGI for various income ranges: 1.1% for AGIs below $25k, 1.0% for AGIs $25k-50k, 0.8% for AGIs $50k-75k, 1.0% for AGIs $75k-100k, 0.8% for AGIs $100k-200k, 1.7% for AGIs over 200k)
Net capital gain/loss in AGI: +$3,167 (reported on 11.3% of returns)
Here:
+$3,167
State:
+$30,460
(% of AGI for various income ranges: 0.3% for AGIs $50k-75k, 0.5% for AGIs $75k-100k, 0.9% for AGIs $100k-200k, 4.2% for AGIs over 200k)
Profit/loss from business: +$16,765 (reported on 15.1% of returns)
Here:
+$16,765
State:
+$17,064
(% of AGI for various income ranges: 6.8% for AGIs below $25k, 5.2% for AGIs $25k-50k, 3.9% for AGIs $50k-75k, 4.1% for AGIs $75k-100k, 5.2% for AGIs $100k-200k, 11.2% for AGIs over 200k)
Taxable individual retirement arrangement distribution: $11,789 (reported on 8.4% of returns)
95531:
$11,789
California:
$19,557
(% of AGI for various income ranges: 2.5% for AGIs below $25k, 2.1% for AGIs $25k-50k, 2.2% for AGIs $50k-75k, 2.6% for AGIs $75k-100k, 2.7% for AGIs $100k-200k)
Self-employment retirement plans: $18,533 (reported on 0.8% of returns)
95531:
$18,533
California:
$24,530
Total itemized deductions: $20,891 (24% of AGI, reported on 27.0% of returns)
Here:
$20,891
State:
$34,004
Here:
23.9% of AGI
State:
22.7% of AGI
(% of AGI for various income ranges: 8.4% for AGIs below $25k, 9.7% for AGIs $25k-50k, 12.3% for AGIs $50k-75k, 14.8% for AGIs $75k-100k, 14.9% for AGIs $100k-200k, 12.8% for AGIs over 200k)
Charity contributions: $3,044 (reported on 19.2% of returns)
Here:
$3,044
State:
$4,659
(% of AGI for various income ranges: 0.5% for AGIs below $25k, 0.8% for AGIs $25k-50k, 1.0% for AGIs $50k-75k, 1.5% for AGIs $75k-100k, 1.9% for AGIs $100k-200k, 1.9% for AGIs over 200k)
Taxes paid: $6,796 (reported on 26.8% of returns)
95531:
$6,796
State:
$14,448
(% of AGI for various income ranges: 1.5% for AGIs below $25k, 2.0% for AGIs $25k-50k, 3.2% for AGIs $50k-75k, 4.5% for AGIs $75k-100k, 5.7% for AGIs $100k-200k, 7.8% for AGIs over 200k)
Earned income credit: $2,184 (reported on 24.8% of returns)
Here:
$2,184
State:
$2,286
(% of AGI for various income ranges: 7.7% for AGIs below $25k, 1.4% for AGIs $25k-50k)
Percentage of individuals using paid preparers for their 2012 taxes: 53.4%
Here:
53%
State:
64%
(% for various income ranges: 48.0% for AGIs below $25k, 51.4% for AGIs $25k-50k, 59.8% for AGIs $50k-75k, 61.5% for AGIs $75k-100k, 63.5% for AGIs $100k-200k, 88.9% for AGIs over 200k)
Averages for the 2004 tax year for zip code 95531, filed in 2005:
Average Adjusted Gross Income (AGI) in 2004: $37,826 (Individual Income Tax Returns)
Here:
$37,826
State:
$58,600
Salary/wage: $32,719 (reported on 80.4% of returns)
Here:
$32,719
State:
$49,455
(% of AGI for various income ranges: 145.6% for AGIs below $10k, 71.5% for AGIs $10k-25k, 74.2% for AGIs $25k-50k, 77.9% for AGIs $50k-75k, 75.9% for AGIs $75k-100k, 48.1% for AGIs over 100k)
Taxable interest for individuals: $1,648 (reported on 42.1% of returns)
This zip code:
$1,648
California:
$2,365
(% of AGI for various income ranges: 8.5% for AGIs below $10k, 2.5% for AGIs $10k-25k, 1.5% for AGIs $25k-50k, 1.2% for AGIs $50k-75k, 1.6% for AGIs $75k-100k, 2.0% for AGIs over 100k)
Taxable dividends: $2,096 (reported on 18.2% of returns)
Here:
$2,096
State:
$4,746
(% of AGI for various income ranges: 4.8% for AGIs below $10k, 1.8% for AGIs $10k-25k, 1.0% for AGIs $25k-50k, 0.6% for AGIs $50k-75k, 0.7% for AGIs $75k-100k, 1.0% for AGIs over 100k)
Net capital gain/loss: +$15,832 (reported on 16.2% of returns)
Here:
+$15,832
State:
+$23,418
(% of AGI for various income ranges: -0.8% for AGIs below $10k, 0.9% for AGIs $10k-25k, 1.5% for AGIs $25k-50k, 1.1% for AGIs $50k-75k, 2.8% for AGIs $75k-100k, 22.3% for AGIs over 100k)
Profit/loss from business: +$14,919 (reported on 15.8% of returns)
Here:
+$14,919
State:
+$16,826
(% of AGI for various income ranges: 5.4% for AGIs below $10k, 5.0% for AGIs $10k-25k, 4.6% for AGIs $25k-50k, 4.7% for AGIs $50k-75k, 4.1% for AGIs $75k-100k, 11.0% for AGIs over 100k)
IRA payment deduction: $3,257 (reported on 2.3% of returns)
95531:
$3,257
California:
$3,192
(% of AGI for various income ranges: 0.3% for AGIs $10k-25k, 0.3% for AGIs $25k-50k, 0.2% for AGIs $50k-75k, 0.2% for AGIs $75k-100k, 0.1% for AGIs over 100k)
Self-employed pension: $16,455 (reported on 1.1% of returns)
Here:
$16,455
California:
$17,688
Total itemized deductions: $17,216 (24% of AGI, reported on 29.0% of returns)
Here:
$17,216
State:
$28,113
Here:
23.8% of AGI
State:
25.3% of AGI
(% of AGI for various income ranges: 17.6% for AGIs below $10k, 8.8% for AGIs $10k-25k, 11.5% for AGIs $25k-50k, 14.7% for AGIs $50k-75k, 15.6% for AGIs $75k-100k, 13.7% for AGIs over 100k)
Charity contributions deductions: $2,710 (4% of AGI, reported on 24.0% of returns)
Here:
$2,710
State:
$3,923
Here:
3.6% of AGI
State:
3.3% of AGI
(% of AGI for various income ranges: 0.8% for AGIs below $10k, 0.7% for AGIs $10k-25k, 1.3% for AGIs $25k-50k, 2.0% for AGIs $50k-75k, 2.3% for AGIs $75k-100k, 2.0% for AGIs over 100k)
Total tax: $5,253 (reported on 70.9% of returns)
95531:
$5,253
State:
$10,761
(% of AGI for various income ranges: 4.3% for AGIs below $10k, 3.8% for AGIs $10k-25k, 6.5% for AGIs $25k-50k, 8.8% for AGIs $50k-75k, 10.3% for AGIs $75k-100k, 16.7% for AGIs over 100k)
Earned income credit: $1,682 (reported on 19.2% of returns)
Here:
$1,682
State:
$1,763
Percentage of individuals using paid preparers for their 2004 taxes: 57.7%
Here:
58%
State:
66%
(% for various income ranges: 48.5% for AGIs below $10k, 55.1% for AGIs $10k-25k, 56.4% for AGIs $25k-50k, 65.1% for AGIs $50k-75k, 67.9% for AGIs $75k-100k, 81.2% for AGIs over 100k)
Likely homosexual households (counted as self-reported same-sex unmarried-partner households)
Lesbian couples: 0.0% of all households
Gay men: 0.2% of all households
Household received Food Stamps/SNAP in the past 12 months: 1,941 Household did not receive Food Stamps/SNAP in the past 12 months: 6,136
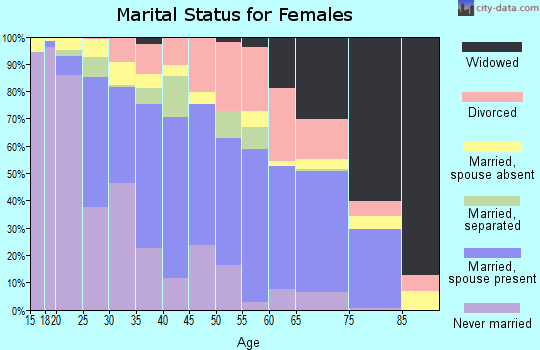
Women who had a birth in the past 12 months: 131 (87 now married, 44 unmarried) Women who did not have a birth in the past 12 months: 4,106 (1,873 now married, 2,222 unmarried)
Housing units in zip code 95531 with a mortgage: 2,361 (216 second mortgage, 165 both second mortgage and home equity loan) Houses without a mortgage: 73
Median monthly owner costs for units with a mortgage: $1,516 Median monthly owner costs for units without a mortgage: $540
Residents with income below the poverty level in 2022:
This zip code:
13.8%
Whole state:
12.2%
Residents with income below 50% of the poverty level in 2022:
This zip code:
6.5%
Whole state:
6.2%
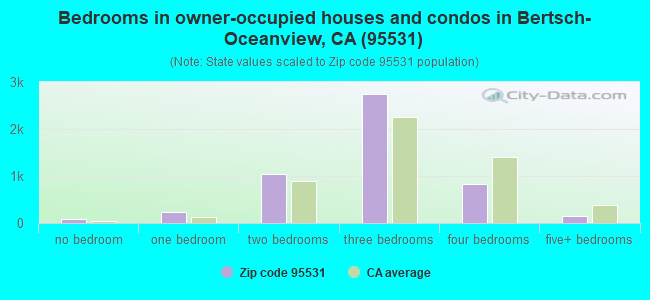
Median number of rooms in houses and condos:
Here:
5.9
State:
6.0
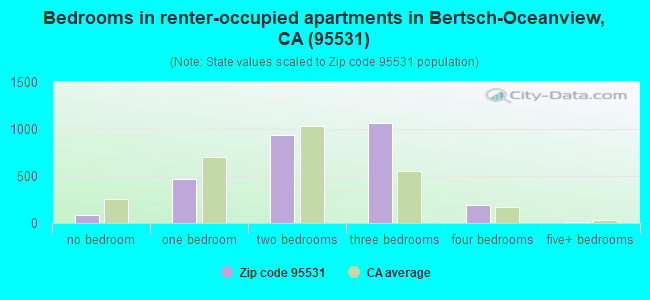
Median number of rooms in apartments:
Here:
4.6
State:
3.9
Notable locations in this zip code not listed on our city pages
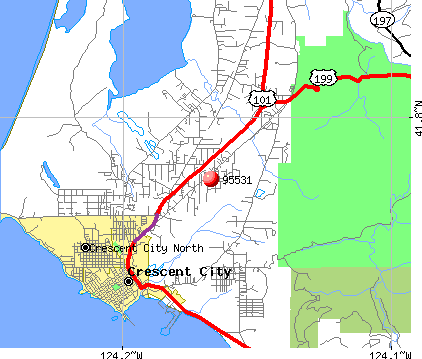
Notable locations in zip code 95531: Stevens Ranch (A), Citizens Dock (B), Del Norte Golf Course (C), Saint George Reef Lighthouse (D), Red's Crescent Drive-In (E), Wilson Ranch (F), McLaughlin Ranch (G), Hiouchi Information Center (H), Alma Ranch (I), Big Flat Forest Service Station (J), Upper Coon Mountain Shelter (K), Ferguson-King Ranch (L), Knapp Estate (M), Ship Mountain Lookout (N), Big Flat Campground (O), Jedediah Smith Campground (P), Melson Ranch (Q), Pebble Beach Public Fishing Access (R), Rock Creek Camp (S), Del Norte County Historical Society Museum (T). Display/hide their locations on the map
Churches in zip code 95531 include: Saint Pauls Episcopal Church (A), Saint Joseph Catholic Church (B), New Life Church of God (C), Lighthouse Fellowship Church (D), Foursquare Gospel Church (E), Fort Dick Bible Church (F), First Baptist Church (G), Crescent City United Methodist Church (H), Church of the Nazarene (I). Display/hide their locations on the map
Streams, rivers, and creeks: Deer Creek (A), Elk Creek (B), Hutsinpillar Creek (C), Muzzleloader Creek (D), Sultan Creek (E), Marhoffer Creek (F), Coon Creek (G), Sheep Pen Creek (H), Peacock Creek (I). Display/hide their locations on the map
Parks in zip code 95531 include: Tolowa Dunes State Park (1), S S Emido Memorial (2), Jedediah Smith Redwoods State Park (3), Redwood National Park (4), Del Norte County Fairgrounds (5), Beach Front Park (6), Brother Jonathan Park (7), Castle Rock National Wildlife Refuge (8). Display/hide their locations on the map
2,404 married couples with children.
1,506 single-parent households (467 men, 1,039 women).
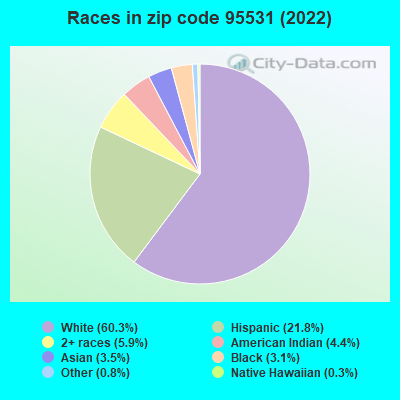
85.9% of residents of 95531 zip code speak English at home.
9.3% of residents speak Spanish at home (59% very well, 27% well, 11% not well, 3% not at all).
1.3% of residents speak other Indo-European language at home (65% very well, 24% well, 10% not well).
2.8% of residents speak Asian or Pacific Island language at home (46% very well, 43% well, 10% not well, 1% not at all).
0.2% of residents speak other language at home (100% very well).
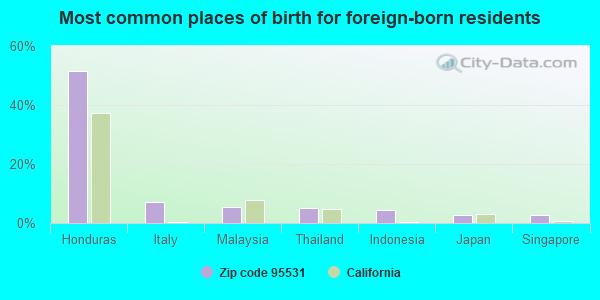
Foreign born population: 1,884 (8.2%) (50.8% of them are naturalized citizens)
This zip code:
8.2%
Whole state:
26.7%
51%Honduras
7%Italy
5%Malaysia
5%Thailand
4%Indonesia
3%Japan
3%Singapore
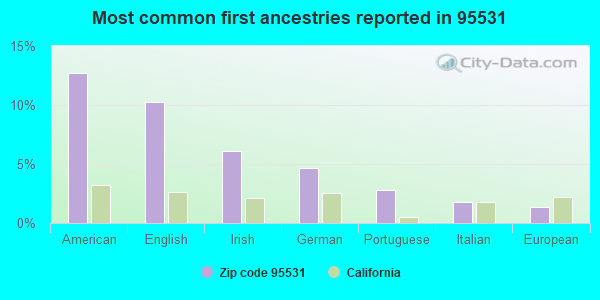
13%American
10%English
6%Irish
5%German
3%Portuguese
2%Italian
1%European
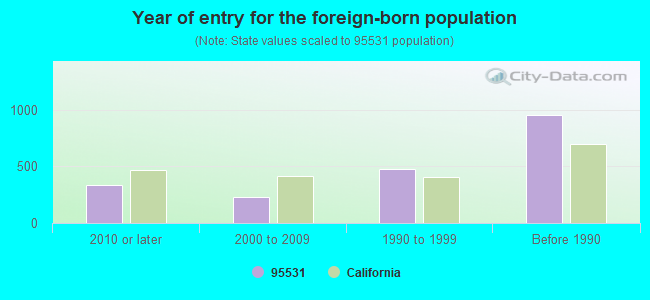
Year of entry for the foreign-born population
3312010 or later
2252000 to 2009
4731990 to 1999
952Before 1990
Facilities with environmental interests located in this zip code:
101 LAUNDRY DRY CLEANING (503 L ST in CRESCENT CITY, CA)
STATE MASTER (California - Hazardous Waste Tracking) - HAZARDOU WASTE PROGRAM Small Quantity Generators, between 100 kg and 1000 kg of hazardous waste/month (Resource Conservation and Recovery Act (tracking hazardous waste)) - notification Organizations: KEITH LINVILLE (CONTACT/OWNER)
A 1 AUTO WRECKERS (1100 MCNAMARA RD in CRESCENT CITY, CA)
STATE MASTER (California - Hazardous Waste Tracking) - HAZARDOU WASTE PROGRAM Small Quantity Generators, between 100 kg and 1000 kg of hazardous waste/month (Resource Conservation and Recovery Act (tracking hazardous waste)) - notification Organizations: BRUCE GATES (CONTACT/OWNER)
CAL TRANS CRESCENT CITY MS (HWY 101 AT NORTHCREST DR in CRESCENT CITY, CA)
STATE MASTER (California - Hazardous Waste Tracking) - HAZARDOU WASTE PROGRAM Small Quantity Generators, between 100 kg and 1000 kg of hazardous waste/month (Resource Conservation and Recovery Act (tracking hazardous waste)) Alternative names: CALTRANS DISTRICT 1
ALTERNATIVE/OPPORTUNITY (212 E. WASHINGTON BLVD. in CRESCENT CITY, CA)
(National Center for Education Statistics) - STATE ID-0830018 Organizations: DEL NORTE CO. OFFICE OF EDUCATION (SCHOOL DISTRICT)
GREENERGY INCORPORATED (125 WHEELER LANE in CRESCENT CITY, CA)
(Integrated Compliance Information System) - ICIS-10-2002-0030, FORMAL ENFORCEMENT ACTION COMPLIANCE ACTIVITY (Tracking inspections of insecticide, fungicide, and rodenticide, and toxic substances) Alternative names: GREENERY INC.
JOE HAMILTON ELEMENTARY (1050 E ST. in CRESCENT CITY, CA)
(National Center for Education Statistics) - STATE ID-6005391 Organizations: DEL NORTE COUNTY UNIFIED (SCHOOL DISTRICT)
MCCARTHY CENTER/COMMUNITY (1115 WILLIAMS DR. in CRESCENT CITY, CA)
(National Center for Education Statistics) - STATE ID-0830042 Organizations: DEL NORTE CO. OFFICE OF EDUCATION (SCHOOL DISTRICT)
CASTLE ROCK CHARTER (212 E. WASHINGTON BLVD in CRESCENT CITY, CA)
(National Center for Education Statistics) - STATE ID-0830059 Organizations: DEL NORTE CO. OFFICE OF EDUCATION (SCHOOL DISTRICT)
CC HARBOR SEAFOOD WW SYSTEM (CRESCENT CITY HARBOR in CRESCENT CITY, CA)
National Pollutant Discharge Elimination System NON-MAJOR (Tracking pollutant discharge elimination systems) - permit Business SIC classification: CANNED AND CURED FISH AND SEAFOODS Organizations: CRESCENT CITY HARBOR DISTRICT (CONTACT/OWNER)
Alternative names: CRESCENT CITY HARBOR DISTRICT, CRESCENT CITY SEAFOOD-WW SYST
HAMBRO FOREST PRODUCTS INCORPORATED (445 ELK VALLEY RD. in CRESCENT CITY, CA)
COMPLIANCE ACTIVITY (Tracking inspections of insecticide, fungicide, and rodenticide, and toxic substances) CRITERIA AND HAZARDOUS AIR POLLUTANT INVENTORY (Inventory of air pollution sources) TRI REPORTER (Tracking of toxic chemicals releasing facilities) Business SIC classification: RECONSTITUTED WOOD PRODUCTS
L&M TRANSPORTATION (109 CLUB DR in CRESCENT CITY, CA)
TRANSPORTER (Resource Conservation and Recovery Act (tracking hazardous waste)) Organizations: LESTER A MANOSAR (CONTACT/OWNER)
HAMBRO FOREST PRODUCTS (1575 VALLEY RD in CRESCENT CITY, CA)
AIR MAJOR (AIRS/AFS)
MCNAMARA & PEEPE SAWMILL (1607 5TH STREET in CRESCENT CITY, CA)
SUPERFUND (Superfund database) Alternative names: MCNAMARA & PEOPLE
Housing units lacking complete plumbing facilities: 3.3% Housing units lacking complete kitchen facilities: 2.5%
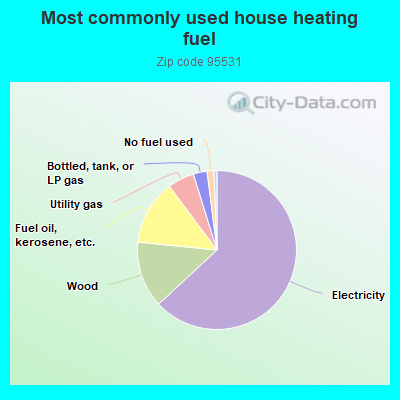
63.1%Electricity
13.5%Wood
13.2%Fuel oil, kerosene, etc.
5.4%Utility gas
2.8%Bottled, tank, or LP gas
1.4%No fuel used
Population in 1990: 19,400. Population change in the 1990s: +4,385 (+22.6%).
Place of birth for U.S.-born residents:
This state: 16,177
Northeast: 559
Midwest: 912
South: 1,017
West: 2,074
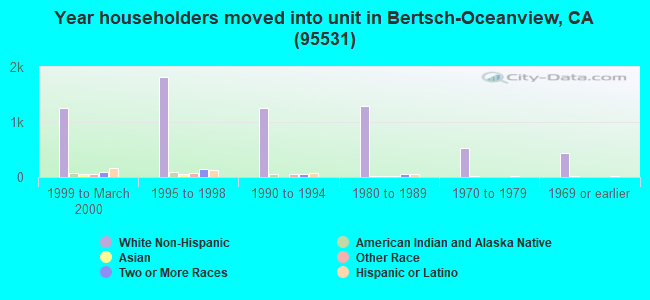
44% of the 95531 zip code residents lived in the same house 5 years ago. Out of people who lived in different houses, 39% lived in this county. Out of people who lived in different counties, 50% lived in California.
90% of the 95531 zip code residents lived in the same house 1 year ago. Out of people who lived in different houses, 32% moved from this county. Out of people who lived in different houses, 54% moved from different county within same state. Out of people who lived in different houses, 16% moved from different state.
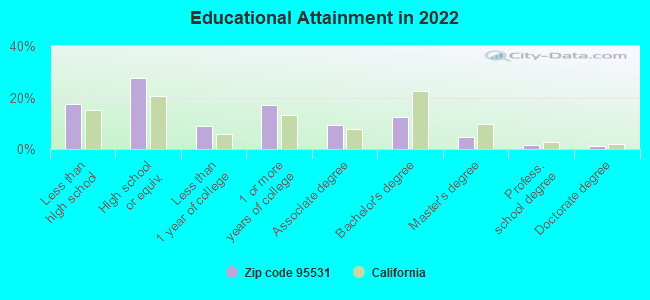
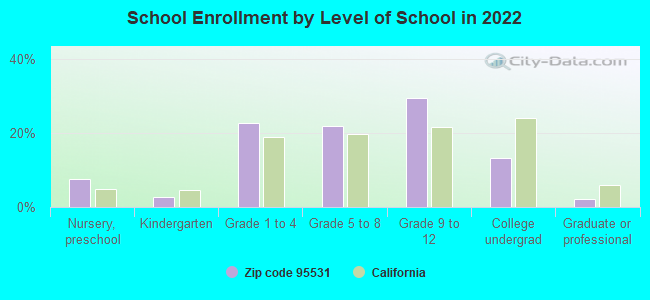
Private vs. public school enrollment:
Students in private schools in grades 1 to 8 (elementary and middle school): 367
Here:
15.3%
California:
10.5%
Students in private schools in grades 9 to 12 (high school): 199
Here:
12.6%
California:
8.5%
Students in private undergraduate colleges: 106
Here:
15.2%
California:
15.9%
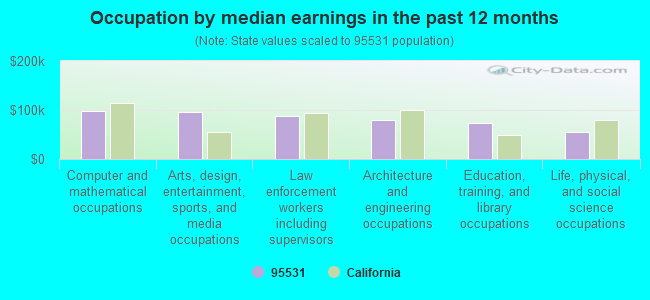
Occupation by median earnings in the past 12 months ($)
98,010Computer and mathematical occupations
96,716Arts, design, entertainment, sports, and media occupations
88,457Law enforcement workers including supervisors
79,565Architecture and engineering occupations
73,290Education, training, and library occupations
55,886Life, physical, and social science occupations
Companies with federal contracts located in this zip code:
JACK TUNNELL (115 E HOOVER ST in CRESCENT CITY, CA; small business) : -$4,910 in 4 contractsin 2004
$0 with Army for Other Housekeeping Services. Signed on 2004-03-23. Completion date: 2003-07-31.
$0 with U.S. Army Corps of Engineers - civil program financing only for Other Housekeeping Services. Signed on 2004-03-23. Completion date: 2003-07-31.
-$2,455 with Army for Other Housekeeping Services. Signed on 2004-03-23. Completion date: 2003-07-31.
-$2,455 with U.S. Army Corps of Engineers - civil program financing only for Other Housekeeping Services. Signed on 2004-03-23. Completion date: 2003-07-31.
Top industries in this zip code by the number of employees in 2005:
Health Care and Social Assistance: General Medical and Surgical Hospitals (250-499 employees: 1 establishment)
Accommodation and Food Services: Hotels (except Casino Hotels) and Motels (20-49: 2, 10-19: 2, 5-9: 4, 1-4: 8)
People in group quarters in 2010:
3,367 people in state prisons
99 people in local jails and other municipal confinement facilities
91 people in other noninstitutional facilities
76 people in nursing facilities/skilled-nursing facilities
21 people in residential treatment centers for adults
12 people in group homes intended for adults
10 people in correctional facilities intended for juveniles
People in group quarters in 2000:
3,341 people in state prisons
113 people in local jails and other confinement facilities (including police lockups)
83 people in nursing homes
63 people in other noninstitutional group quarters
10 people in unknown juvenile institutions
3 people in other nonhousehold living situations
2 people in homes or halfway houses for drug/alcohol abuse
Fatal accident statistics in 2014:
Fatal accident count: 4
Vehicles involved in fatal accidents: 8
Fatal accidents caused by drunken drivers: 1
Fatalities: 4
Persons involved in fatal accidents: 12
Pedestrians involved in fatal accidents: 1
Fatal accident statistics in 2013:
Fatal accident count: 5
Vehicles involved in fatal accidents: 6
Fatal accidents caused by drunken drivers: 2
Fatalities: 7
Persons involved in fatal accidents: 9
Pedestrians involved in fatal accidents: 0
2002 - 2018 National Fire Incident Reporting System (NFIRS) incidents
Based on the data from the years 2002 - 2018 the average number of fires per year is 82. The highest number of reported fires - 273 took place in 2017, and the least - 0 in 2003. The data has an increasing trend.
When looking into fire subcategories, the most reports belonged to: Outside Fires (66.9%), and Structure Fires (20.2%).
Fire incident types reported to NFIRS in Zip Code 95531
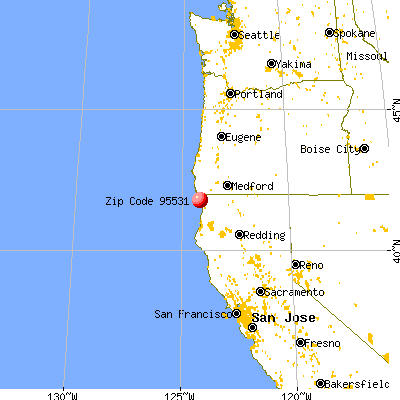


 Nearest zip codes: 95567, 95543, 95548, 97415, 97534, 97531.
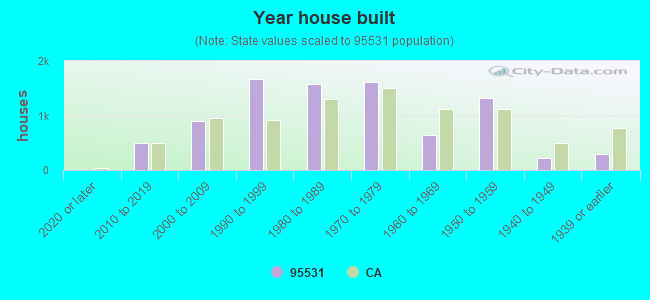


 Based on the data from the years 2002 - 2018 the average number of fires per year is 82. The highest number of reported fires - 273 took place in 2017, and the least - 0 in 2003. The data has an increasing trend.
 When looking into fire subcategories, the most reports belonged to: Outside Fires (66.9%), and Structure Fires (20.2%).