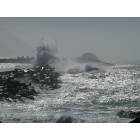
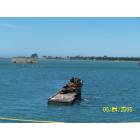
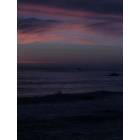
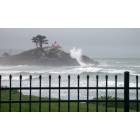
Crescent City, California Submit your own pictures of this city and show them to the world
OSM Map
General Map
Google Map
MSN Map
OSM Map
General Map
Google Map
MSN Map
OSM Map
General Map
Google Map
MSN Map
OSM Map
General Map
Google Map
MSN Map
Please wait while loading the map...
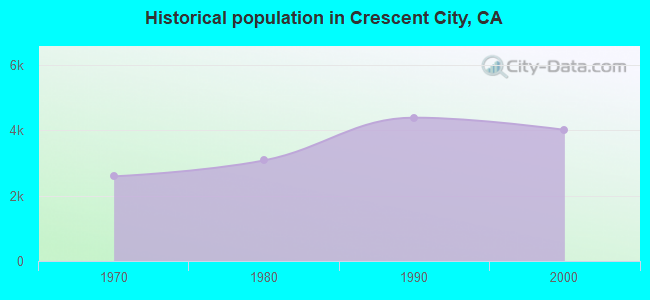
Population in 2022: 5,983 (100% urban, 0% rural). Population change since 2000: +49.4%Males: 3,798 Females: 2,185
March 2022 cost of living index in Crescent City: 97.4 (near average, U.S. average is 100) Percentage of residents living in poverty in 2022: 22.7%for White Non-Hispanic residents , 39.3% for Hispanic or Latino residents , 24.0% for American Indian residents , 68.5% for other race residents , 17.6% for two or more races residents )
Profiles of local businesses
Business Search - 14 Million verified businesses
Data:
Median household income ($)
Median household income (% change since 2000)
Household income diversity
Ratio of average income to average house value (%)
Ratio of average income to average rent
Median household income ($) - White
Median household income ($) - Black or African American
Median household income ($) - Asian
Median household income ($) - Hispanic or Latino
Median household income ($) - American Indian and Alaska Native
Median household income ($) - Multirace
Median household income ($) - Other Race
Median household income for houses/condos with a mortgage ($)
Median household income for apartments without a mortgage ($)
Races - White alone (%)
Races - White alone (% change since 2000)
Races - Black alone (%)
Races - Black alone (% change since 2000)
Races - American Indian alone (%)
Races - American Indian alone (% change since 2000)
Races - Asian alone (%)
Races - Asian alone (% change since 2000)
Races - Hispanic (%)
Races - Hispanic (% change since 2000)
Races - Native Hawaiian and Other Pacific Islander alone (%)
Races - Native Hawaiian and Other Pacific Islander alone (% change since 2000)
Races - Two or more races (%)
Races - Two or more races (% change since 2000)
Races - Other race alone (%)
Races - Other race alone (% change since 2000)
Racial diversity
Unemployment (%)
Unemployment (% change since 2000)
Unemployment (%) - White
Unemployment (%) - Black or African American
Unemployment (%) - Asian
Unemployment (%) - Hispanic or Latino
Unemployment (%) - American Indian and Alaska Native
Unemployment (%) - Multirace
Unemployment (%) - Other Race
Population density (people per square mile)
Population - Males (%)
Population - Females (%)
Population - Males (%) - White
Population - Males (%) - Black or African American
Population - Males (%) - Asian
Population - Males (%) - Hispanic or Latino
Population - Males (%) - American Indian and Alaska Native
Population - Males (%) - Multirace
Population - Males (%) - Other Race
Population - Females (%) - White
Population - Females (%) - Black or African American
Population - Females (%) - Asian
Population - Females (%) - Hispanic or Latino
Population - Females (%) - American Indian and Alaska Native
Population - Females (%) - Multirace
Population - Females (%) - Other Race
Coronavirus confirmed cases (Apr 27, 2024)
Deaths caused by coronavirus (Apr 27, 2024)
Coronavirus confirmed cases (per 100k population) (Apr 27, 2024)
Deaths caused by coronavirus (per 100k population) (Apr 27, 2024)
Daily increase in number of cases (Apr 27, 2024)
Weekly increase in number of cases (Apr 27, 2024)
Cases doubled (in days) (Apr 27, 2024)
Hospitalized patients (Apr 18, 2022)
Negative test results (Apr 18, 2022)
Total test results (Apr 18, 2022)
COVID Vaccine doses distributed (per 100k population) (Sep 19, 2023)
COVID Vaccine doses administered (per 100k population) (Sep 19, 2023)
COVID Vaccine doses distributed (Sep 19, 2023)
COVID Vaccine doses administered (Sep 19, 2023)
Likely homosexual households (%)
Likely homosexual households (% change since 2000)
Likely homosexual households - Lesbian couples (%)
Likely homosexual households - Lesbian couples (% change since 2000)
Likely homosexual households - Gay men (%)
Likely homosexual households - Gay men (% change since 2000)
Cost of living index
Median gross rent ($)
Median contract rent ($)
Median monthly housing costs ($)
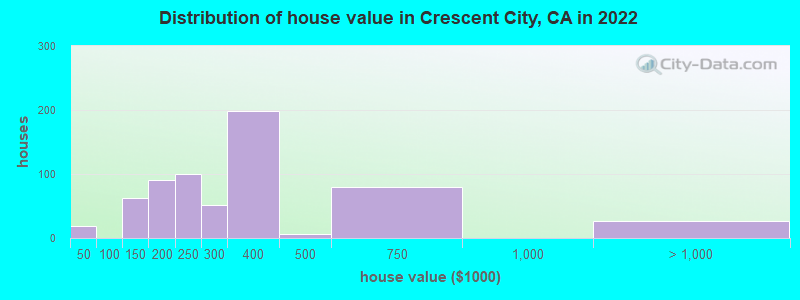
Median house or condo value ($)
Median house or condo value ($ change since 2000)
Mean house or condo value by units in structure - 1, detached ($)
Mean house or condo value by units in structure - 1, attached ($)
Mean house or condo value by units in structure - 2 ($)
Mean house or condo value by units in structure by units in structure - 3 or 4 ($)
Mean house or condo value by units in structure - 5 or more ($)
Mean house or condo value by units in structure - Boat, RV, van, etc. ($)
Mean house or condo value by units in structure - Mobile home ($)
Median house or condo value ($) - White
Median house or condo value ($) - Black or African American
Median house or condo value ($) - Asian
Median house or condo value ($) - Hispanic or Latino
Median house or condo value ($) - American Indian and Alaska Native
Median house or condo value ($) - Multirace
Median house or condo value ($) - Other Race
Median resident age
Resident age diversity
Median resident age - Males
Median resident age - Females
Median resident age - White
Median resident age - Black or African American
Median resident age - Asian
Median resident age - Hispanic or Latino
Median resident age - American Indian and Alaska Native
Median resident age - Multirace
Median resident age - Other Race
Median resident age - Males - White
Median resident age - Males - Black or African American
Median resident age - Males - Asian
Median resident age - Males - Hispanic or Latino
Median resident age - Males - American Indian and Alaska Native
Median resident age - Males - Multirace
Median resident age - Males - Other Race
Median resident age - Females - White
Median resident age - Females - Black or African American
Median resident age - Females - Asian
Median resident age - Females - Hispanic or Latino
Median resident age - Females - American Indian and Alaska Native
Median resident age - Females - Multirace
Median resident age - Females - Other Race
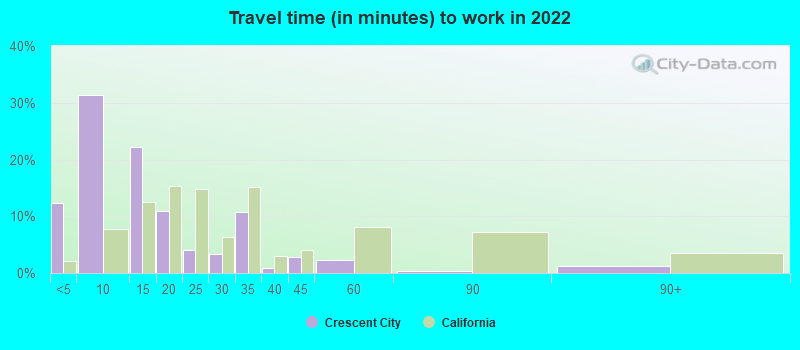
Commute - mean travel time to work (minutes)
Travel time to work - Less than 5 minutes (%)
Travel time to work - Less than 5 minutes (% change since 2000)
Travel time to work - 5 to 9 minutes (%)
Travel time to work - 5 to 9 minutes (% change since 2000)
Travel time to work - 10 to 19 minutes (%)
Travel time to work - 10 to 19 minutes (% change since 2000)
Travel time to work - 20 to 29 minutes (%)
Travel time to work - 20 to 29 minutes (% change since 2000)
Travel time to work - 30 to 39 minutes (%)
Travel time to work - 30 to 39 minutes (% change since 2000)
Travel time to work - 40 to 59 minutes (%)
Travel time to work - 40 to 59 minutes (% change since 2000)
Travel time to work - 60 to 89 minutes (%)
Travel time to work - 60 to 89 minutes (% change since 2000)
Travel time to work - 90 or more minutes (%)
Travel time to work - 90 or more minutes (% change since 2000)
Marital status - Never married (%)
Marital status - Now married (%)
Marital status - Separated (%)
Marital status - Widowed (%)
Marital status - Divorced (%)
Median family income ($)
Median family income (% change since 2000)
Median non-family income ($)
Median non-family income (% change since 2000)
Median per capita income ($)
Median per capita income (% change since 2000)
Median family income ($) - White
Median family income ($) - Black or African American
Median family income ($) - Asian
Median family income ($) - Hispanic or Latino
Median family income ($) - American Indian and Alaska Native
Median family income ($) - Multirace
Median family income ($) - Other Race
Median year house/condo built
Median year apartment built
Year house built - Built 2005 or later (%)
Year house built - Built 2000 to 2004 (%)
Year house built - Built 1990 to 1999 (%)
Year house built - Built 1980 to 1989 (%)
Year house built - Built 1970 to 1979 (%)
Year house built - Built 1960 to 1969 (%)
Year house built - Built 1950 to 1959 (%)
Year house built - Built 1940 to 1949 (%)
Year house built - Built 1939 or earlier (%)
Average household size
Household density (households per square mile)
Average household size - White
Average household size - Black or African American
Average household size - Asian
Average household size - Hispanic or Latino
Average household size - American Indian and Alaska Native
Average household size - Multirace
Average household size - Other Race
Occupied housing units (%)
Vacant housing units (%)
Owner occupied housing units (%)
Renter occupied housing units (%)
Vacancy status - For rent (%)
Vacancy status - For sale only (%)
Vacancy status - Rented or sold, not occupied (%)
Vacancy status - For seasonal, recreational, or occasional use (%)
Vacancy status - For migrant workers (%)
Vacancy status - Other vacant (%)
Residents with income below the poverty level (%)
Residents with income below 50% of the poverty level (%)
Children below poverty level (%)
Poor families by family type - Married-couple family (%)
Poor families by family type - Male, no wife present (%)
Poor families by family type - Female, no husband present (%)
Poverty status for native-born residents (%)
Poverty status for foreign-born residents (%)
Poverty among high school graduates not in families (%)
Poverty among people who did not graduate high school not in families (%)
Residents with income below the poverty level (%) - White
Residents with income below the poverty level (%) - Black or African American
Residents with income below the poverty level (%) - Asian
Residents with income below the poverty level (%) - Hispanic or Latino
Residents with income below the poverty level (%) - American Indian and Alaska Native
Residents with income below the poverty level (%) - Multirace
Residents with income below the poverty level (%) - Other Race
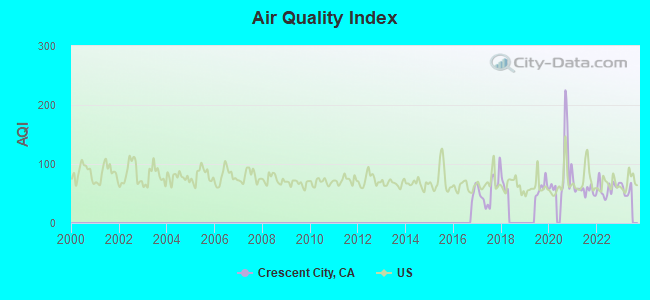
Air pollution - Air Quality Index (AQI)
Air pollution - CO
Air pollution - NO2
Air pollution - SO2
Air pollution - Ozone
Air pollution - PM10
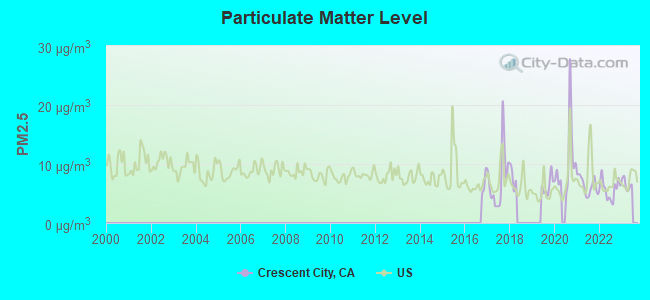
Air pollution - PM25
Air pollution - Pb
Crime - Murders per 100,000 population
Crime - Rapes per 100,000 population
Crime - Robberies per 100,000 population
Crime - Assaults per 100,000 population
Crime - Burglaries per 100,000 population
Crime - Thefts per 100,000 population
Crime - Auto thefts per 100,000 population
Crime - Arson per 100,000 population
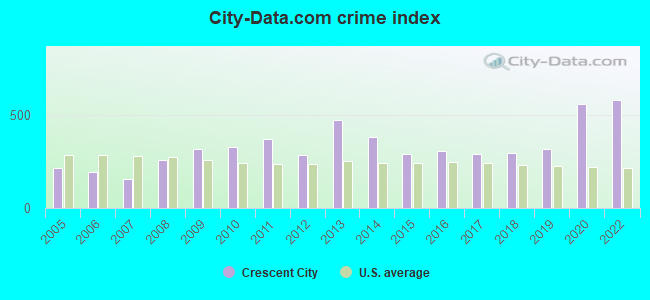
Crime - City-data.com crime index
Crime - Violent crime index
Crime - Property crime index
Crime - Murders per 100,000 population (5 year average)
Crime - Rapes per 100,000 population (5 year average)
Crime - Robberies per 100,000 population (5 year average)
Crime - Assaults per 100,000 population (5 year average)
Crime - Burglaries per 100,000 population (5 year average)
Crime - Thefts per 100,000 population (5 year average)
Crime - Auto thefts per 100,000 population (5 year average)
Crime - Arson per 100,000 population (5 year average)
Crime - City-data.com crime index (5 year average)
Crime - Violent crime index (5 year average)
Crime - Property crime index (5 year average)
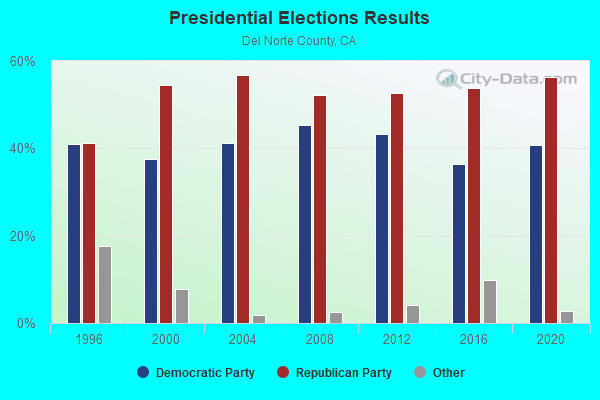
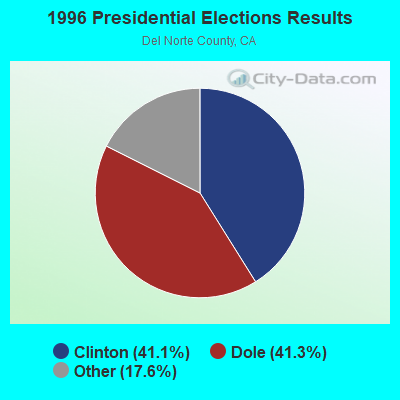
1996 Presidential Elections Results (%) - Democratic Party (Clinton)
1996 Presidential Elections Results (%) - Republican Party (Dole)
1996 Presidential Elections Results (%) - Other
2000 Presidential Elections Results (%) - Democratic Party (Gore)
2000 Presidential Elections Results (%) - Republican Party (Bush)
2000 Presidential Elections Results (%) - Other
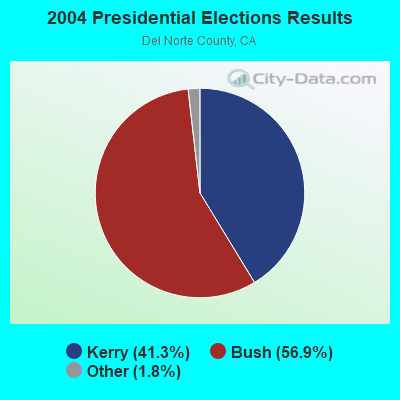
2004 Presidential Elections Results (%) - Democratic Party (Kerry)
2004 Presidential Elections Results (%) - Republican Party (Bush)
2004 Presidential Elections Results (%) - Other
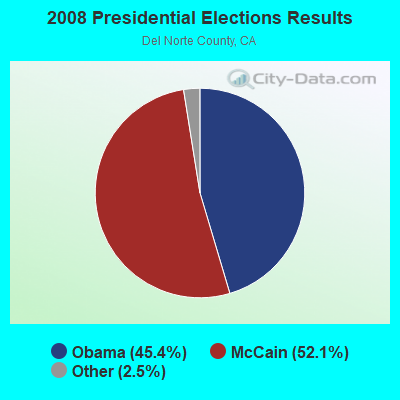
2008 Presidential Elections Results (%) - Democratic Party (Obama)
2008 Presidential Elections Results (%) - Republican Party (McCain)
2008 Presidential Elections Results (%) - Other
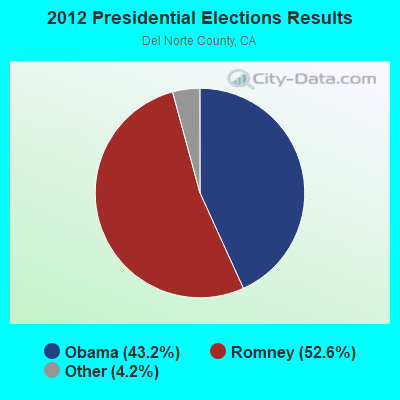
2012 Presidential Elections Results (%) - Democratic Party (Obama)
2012 Presidential Elections Results (%) - Republican Party (Romney)
2012 Presidential Elections Results (%) - Other
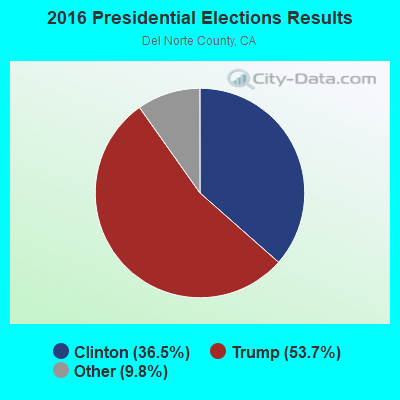
2016 Presidential Elections Results (%) - Democratic Party (Clinton)
2016 Presidential Elections Results (%) - Republican Party (Trump)
2016 Presidential Elections Results (%) - Other
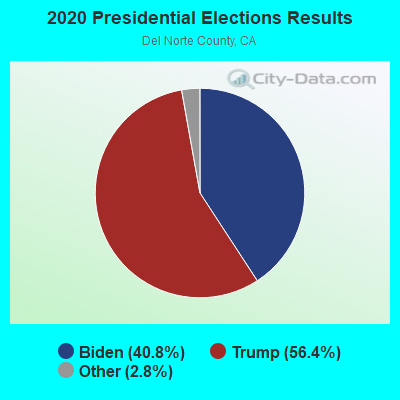
2020 Presidential Elections Results (%) - Democratic Party (Biden)
2020 Presidential Elections Results (%) - Republican Party (Trump)
2020 Presidential Elections Results (%) - Other
Ancestries Reported - Arab (%)
Ancestries Reported - Czech (%)
Ancestries Reported - Danish (%)
Ancestries Reported - Dutch (%)
Ancestries Reported - English (%)
Ancestries Reported - French (%)
Ancestries Reported - French Canadian (%)
Ancestries Reported - German (%)
Ancestries Reported - Greek (%)
Ancestries Reported - Hungarian (%)
Ancestries Reported - Irish (%)
Ancestries Reported - Italian (%)
Ancestries Reported - Lithuanian (%)
Ancestries Reported - Norwegian (%)
Ancestries Reported - Polish (%)
Ancestries Reported - Portuguese (%)
Ancestries Reported - Russian (%)
Ancestries Reported - Scotch-Irish (%)
Ancestries Reported - Scottish (%)
Ancestries Reported - Slovak (%)
Ancestries Reported - Subsaharan African (%)
Ancestries Reported - Swedish (%)
Ancestries Reported - Swiss (%)
Ancestries Reported - Ukrainian (%)
Ancestries Reported - United States (%)
Ancestries Reported - Welsh (%)
Ancestries Reported - West Indian (%)
Ancestries Reported - Other (%)
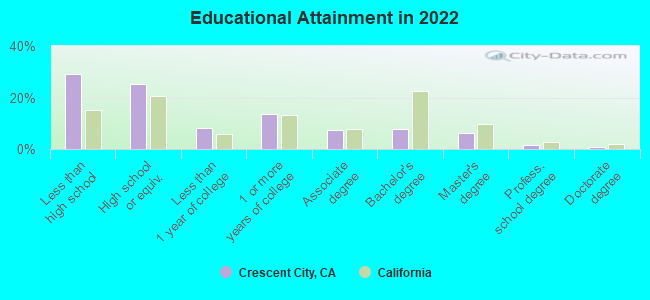
Educational Attainment - No schooling completed (%)
Educational Attainment - Less than high school (%)
Educational Attainment - High school or equivalent (%)
Educational Attainment - Less than 1 year of college (%)
Educational Attainment - 1 or more years of college (%)
Educational Attainment - Associate degree (%)
Educational Attainment - Bachelor's degree (%)
Educational Attainment - Master's degree (%)
Educational Attainment - Professional school degree (%)
Educational Attainment - Doctorate degree (%)
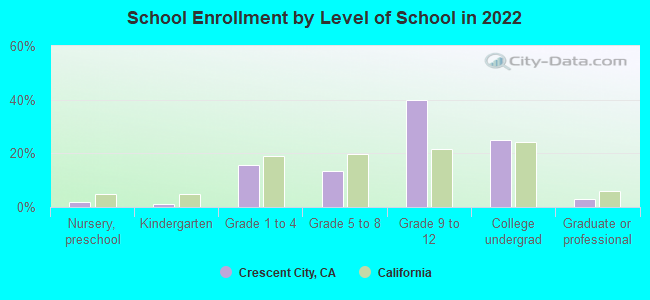
School Enrollment - Nursery, preschool (%)
School Enrollment - Kindergarten (%)
School Enrollment - Grade 1 to 4 (%)
School Enrollment - Grade 5 to 8 (%)
School Enrollment - Grade 9 to 12 (%)
School Enrollment - College undergrad (%)
School Enrollment - Graduate or professional (%)
School Enrollment - Not enrolled in school (%)
School enrollment - Public schools (%)
School enrollment - Private schools (%)
School enrollment - Not enrolled (%)
Median number of rooms in houses and condos
Median number of rooms in apartments
Housing units lacking complete plumbing facilities (%)
Housing units lacking complete kitchen facilities (%)
Density of houses
Urban houses (%)
Rural houses (%)
Households with people 60 years and over (%)
Households with people 65 years and over (%)
Households with people 75 years and over (%)
Households with one or more nonrelatives (%)
Households with no nonrelatives (%)
Population in households (%)
Family households (%)
Nonfamily households (%)
Population in families (%)
Family households with own children (%)
Median number of bedrooms in owner occupied houses
Mean number of bedrooms in owner occupied houses
Median number of bedrooms in renter occupied houses
Mean number of bedrooms in renter occupied houses
Median number of vehichles in owner occupied houses
Mean number of vehichles in owner occupied houses
Median number of vehichles in renter occupied houses
Mean number of vehichles in renter occupied houses
Mortgage status - with mortgage (%)
Mortgage status - with second mortgage (%)
Mortgage status - with home equity loan (%)
Mortgage status - with both second mortgage and home equity loan (%)
Mortgage status - without a mortgage (%)
Average family size
Average family size - White
Average family size - Black or African American
Average family size - Asian
Average family size - Hispanic or Latino
Average family size - American Indian and Alaska Native
Average family size - Multirace
Average family size - Other Race
Geographical mobility - Same house 1 year ago (%)
Geographical mobility - Moved within same county (%)
Geographical mobility - Moved from different county within same state (%)
Geographical mobility - Moved from different state (%)
Geographical mobility - Moved from abroad (%)
Place of birth - Born in state of residence (%)
Place of birth - Born in other state (%)
Place of birth - Native, outside of US (%)
Place of birth - Foreign born (%)
Housing units in structures - 1, detached (%)
Housing units in structures - 1, attached (%)
Housing units in structures - 2 (%)
Housing units in structures - 3 or 4 (%)
Housing units in structures - 5 to 9 (%)
Housing units in structures - 10 to 19 (%)
Housing units in structures - 20 to 49 (%)
Housing units in structures - 50 or more (%)
Housing units in structures - Mobile home (%)
Housing units in structures - Boat, RV, van, etc. (%)
House/condo owner moved in on average (years ago)
Renter moved in on average (years ago)
Year householder moved into unit - Moved in 1999 to March 2000 (%)
Year householder moved into unit - Moved in 1995 to 1998 (%)
Year householder moved into unit - Moved in 1990 to 1994 (%)
Year householder moved into unit - Moved in 1980 to 1989 (%)
Year householder moved into unit - Moved in 1970 to 1979 (%)
Year householder moved into unit - Moved in 1969 or earlier (%)
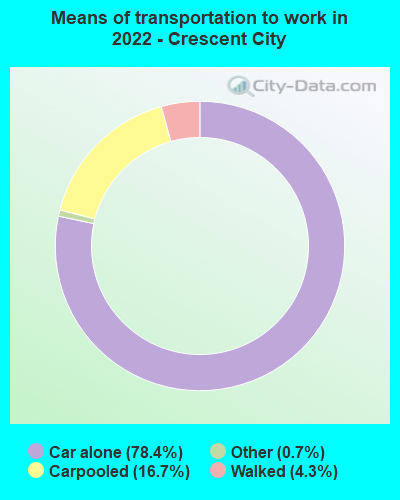
Means of transportation to work - Drove car alone (%)
Means of transportation to work - Carpooled (%)
Means of transportation to work - Public transportation (%)
Means of transportation to work - Bus or trolley bus (%)
Means of transportation to work - Streetcar or trolley car (%)
Means of transportation to work - Subway or elevated (%)
Means of transportation to work - Railroad (%)
Means of transportation to work - Ferryboat (%)
Means of transportation to work - Taxicab (%)
Means of transportation to work - Motorcycle (%)
Means of transportation to work - Bicycle (%)
Means of transportation to work - Walked (%)
Means of transportation to work - Other means (%)
Working at home (%)
Industry diversity
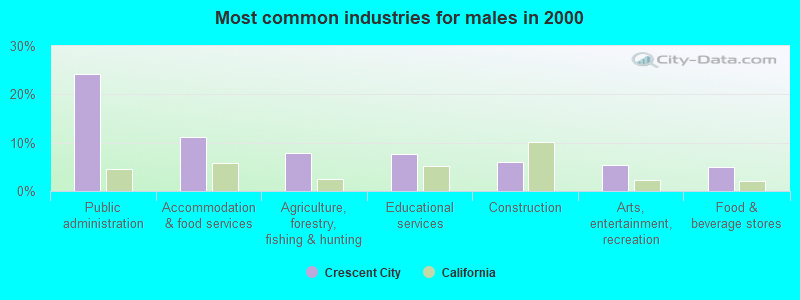
Most Common Industries - Agriculture, forestry, fishing and hunting, and mining (%)
Most Common Industries - Agriculture, forestry, fishing and hunting (%)
Most Common Industries - Mining, quarrying, and oil and gas extraction (%)
Most Common Industries - Construction (%)
Most Common Industries - Manufacturing (%)
Most Common Industries - Wholesale trade (%)
Most Common Industries - Retail trade (%)
Most Common Industries - Transportation and warehousing, and utilities (%)
Most Common Industries - Transportation and warehousing (%)
Most Common Industries - Utilities (%)
Most Common Industries - Information (%)
Most Common Industries - Finance and insurance, and real estate and rental and leasing (%)
Most Common Industries - Finance and insurance (%)
Most Common Industries - Real estate and rental and leasing (%)
Most Common Industries - Professional, scientific, and management, and administrative and waste management services (%)
Most Common Industries - Professional, scientific, and technical services (%)
Most Common Industries - Management of companies and enterprises (%)
Most Common Industries - Administrative and support and waste management services (%)
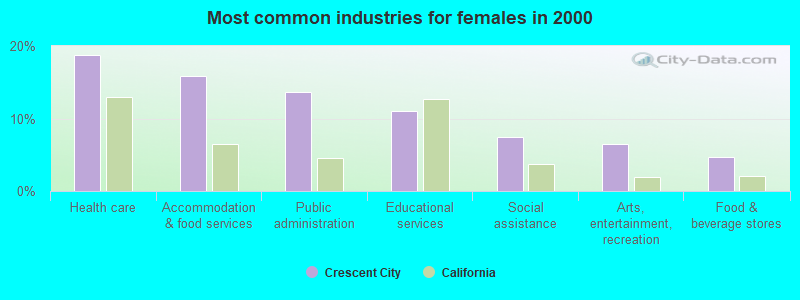
Most Common Industries - Educational services, and health care and social assistance (%)
Most Common Industries - Educational services (%)
Most Common Industries - Health care and social assistance (%)
Most Common Industries - Arts, entertainment, and recreation, and accommodation and food services (%)
Most Common Industries - Arts, entertainment, and recreation (%)
Most Common Industries - Accommodation and food services (%)
Most Common Industries - Other services, except public administration (%)
Most Common Industries - Public administration (%)
Occupation diversity
Most Common Occupations - Management, business, science, and arts occupations (%)
Most Common Occupations - Management, business, and financial occupations (%)
Most Common Occupations - Management occupations (%)
Most Common Occupations - Business and financial operations occupations (%)
Most Common Occupations - Computer, engineering, and science occupations (%)
Most Common Occupations - Computer and mathematical occupations (%)
Most Common Occupations - Architecture and engineering occupations (%)
Most Common Occupations - Life, physical, and social science occupations (%)
Most Common Occupations - Education, legal, community service, arts, and media occupations (%)
Most Common Occupations - Community and social service occupations (%)
Most Common Occupations - Legal occupations (%)
Most Common Occupations - Education, training, and library occupations (%)
Most Common Occupations - Arts, design, entertainment, sports, and media occupations (%)
Most Common Occupations - Healthcare practitioners and technical occupations (%)
Most Common Occupations - Health diagnosing and treating practitioners and other technical occupations (%)
Most Common Occupations - Health technologists and technicians (%)
Most Common Occupations - Service occupations (%)
Most Common Occupations - Healthcare support occupations (%)
Most Common Occupations - Protective service occupations (%)
Most Common Occupations - Fire fighting and prevention, and other protective service workers including supervisors (%)
Most Common Occupations - Law enforcement workers including supervisors (%)
Most Common Occupations - Food preparation and serving related occupations (%)
Most Common Occupations - Building and grounds cleaning and maintenance occupations (%)
Most Common Occupations - Personal care and service occupations (%)
Most Common Occupations - Sales and office occupations (%)
Most Common Occupations - Sales and related occupations (%)
Most Common Occupations - Office and administrative support occupations (%)
Most Common Occupations - Natural resources, construction, and maintenance occupations (%)
Most Common Occupations - Farming, fishing, and forestry occupations (%)
Most Common Occupations - Construction and extraction occupations (%)
Most Common Occupations - Installation, maintenance, and repair occupations (%)
Most Common Occupations - Production, transportation, and material moving occupations (%)
Most Common Occupations - Production occupations (%)
Most Common Occupations - Transportation occupations (%)
Most Common Occupations - Material moving occupations (%)
People in Group quarters - Institutionalized population (%)
People in Group quarters - Correctional institutions (%)
People in Group quarters - Federal prisons and detention centers (%)
People in Group quarters - Halfway houses (%)
People in Group quarters - Local jails and other confinement facilities (including police lockups) (%)
People in Group quarters - Military disciplinary barracks (%)
People in Group quarters - State prisons (%)
People in Group quarters - Other types of correctional institutions (%)
People in Group quarters - Nursing homes (%)
People in Group quarters - Hospitals/wards, hospices, and schools for the handicapped (%)
People in Group quarters - Hospitals/wards and hospices for chronically ill (%)
People in Group quarters - Hospices or homes for chronically ill (%)
People in Group quarters - Military hospitals or wards for chronically ill (%)
People in Group quarters - Other hospitals or wards for chronically ill (%)
People in Group quarters - Hospitals or wards for drug/alcohol abuse (%)
People in Group quarters - Mental (Psychiatric) hospitals or wards (%)
People in Group quarters - Schools, hospitals, or wards for the mentally retarded (%)
People in Group quarters - Schools, hospitals, or wards for the physically handicapped (%)
People in Group quarters - Institutions for the deaf (%)
People in Group quarters - Institutions for the blind (%)
People in Group quarters - Orthopedic wards and institutions for the physically handicapped (%)
People in Group quarters - Wards in general hospitals for patients who have no usual home elsewhere (%)
People in Group quarters - Wards in military hospitals for patients who have no usual home elsewhere (%)
People in Group quarters - Juvenile institutions (%)
People in Group quarters - Long-term care (%)
People in Group quarters - Homes for abused, dependent, and neglected children (%)
People in Group quarters - Residential treatment centers for emotionally disturbed children (%)
People in Group quarters - Training schools for juvenile delinquents (%)
People in Group quarters - Short-term care, detention or diagnostic centers for delinquent children (%)
People in Group quarters - Type of juvenile institution unknown (%)
People in Group quarters - Noninstitutionalized population (%)
People in Group quarters - College dormitories (includes college quarters off campus) (%)
People in Group quarters - Military quarters (%)
People in Group quarters - On base (%)
People in Group quarters - Barracks, unaccompanied personnel housing (UPH), (Enlisted/Officer), ;and similar group living quarters for military personnel (%)
People in Group quarters - Transient quarters for temporary residents (%)
People in Group quarters - Military ships (%)
People in Group quarters - Group homes (%)
People in Group quarters - Homes or halfway houses for drug/alcohol abuse (%)
People in Group quarters - Homes for the mentally ill (%)
People in Group quarters - Homes for the mentally retarded (%)
People in Group quarters - Homes for the physically handicapped (%)
People in Group quarters - Other group homes (%)
People in Group quarters - Religious group quarters (%)
People in Group quarters - Dormitories (%)
People in Group quarters - Agriculture workers' dormitories on farms (%)
People in Group quarters - Job Corps and vocational training facilities (%)
People in Group quarters - Other workers' dormitories (%)
People in Group quarters - Crews of maritime vessels (%)
People in Group quarters - Other nonhousehold living situations (%)
People in Group quarters - Other noninstitutional group quarters (%)
Residents speaking English at home (%)
Residents speaking English at home - Born in the United States (%)
Residents speaking English at home - Native, born elsewhere (%)
Residents speaking English at home - Foreign born (%)
Residents speaking Spanish at home (%)
Residents speaking Spanish at home - Born in the United States (%)
Residents speaking Spanish at home - Native, born elsewhere (%)
Residents speaking Spanish at home - Foreign born (%)
Residents speaking other language at home (%)
Residents speaking other language at home - Born in the United States (%)
Residents speaking other language at home - Native, born elsewhere (%)
Residents speaking other language at home - Foreign born (%)
Class of Workers - Employee of private company (%)
Class of Workers - Self-employed in own incorporated business (%)
Class of Workers - Private not-for-profit wage and salary workers (%)
Class of Workers - Local government workers (%)
Class of Workers - State government workers (%)
Class of Workers - Federal government workers (%)
Class of Workers - Self-employed workers in own not incorporated business and Unpaid family workers (%)
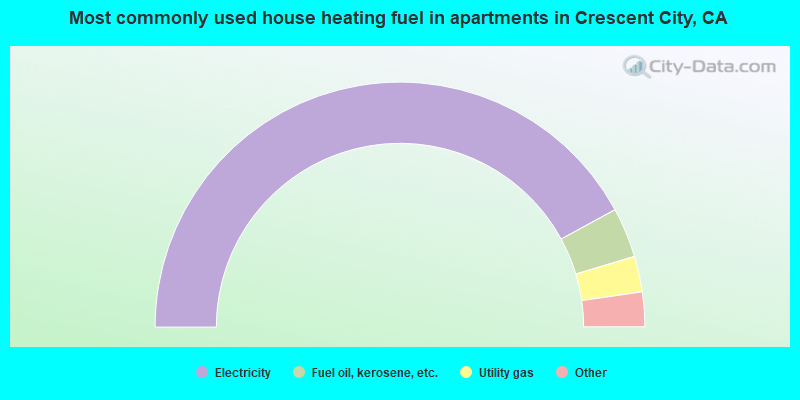
House heating fuel used in houses and condos - Utility gas (%)
House heating fuel used in houses and condos - Bottled, tank, or LP gas (%)
House heating fuel used in houses and condos - Electricity (%)
House heating fuel used in houses and condos - Fuel oil, kerosene, etc. (%)
House heating fuel used in houses and condos - Coal or coke (%)
House heating fuel used in houses and condos - Wood (%)
House heating fuel used in houses and condos - Solar energy (%)
House heating fuel used in houses and condos - Other fuel (%)
House heating fuel used in houses and condos - No fuel used (%)
House heating fuel used in apartments - Utility gas (%)
House heating fuel used in apartments - Bottled, tank, or LP gas (%)
House heating fuel used in apartments - Electricity (%)
House heating fuel used in apartments - Fuel oil, kerosene, etc. (%)
House heating fuel used in apartments - Coal or coke (%)
House heating fuel used in apartments - Wood (%)
House heating fuel used in apartments - Solar energy (%)
House heating fuel used in apartments - Other fuel (%)
House heating fuel used in apartments - No fuel used (%)
Armed forces status - In Armed Forces (%)
Armed forces status - Civilian (%)
Armed forces status - Civilian - Veteran (%)
Armed forces status - Civilian - Nonveteran (%)
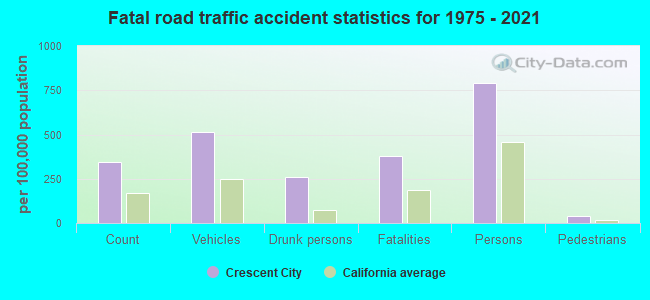
Fatal accidents locations in years 2005-2021
Fatal accidents locations in 2005
Fatal accidents locations in 2006
Fatal accidents locations in 2007
Fatal accidents locations in 2008
Fatal accidents locations in 2009
Fatal accidents locations in 2010
Fatal accidents locations in 2011
Fatal accidents locations in 2012
Fatal accidents locations in 2013
Fatal accidents locations in 2014
Fatal accidents locations in 2015
Fatal accidents locations in 2016
Fatal accidents locations in 2017
Fatal accidents locations in 2018
Fatal accidents locations in 2019
Fatal accidents locations in 2020
Fatal accidents locations in 2021
Alcohol use - People drinking some alcohol every month (%)
Alcohol use - People not drinking at all (%)
Alcohol use - Average days/month drinking alcohol
Alcohol use - Average drinks/week
Alcohol use - Average days/year people drink much
Audiometry - Average condition of hearing (%)
Audiometry - People that can hear a whisper from across a quiet room (%)
Audiometry - People that can hear normal voice from across a quiet room (%)
Audiometry - Ears ringing, roaring, buzzing (%)
Audiometry - Had a job exposure to loud noise (%)
Audiometry - Had off-work exposure to loud noise (%)
Blood Pressure & Cholesterol - Has high blood pressure (%)
Blood Pressure & Cholesterol - Checking blood pressure at home (%)
Blood Pressure & Cholesterol - Frequently checking blood cholesterol (%)
Blood Pressure & Cholesterol - Has high cholesterol level (%)
Consumer Behavior - Money monthly spent on food at supermarket/grocery store
Consumer Behavior - Money monthly spent on food at other stores
Consumer Behavior - Money monthly spent on eating out
Consumer Behavior - Money monthly spent on carryout/delivered foods
Consumer Behavior - Income spent on food at supermarket/grocery store (%)
Consumer Behavior - Income spent on food at other stores (%)
Consumer Behavior - Income spent on eating out (%)
Consumer Behavior - Income spent on carryout/delivered foods (%)
Current Health Status - General health condition (%)
Current Health Status - Blood donors (%)
Current Health Status - Has blood ever tested for HIV virus (%)
Current Health Status - Left-handed people (%)
Dermatology - People using sunscreen (%)
Diabetes - Diabetics (%)
Diabetes - Had a blood test for high blood sugar (%)
Diabetes - People taking insulin (%)
Diet Behavior & Nutrition - Diet health (%)
Diet Behavior & Nutrition - Milk product consumption (# of products/month)
Diet Behavior & Nutrition - Meals not home prepared (#/week)
Diet Behavior & Nutrition - Meals from fast food or pizza place (#/week)
Diet Behavior & Nutrition - Ready-to-eat foods (#/month)
Diet Behavior & Nutrition - Frozen meals/pizza (#/month)
Drug Use - People that ever used marijuana or hashish (%)
Drug Use - Ever used hard drugs (%)
Drug Use - Ever used any form of cocaine (%)
Drug Use - Ever used heroin (%)
Drug Use - Ever used methamphetamine (%)
Health Insurance - People covered by health insurance (%)
Kidney Conditions-Urology - Avg. # of times urinating at night
Medical Conditions - People with asthma (%)
Medical Conditions - People with anemia (%)
Medical Conditions - People with psoriasis (%)
Medical Conditions - People with overweight (%)
Medical Conditions - Elderly people having difficulties in thinking or remembering (%)
Medical Conditions - People who ever received blood transfusion (%)
Medical Conditions - People having trouble seeing even with glass/contacts (%)
Medical Conditions - People with arthritis (%)
Medical Conditions - People with gout (%)
Medical Conditions - People with congestive heart failure (%)
Medical Conditions - People with coronary heart disease (%)
Medical Conditions - People with angina pectoris (%)
Medical Conditions - People who ever had heart attack (%)
Medical Conditions - People who ever had stroke (%)
Medical Conditions - People with emphysema (%)
Medical Conditions - People with thyroid problem (%)
Medical Conditions - People with chronic bronchitis (%)
Medical Conditions - People with any liver condition (%)
Medical Conditions - People who ever had cancer or malignancy (%)
Mental Health - People who have little interest in doing things (%)
Mental Health - People feeling down, depressed, or hopeless (%)
Mental Health - People who have trouble sleeping or sleeping too much (%)
Mental Health - People feeling tired or having little energy (%)
Mental Health - People with poor appetite or overeating (%)
Mental Health - People feeling bad about themself (%)
Mental Health - People who have trouble concentrating on things (%)
Mental Health - People moving or speaking slowly or too fast (%)
Mental Health - People having thoughts they would be better off dead (%)
Oral Health - Average years since last visit a dentist
Oral Health - People embarrassed because of mouth (%)
Oral Health - People with gum disease (%)
Oral Health - General health of teeth and gums (%)
Oral Health - Average days a week using dental floss/device
Oral Health - Average days a week using mouthwash for dental problem
Oral Health - Average number of teeth
Pesticide Use - Households using pesticides to control insects (%)
Pesticide Use - Households using pesticides to kill weeds (%)
Physical Activity - People doing vigorous-intensity work activities (%)
Physical Activity - People doing moderate-intensity work activities (%)
Physical Activity - People walking or bicycling (%)
Physical Activity - People doing vigorous-intensity recreational activities (%)
Physical Activity - People doing moderate-intensity recreational activities (%)
Physical Activity - Average hours a day doing sedentary activities
Physical Activity - Average hours a day watching TV or videos
Physical Activity - Average hours a day using computer
Physical Functioning - People having limitations keeping them from working (%)
Physical Functioning - People limited in amount of work they can do (%)
Physical Functioning - People that need special equipment to walk (%)
Physical Functioning - People experiencing confusion/memory problems (%)
Physical Functioning - People requiring special healthcare equipment (%)
Prescription Medications - Average number of prescription medicines taking
Preventive Aspirin Use - Adults 40+ taking low-dose aspirin (%)
Reproductive Health - Vaginal deliveries (%)
Reproductive Health - Cesarean deliveries (%)
Reproductive Health - Deliveries resulted in a live birth (%)
Reproductive Health - Pregnancies resulted in a delivery (%)
Reproductive Health - Women breastfeeding newborns (%)
Reproductive Health - Women that had a hysterectomy (%)
Reproductive Health - Women that had both ovaries removed (%)
Reproductive Health - Women that have ever taken birth control pills (%)
Reproductive Health - Women taking birth control pills (%)
Reproductive Health - Women that have ever used Depo-Provera or injectables (%)
Reproductive Health - Women that have ever used female hormones (%)
Sexual Behavior - People 18+ that ever had sex (vaginal, anal, or oral) (%)
Sexual Behavior - Males 18+ that ever had vaginal sex with a woman (%)
Sexual Behavior - Males 18+ that ever performed oral sex on a woman (%)
Sexual Behavior - Males 18+ that ever had anal sex with a woman (%)
Sexual Behavior - Males 18+ that ever had any sex with a man (%)
Sexual Behavior - Females 18+ that ever had vaginal sex with a man (%)
Sexual Behavior - Females 18+ that ever performed oral sex on a man (%)
Sexual Behavior - Females 18+ that ever had anal sex with a man (%)
Sexual Behavior - Females 18+ that ever had any kind of sex with a woman (%)
Sexual Behavior - Average age people first had sex
Sexual Behavior - Average number of female sex partners in lifetime (males 18+)
Sexual Behavior - Average number of female vaginal sex partners in lifetime (males 18+)
Sexual Behavior - Average age people first performed oral sex on a woman (18+)
Sexual Behavior - Average number of woman performed oral sex on in lifetime (18+)
Sexual Behavior - Average number of male sex partners in lifetime (males 18+)
Sexual Behavior - Average number of male anal sex partners in lifetime (males 18+)
Sexual Behavior - Average age people first performed oral sex on a man (18+)
Sexual Behavior - Average number of male oral sex partners in lifetime (18+)
Sexual Behavior - People using protection when performing oral sex (%)
Sexual Behavior - Average number of times people have vaginal or anal sex a year
Sexual Behavior - People having sex without condom (%)
Sexual Behavior - Average number of male sex partners in lifetime (females 18+)
Sexual Behavior - Average number of male vaginal sex partners in lifetime (females 18+)
Sexual Behavior - Average number of female sex partners in lifetime (females 18+)
Sexual Behavior - Circumcised males 18+ (%)
Sleep Disorders - Average hours sleeping at night
Sleep Disorders - People that has trouble sleeping (%)
Smoking-Cigarette Use - People smoking cigarettes (%)
Taste & Smell - People 40+ having problems with smell (%)
Taste & Smell - People 40+ having problems with taste (%)
Taste & Smell - People 40+ that ever had wisdom teeth removed (%)
Taste & Smell - People 40+ that ever had tonsils teeth removed (%)
Taste & Smell - People 40+ that ever had a loss of consciousness because of a head injury (%)
Taste & Smell - People 40+ that ever had a broken nose or other serious injury to face or skull (%)
Taste & Smell - People 40+ that ever had two or more sinus infections (%)
Weight - Average height (inches)
Weight - Average weight (pounds)
Weight - Average BMI
Weight - People that are obese (%)
Weight - People that ever were obese (%)
Weight - People trying to lose weight (%)
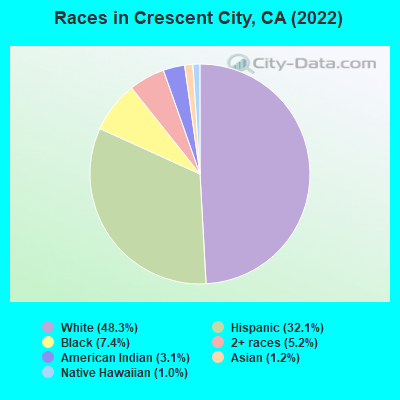
3,054 48.3% White alone 2,031 32.1% Hispanic 471 7.4% Black alone 331 5.2% Two or more races 197 3.1% American Indian alone 77 1.2% Asian alone 61 1.0% Native Hawaiian and Other 5 0.08% Other race alone
Officers per 1,000 residents here:
1.77California average:
2.30
Latest news from Crescent City, CA collected exclusively by city-data.com from local newspapers, TV, and radio stations
Ancestries: American (13.0%), English (10.3%), Portuguese (4.1%), Irish (2.4%), German (1.7%), Swedish (1.1%).
Current Local Time:
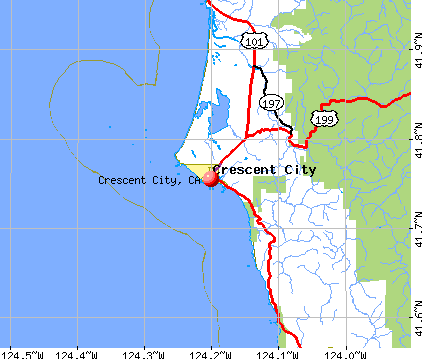
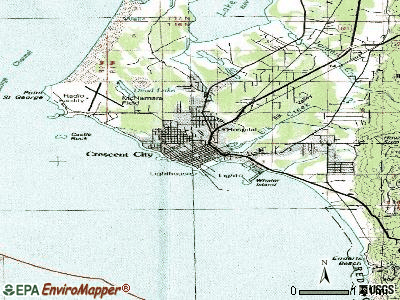
Land area: 1.78 square miles.
Population density: 3,364 people per square mile (average).
645 residents are foreign born (5.5% Latin America , 2.3% Asia , 2.0% Europe ).
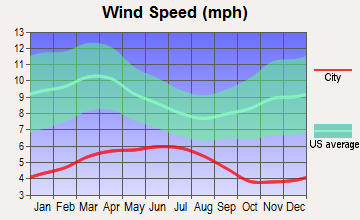
This city:
10.2%California:
26.5%
Median real estate property taxes paid for housing units with mortgages in 2022: $2,014 (0.7%)Median real estate property taxes paid for housing units with no mortgage in 2022: $1,790 (0.6%)
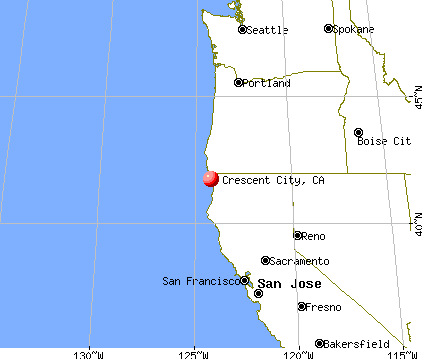
Nearest city with pop. 50,000+: Medford, OR
Nearest city with pop. 200,000+: Northwest Clackamas, OR (264.1 miles
Nearest city with pop. 1,000,000+: Los Angeles, CA
Nearest cities:
Latitude: 41.75 N, Longitude: 124.20 W
Daytime population change due to commuting: +3,781 (+59.8%)Workers who live and work in this city: 1,100 (66.1%)
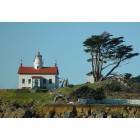
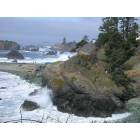
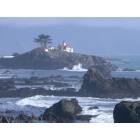
Crescent City tourist attractions:
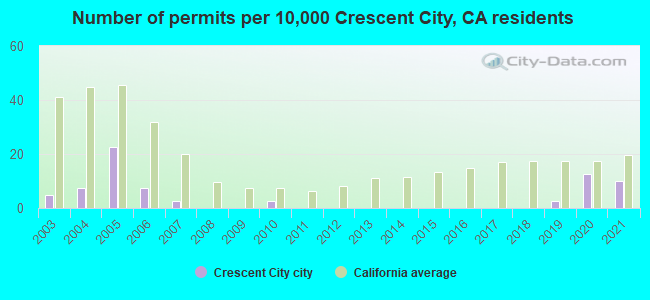
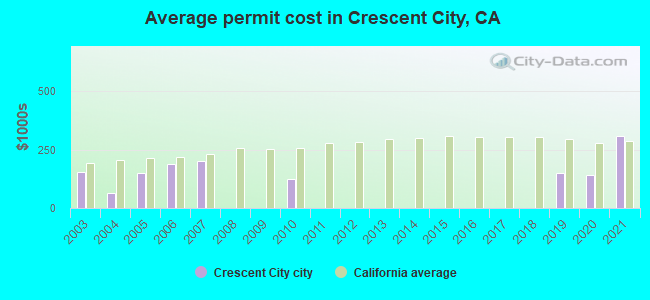
Single-family new house construction building permits:
2021: 4 buildings , average cost: $307,5002020: 5 buildings , average cost: $140,9002019: 1 building , cost: $150,0002010: 1 building , cost: $125,8002007: 1 building , cost: $200,0002006: 3 buildings , average cost: $188,2002005: 9 buildings , average cost: $149,9002004: 3 buildings , average cost: $65,7002003: 2 buildings , average cost: $153,000Unemployment in December 2023:
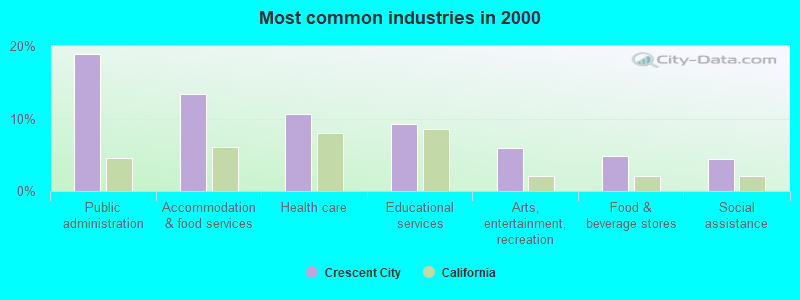
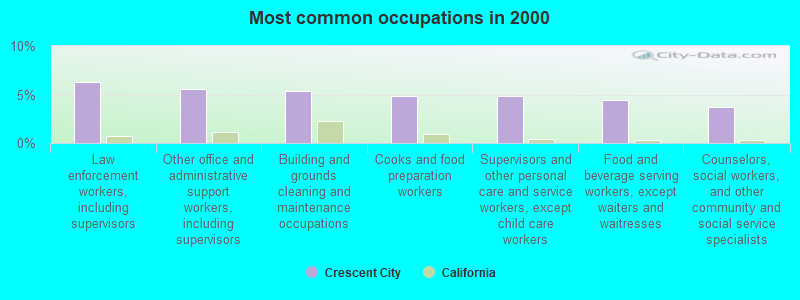
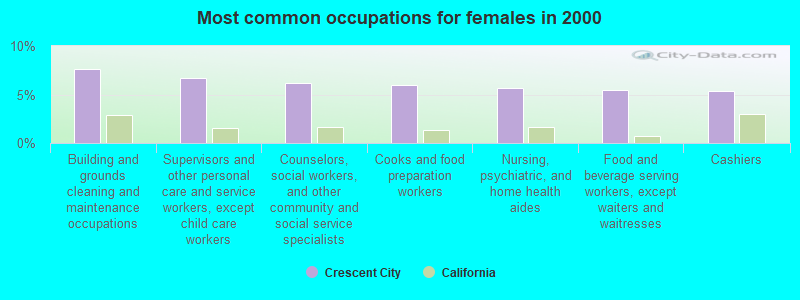
Most common occupations in Crescent City, CA (%)
Both Males Females
Law enforcement workers, including supervisors (6.3%)
Other office and administrative support workers, including supervisors (5.5%)
Building and grounds cleaning and maintenance occupations (5.4%)
Cooks and food preparation workers (4.9%)
Supervisors and other personal care and service workers, except child care workers (4.9%)
Food and beverage serving workers, except waiters and waitresses (4.4%)
Counselors, social workers, and other community and social service specialists (3.7%)
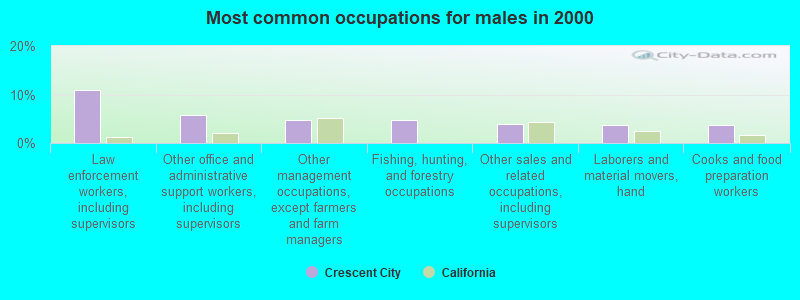
Law enforcement workers, including supervisors (10.9%)
Other office and administrative support workers, including supervisors (5.9%)
Other management occupations, except farmers and farm managers (4.7%)
Fishing, hunting, and forestry occupations (4.7%)
Other sales and related occupations, including supervisors (3.9%)
Laborers and material movers, hand (3.8%)
Cooks and food preparation workers (3.8%)
Building and grounds cleaning and maintenance occupations (7.7%)
Supervisors and other personal care and service workers, except child care workers (6.7%)
Counselors, social workers, and other community and social service specialists (6.2%)
Cooks and food preparation workers (6.0%)
Nursing, psychiatric, and home health aides (5.7%)
Food and beverage serving workers, except waiters and waitresses (5.5%)
Cashiers (5.3%)
Air pollution and air quality trends(lower is better)
AQI PM2.5
Earthquake activity:
Crescent City-area historical earthquake activity is significantly above California state average. It is 3345% greater than the overall U.S. average. On 1/31/1922 at 13:17:28, a magnitude 7.6 (7.6 UK, Class: Major, Intensity: VIII - XII) earthquake occurred 101.3 miles away from Crescent City center On 11/8/1980 at 10:27:34, a magnitude 7.2 (6.2 MB, 7.2 MS, 7.2 MW, 7.0 ML) earthquake occurred 44.9 miles away from Crescent City center On 6/15/2005 at 02:50:54, a magnitude 7.2 (7.2 MW, Depth: 9.9 mi) earthquake occurred 96.2 miles away from the city center On 8/17/1991 at 22:17:14, a magnitude 7.1 (6.2 MB, 7.1 MS, 7.1 MW, 6.8 ML, Depth: 8.4 mi) earthquake occurred 71.5 miles away from the city center On 4/25/1992 at 18:06:04, a magnitude 7.2 (6.3 MB, 7.1 MS, 7.2 MW, 7.1 MW, Depth: 9.4 mi) earthquake occurred 97.4 miles away from the city center, causing $75,000,000 total damage On 4/18/1906 at 13:12:21, a magnitude 7.9 (7.9 UK) earthquake occurred 267.4 miles away from Crescent City center, causing $524,000,000 total damage Magnitude types: body-wave magnitude (MB), local magnitude (ML), surface-wave magnitude (MS), moment magnitude (MW) Natural disasters: The number of natural disasters in Del Norte County (16) is near the US average (15).Major Disasters (Presidential) Declared: 11Emergencies Declared: 1Floods: 12, Storms: 7, Winter Storms: 5, Landslides: 4, Mudslides: 3, Fire: 1, Heavy Rain: 1, Hurricane: 1, Tornado: 1, Tsunami Wave: 1, Other: 1 (Note: some incidents may be assigned to more than one category). Hospitals and medical centers in Crescent City: SUTTER COAST HOME CARE AND HOSPICE (983 3RD STREET SUITE D) SUTTER COAST HOSPITAL (Government - Hospital District or Authority, 800 E WASHINGTON BLVD) SUTTER COAST HOME CARE (983 3 RD ST STE D)
CRESCENT CITY NURSING AND REHAB (1280 MARSHALL AVE)
Airports located in Crescent City: Colleges/universities with over 2000 students nearest to Crescent City:
Humboldt State University (about 62 miles; Arcata, CA ; Full-time enrollment: 7,353)
Rogue Community College (about 62 miles; Grants Pass, OR ; FT enrollment: 3,600)
College of the Redwoods (about 74 miles; Eureka, CA ; FT enrollment: 4,410)
Southern Oregon University (about 84 miles; Ashland, OR ; FT enrollment: 4,650)
Shasta College (about 126 miles; Redding, CA ; FT enrollment: 5,645)
Oregon Institute of Technology (about 129 miles; Klamath Falls, OR ; FT enrollment: 2,900)
Lane Community College (about 167 miles; Eugene, OR ; FT enrollment: 6,373)
Public high schools in Crescent City: DEL NORTE HIGH Students: 734, Location: 1301 EL DORADO ST., Grades: 9-12)CASTLE ROCK Students: 208, Location: 1260 GLENN ST., Grades: KG-12, Charter school )SUNSET HIGH Students: 13, Location: 2500 ELK VALLEY CROSS RD., Grades: 9-12)ELK CREEK Students: 3, Location: 1115 WILLIAMS DR., Grades: 7-12)DEL NORTE COUNTY ROP Location: 1301 EL DORADO, Grades: 9-12)DEL NORTE COMMUNITY Location: 400 W. HARDING ST., Grades: KG-12)Private high school in Crescent City: FOURSQUARE CHRISTIAN SCHOOL Students: 102, Location: 144 BUTTE ST, Grades: PK-12)
Public elementary/middle schools in Crescent City: CRESCENT ELK MIDDLE Students: 486, Location: 994 G ST., Grades: 6-8)MARY PEACOCK ELEMENTARY Students: 262, Location: 1720 ARLINGTON, Grades: KG-5)JOE HAMILTON ELEMENTARY Students: 201, Location: 1050 E ST., Grades: KG-5)BESS MAXWELL ELEMENTARY Students: 166, Location: 1124 EL DORADO ST., Grades: KG-5)PINE GROVE ELEMENTARY Students: 149, Location: 900 PINE GROVE RD., Grades: KG-5)UNCHARTED SHORES ACADEMY Students: 58, Location: 330 E ST., Grades: KG-8, Charter school )REDWOOD ELEMENTARY Location: 6900 LAKE EARL DR., Grades: KG-8)
Private elementary/middle school in Crescent City: CRESCENT CITY SEVENTH-DAY ADVENTIST SCHOOL Students: 11, Location: 1770 NORTHCREST DR, Grades: 3-8)
See full list of schools located in Crescent City Library in Crescent City: DEL NORTE COUNTY LIBRARY DISTRICT Operating income: $223,984; Location: 190 PRICE MALL; 50,749 books ; 1,246 audio materials ; 1,387 video materials ; 9 other licensed databases ; 57 print serial subscriptions )
User-submitted facts and corrections:
Uncharted Shores Academy: K-8 charter school (public)
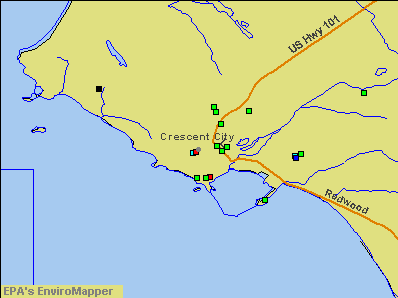
Notable locations in Crescent City: (A) , Del Norte County Courthouse (B) , Pelican Bay State Prison Fire Department (C) , Crescent Fire Protection District Cooper Station (D) , Crescent City Fire Station Administrative (E) , Crescent City Volunteer Fire Department (F) . Display/hide their locations on the map
Churches in Crescent City include: (A) , Lighthouse Fellowship Church (B) , First Baptist Church (C) , Crescent City United Methodist Church (D) , Church of the Nazarene (E) , The Church of Jesus Christ of Latter Day Saints (F) . Display/hide their locations on the map
Creek: (A) . Display/hide its location on the map
Parks in Crescent City include: (1) , Del Norte County Fairgrounds (2) , Beach Front Park (3) . Display/hide their locations on the map
Tourist attractions: (1) , Del Norte Reads (Cultural Attractions- Events- & Facilities; 1080 Mason Mall) (2) , Del Norte County Historical Society - Main Museum (Cultural Attractions- Events- & Facilities; 577 H Street) (3) , Chamber of Commerce-Crescent City-Del Norte County (1001 Front Street) (4) . Display/hide their approximate locations on the map
Hotels: (1) , Bayview Inn (310 Us Highway 101 South) (2) , Best Western Northwoods Inn (655 Hwy 101 S) (3) , Best Value Inn (440 US Highway 101 North) (4) . Display/hide their approximate locations on the map
Courts: (1) , Paradise Court (1100 US Highway 101 South) (2) , Crasher's Trailer Court (2051 Northcrest) (3) . Display/hide their approximate locations on the map
Birthplace of: Haley Cope - Swimmer and Olympic silver medalist., Rick Keene - Politician, Justin Miller (judge) - Federal judge, Fred Rinne - Contemporary artist, Lee Kohse - Artist.
Del Norte County has a predicted average indoor radon screening level less than 2 pCi/L (pico curies per liter) - Low Potential Drinking water stations with addresses in Crescent City and their reported violations in the past:
CRESCENT BEACH MOTEL (Population served: 70, Groundwater):
Past monitoring violations:
One routine major monitoring violation
Drinking water stations with addresses in Crescent City that have no violations reported:
JEDEDIAH SMITH STATE PARK (Population served: 2,202, Primary Water Source Type: Groundwater)
PATRICK'S POINT SP-STATE PARKS (Population served: 2,000, Primary Water Source Type: Surface water)
PRAIRIE CREEK SP-STATE PARKS (Population served: 1,615, Primary Water Source Type: Groundwater)
BERTSCH OCEAN VIEW CSD (Population served: 1,600, Primary Water Source Type: Purch groundwater)
DEL NORTE COAST STATE PARK (Population served: 1,042, Primary Water Source Type: Surface water)
GOLD BLUFFS BEACH CG-STATE PARKS (Population served: 1,020, Primary Water Source Type: Surface water)
BIG ROCK C.S.D. (Population served: 400, Primary Water Source Type: Groundwater)
STONE LAGOON-STATE PARKS (Population served: 400, Primary Water Source Type: Groundwater)
LAGOON CREEK-REDWOOD NP (Population served: 370, Primary Water Source Type: Groundwater)
BUTTE COURT MOBILE HOME PARK (Population served: 67, Primary Water Source Type: Groundwater)
Average household size: This city:
2.4 peopleCalifornia:
2.9 people
Percentage of family households: This city:
55.1%Whole state:
68.7%
Percentage of households with unmarried partners: This city:
10.4%Whole state:
7.2%
Likely homosexual households (counted as self-reported same-sex unmarried-partner households)
Lesbian couples: 0.2% of all households Gay men: 0.2% of all households
People in group quarters in Crescent City in 2010:
3,367 people in state prisons
99 people in local jails and other municipal confinement facilities
76 people in nursing facilities/skilled-nursing facilities
20 people in other noninstitutional facilities
10 people in correctional facilities intended for juveniles
8 people in residential treatment centers for adults
People in group quarters in Crescent City in 2000:
113 people in local jails and other confinement facilities (including police lockups)
83 people in nursing homes
10 people in unknown juvenile institutions
3 people in other nonhousehold living situations
2 people in homes or halfway houses for drug/alcohol abuse
2 people in other noninstitutional group quarters
Banks with branches in Crescent City (2011 data):
JPMorgan Chase Bank, National Association: 803 Third Street Branch at 803 Third Street, branch established on 1988/12/27. Info updated 2011/11/10: Bank assets: $1,811,678.0 mil, Deposits: $1,190,738.0 mil, headquarters in Columbus, OH, positive income , International Specialization, 5577 total offices , Holding Company: Jpmorgan Chase & Co.
Bank of America, National Association: Crescent City Branch at 240 H Street, branch established on 1927/02/19. Info updated 2009/11/18: Bank assets: $1,451,969.3 mil, Deposits: $1,077,176.8 mil, headquarters in Charlotte, NC, positive income , 5782 total offices , Holding Company: Bank Of America Corporation
Tri Counties Bank: Crescent City Branch at 936 Third Street, branch established on 1957/06/07. Info updated 2011/09/26: Bank assets: $2,554.4 mil, Deposits: $2,191.2 mil, headquarters in Chico, CA, positive income , Commercial Lending Specialization, 71 total offices , Holding Company: Trico Bancshares
U.S. Bank National Association: Crescent City Branch at 1020 Third Street, branch established on 1987/09/08. Info updated 2012/01/30: Bank assets: $330,470.8 mil, Deposits: $236,091.5 mil, headquarters in Cincinnati, OH, positive income , 3121 total offices , Holding Company: U.S. Bancorp
North Valley Bank: Crescent City Branch at 1492 Northcrest Drive, branch established on 1992/08/06. Info updated 2006/08/03: Bank assets: $900.5 mil, Deposits: $767.5 mil, headquarters in Redding, CA, positive income , Commercial Lending Specialization, 26 total offices , Holding Company: North Valley Bancorp
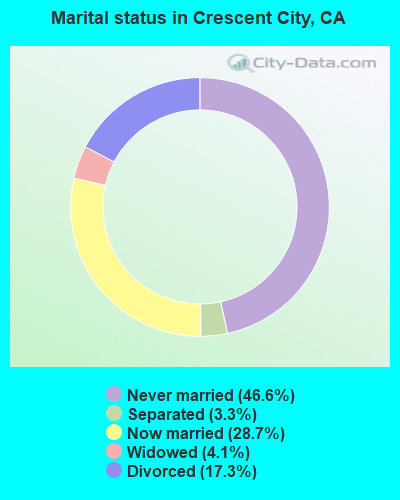
For population 15 years and over in Crescent City:
Never married: 46.6%Now married: 28.7%Separated: 3.3%Widowed: 4.1%Divorced: 17.3% For population 25 years and over in Crescent City:
High school or higher: 69.8%Bachelor's degree or higher: 15.6%Graduate or professional degree: 8.1%Unemployed: 13.2%Mean travel time to work (commute): 14.9 minutes
Education Gini index (Inequality in education) Here:
14.5California average:
15.5
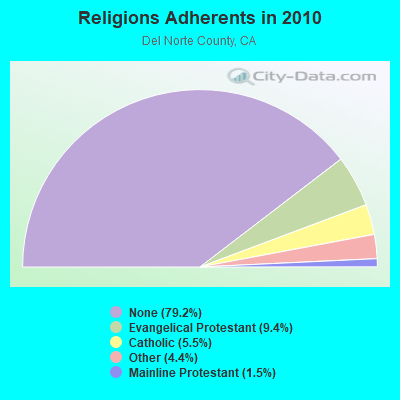
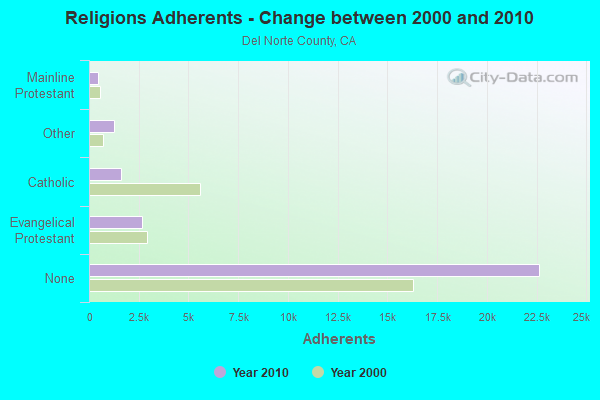
Religion statistics for Crescent City, CA (based on Del Norte County data)
Religion Adherents Congregations Evangelical Protestant 2,682 22 Catholic 1,585 1 Other 1,259 5 Mainline Protestant 436 4 None 22,648 -
Source: Clifford Grammich, Kirk Hadaway, Richard Houseal, Dale E.Jones, Alexei Krindatch, Richie Stanley and Richard H.Taylor. 2012. 2010 U.S.Religion Census: Religious Congregations & Membership Study. Association of Statisticians of American Religious Bodies. Jones, Dale E., et al. 2002. Congregations and Membership in the United States 2000. Nashville, TN: Glenmary Research Center. Graphs represent county-level data
Food Environment Statistics: Number of grocery stores : 9Del Norte County :
3.11 / 10,000 pop.State :
2.14 / 10,000 pop.
Number of convenience stores (no gas) : 1Here :
0.35 / 10,000 pop.California :
0.62 / 10,000 pop.
Number of convenience stores (with gas) : 7This county :
2.42 / 10,000 pop.State :
1.49 / 10,000 pop.
Number of full-service restaurants : 21Del Norte County :
7.26 / 10,000 pop.California :
7.42 / 10,000 pop.
Adult obesity rate : Del Norte County :
26.8%State :
21.3%
Low-income preschool obesity rate : This county :
16.3%California :
17.9%
Health and Nutrition: Healthy diet rate : Crescent City:
50.5%State:
49.4%
Average overall health of teeth and gums : Crescent City:
47.9%California:
48.0%
Average BMI : Crescent City:
28.1California:
28.1
People feeling badly about themselves : People not drinking alcohol at all : Crescent City:
10.9%California:
11.2%
Average hours sleeping at night : Overweight people : Crescent City:
31.9%California:
31.5%
General health condition : Crescent City:
56.8%State:
56.4%
Average condition of hearing : This city:
79.3%California:
80.9%
More about Health and Nutrition of Crescent City, CA Residents
Local government employment and payroll (March 2022)
Function
Full-time employees
Monthly full-time payroll
Average yearly full-time wage
Part-time employees
Monthly part-time payroll
Police Protection - Officers
15 $102,254 $81,803 0 $0 Financial Administration
11 $59,305 $64,696 0 $0 Water Supply
7 $37,000 $63,429 0 $0 Other Government Administration
7 $57,225 $98,100 7 $8,680 Streets and Highways
7 $32,573 $55,839 0 $0 Other and Unallocable
5 $24,127 $57,905 0 $0 Parks and Recreation
4 $19,016 $57,048 17 $14,314 Sewerage
4 $26,889 $80,667 1 $4,912 Housing and Community Development (Local)
4 $22,432 $67,296 1 $2,194 Police - Other
1 $4,472 $53,664 0 $0 Firefighters
1 $11,405 $136,860 0 $0
Totals for Government
66 $396,698 $72,127 26 $30,100
Crescent City government finances - Expenditure in 2017 (per resident):
Construction - Water Utilities: $289,000 ($48.30)
Housing and Community Development: $173,000 ($28.92)Current Operations - Housing and Community Development: $3,370,000 ($563.26)
Sewerage: $2,600,000 ($434.56)Water Utilities: $1,686,000 ($281.80)Police Protection: $1,646,000 ($275.11)Parks and Recreation: $913,000 ($152.60)Central Staff Services: $779,000 ($130.20)Regular Highways: $578,000 ($96.61)Local Fire Protection: $560,000 ($93.60)General - Other: $394,000 ($65.85)Protective Inspection and Regulation - Other: $155,000 ($25.91)Financial Administration: $87,000 ($14.54)Health - Other: $36,000 ($6.02)General - Interest on Debt: $1,743,000 ($291.33)
Other Capital Outlay - Local Fire Protection: $60,000 ($10.03)
Regular Highways: $51,000 ($8.52)Sewerage: $5,000 ($0.84)General - Other: $2,000 ($0.33)
Crescent City government finances - Revenue in 2017 (per resident):
Charges - Sewerage: $4,662,000 ($779.21)
Other: $734,000 ($122.68)Parks and Recreation: $231,000 ($38.61)Housing and Community Development: $7,000 ($1.17)Federal Intergovernmental - Other: $3,538,000 ($591.34)
Housing and Community Development: $360,000 ($60.17)Miscellaneous - General Revenue - Other: $272,000 ($45.46)
Donations From Private Sources: $63,000 ($10.53)Interest Earnings: $39,000 ($6.52)Rents: $28,000 ($4.68)Fines and Forfeits: $2,000 ($0.33)Revenue - Water Utilities: $2,611,000 ($436.40)
State Intergovernmental - Other: $702,000 ($117.33)
Sewerage: $285,000 ($47.63)Highways: $144,000 ($24.07)Water Utilities: $20,000 ($3.34)General Local Government Support: $3,000 ($0.50)Tax - Other Selective Sales: $1,392,000 ($232.66)
General Sales and Gross Receipts: $1,349,000 ($225.47)Property: $735,000 ($122.85)Public Utilities Sales: $228,000 ($38.11)Other License: $75,000 ($12.54)Occupation and Business License - Other: $50,000 ($8.36)Documentary and Stock Transfer: $10,000 ($1.67)
Crescent City government finances - Debt in 2017 (per resident):
Long Term Debt - Beginning Outstanding - Unspecified Public Purpose: $43,578,000 ($7283.64)
Outstanding Unspecified Public Purpose: $42,028,000 ($7024.57)Retired Unspecified Public Purpose: $1,550,000 ($259.07)
Crescent City government finances - Cash and Securities in 2017 (per resident):
Bond Funds - Cash and Securities: $148,000 ($24.74)
Other Funds - Cash and Securities: $9,925,000 ($1658.87)
Businesses in Crescent City, CA
Name Count Name Count
Ace Hardware 1 Payless 1 Best Western 1 Quality 1 Burger King 1 RadioShack 1 Dennys 1 Rite Aid 1 Econo Lodge 1 Starbucks 1 FedEx 3 Super 8 1 GNC 1 Travelodge 1 H&R Block 1 True Value 1 Home Depot 1 U-Haul 2 Jones New York 1 UPS 4 KFC 1 Vans 1 MasterBrand Cabinets 5 Vons 1 McDonald's 1 Walmart 1
Strongest AM radio stations in Crescent City:
KPOD (1240 AM; 1 kW; CRESCENT CITY, CA; Owner: KPOD, L L C)
KFVR (1310 AM; 1 kW; CRESCENT CITY, CA)
KGRV (700 AM; 25 kW; WINSTON, OR; Owner: PACIFIC CASCADE COMMUNICATIONS CORP.)
KURY (910 AM; 1 kW; BROOKINGS, OR; Owner: KURY RADIO, INC.)
KDUN (1030 AM; 50 kW; REEDSPORT, OR; Owner: PAMPLIN BROADCASTING-OREGON, INC.)
KAPL (1300 AM; 20 kW; PHOENIX, OR; Owner: APPLEGATE MEDIA, INC.)
KTMT (580 AM; 10 kW; ASHLAND, OR; Owner: MAPLETON COMMUNICATIONS, LLC)
KAJO (1270 AM; 10 kW; GRANTS PASS, OR; Owner: GRANTS PASS BROADCASTING CORPORATION)
KPNW (1120 AM; 50 kW; EUGENE, OR; Owner: CAPSTAR TX LIMITED PARTNERSHIP)
KWSW (790 AM; 5 kW; EUREKA, CA; Owner: EUREKA BROADCASTING CO., INC.)
KNCR (1090 AM; daytime; 10 kW; FORTUNA, CA; Owner: MILLER BROADCASTING COMPANY, INC.)
KAGI (930 AM; 5 kW; GRANTS PASS, OR; Owner: SOUTHERN OREGON STATE COLLEGE)
KINS (980 AM; 5 kW; EUREKA, CA; Owner: EUREKA BROADCASTING CO.)
Strongest FM radio stations in Crescent City:
KPOD-FM (97.9 FM; CRESCENT CITY, CA; Owner: KPOD, L L C)
K204CL (88.7 FM; SMITH RIVER, CA; Owner: FAMILY STATIONS, INC.)
KURY-FM (95.3 FM; BROOKINGS, OR; Owner: KURY RADIO, INC.)
KHSR (91.9 FM; CRESCENT CITY, CA; Owner: HUMBOLDT STATE UNIVERSITY KHSU-FM)
K216EC (91.1 FM; HAPPY CAMP, CA; Owner: CALVARY CHAPEL OF TWIN FALLS, INC.)
KCRE-FM (94.3 FM; CRESCENT CITY, CA; Owner: KPOD, L.L.C.)
KCNA (102.7 FM; CAVE JUNCTION, OR; Owner: OPUS BROADCASTING SYSTEMS, INC.)
K280BK (91.7 FM; SELMA, OR; Owner: CALVARY CHAPEL OF TWIN FALLS, INC.)
K218DP (91.5 FM; CAVE JUNCTION, OR; Owner: CALVARY CHAPEL OF TWIN FALLS, INC.)
K267AD (101.3 FM; CAVE JUNCTION, ETC., OR; Owner: STEVEN R. PORTER)
K283AE (104.5 FM; CAVE JUNCTION, OR; Owner: GRANTS PASS BROADCASTING CORPORATION)
K203CI (88.5 FM; CAVE JUNCTION, OR; Owner: FAMILY STATIONS, INC.)
K208CC (89.5 FM; CAVE JUNCTION, OR; Owner: SOUTHERN OREGON UNIVERSITY)
KLDZ (103.5 FM; MEDFORD, OR; Owner: CITICASTERS LICENSES, L.P.)
K249BS (97.7 FM; GRANTS PASS, OR; Owner: CALVARY CHAPEL OF TWIN FALLS, INC.)
K259AL (99.7 FM; WILLOW CREEK, CA; Owner: KHSU-FM, HUMBOLDT STATE UNIVERSITY)
KAKT (105.1 FM; PHOENIX, OR; Owner: MAPLETON COMMUNICATIONS, LLC)
KTMT-FM (93.7 FM; MEDFORD, OR; Owner: MAPLETON COMMUNICATIONS, LLC)
K292EV (106.3 FM; BROOKINGS, OR; Owner: CURRY CTY COMMITTEE FOR CHRSTN RADIO)
KROG (96.9 FM; GRANTS PASS, OR; Owner: OPUS BROADCASTING SYSTEMS, INC.)
TV broadcast stations around Crescent City:
K09VQ (Channel 9; CRESCENT CITY, CA; Owner: REDWOOD EMPIRE PUBLIC TELEVISION, INC.)
K39EO (Channel 39; CRESCENT CITY, ETC., CA; Owner: THREE ANGELS BROADCASTING NETWORK, INC.)
K22DS (Channel 22; CRESCENT CITY, ETC., CA; Owner: CALIFORNIA OREGON BROADCASTING, INC.)
National Bridge Inventory (NBI) Statistics 5 Number of bridges72ft / 21.7m Total length84,980 Total average daily traffic6,213 Total average daily truck traffic
Fire-safe hotels and motels in Crescent City, California:
Econo Lodge, 725 Us Hwy 101 N, Crescent City, California 95531 Phone: (707) 464-6106, Fax: (707) 464-2781
Americas Best Value Inn, 440 Hwy 101, Crescent City, California 95531 Phone: (707) 464-4141, Fax: (707) 465-3274
Anchor Beach Inn, 880 Hwy 101 S, Crescent City, California 95531 Phone: (800) 837-4116
Ocean View Inn & Suites, 270 Hwy 101 S, Crescent city, California 95531 Phone: (707) 465-1111
All 4 fire-safe hotels and motels in Crescent City, California
Most common first names in Crescent City, CA among deceased individuals Name Count Lived (average)
John 136 72.4 years William 128 73.9 years Robert 122 71.4 years James 101 70.6 years Charles 83 75.2 years Mary 79 77.4 years George 75 74.3 years Helen 49 80.6 years Dorothy 48 76.9 years Margaret 48 81.6 years
Most common last names in Crescent City, CA among deceased individuals Last name Count Lived (average)
Smith 57 71.6 years Brown 49 75.1 years Johnson 45 73.3 years Miller 42 76.9 years Jones 36 72.4 years Wilson 30 70.0 years Anderson 29 75.5 years Moore 28 71.5 years Williams 25 76.4 years Thompson 23 75.2 years
Crescent City compared to California state average:
Median household income significantly below state average. Median house value significantly below state average. Black race population percentage above state average. Foreign-born population percentage below state average. Renting percentage above state average. Length of stay since moving in significantly above state average. Institutionalized population percentage significantly above state average. Percentage of population with a bachelor's degree or higher below state average. Crescent City on our top lists :
#1 on the list of "Top 101 cities with largest percentage of females in occupations: community and social service occupations (population 5,000+)"
#22 on the list of "Top 101 cities with the most residents born in Other Australian and New Zealand Subregion (population 500+)"
#57 on the list of "Top 101 cities with the most users submitting photos to our site per 10,000 residents (population 5,000+)"
#58 on the list of "Top 101 cities with largest percentage of males in occupations: food preparation and serving related occupations (population 5,000+)"
#67 on the list of "Top 101 cities with the most residents born in Australia and New Zealand Subregion (population 500+)"
#70 on the list of "Top 101 cities with largest percentage of females in industries: public administration (population 5,000+)"
#80 on the list of "Top 101 cities with the largest positive percentage difference between never married males and females (15+ years) (with at least 1,000 males never married)"
#83 on the list of "Top 101 cities with largest percentage of females in industries: other services, except public administration (population 5,000+)"
#85 on the list of "Top 101 cities with largest percentage of females in occupations: law enforcement workers including supervisors (population 5,000+)"
#96 on the list of "Top 100 cities with the largest percentage of males"
#62 on the list of "Top 101 counties with highest percentage of residents voting for 3rd party candidates in the 2012 Presidential Election"
Top Patent Applicants
Ellery West (18)
Gail West (17)
Dominique Tomlinson (1)
Carl Lanum (1)
Ray D. Solbau (1)
Total of 21 patent applications in 2008-2024.


 Recent articles from our blog. Our writers, many of them Ph.D. graduates or candidates, create easy-to-read articles on a wide variety of topics.

 (79.5 miles
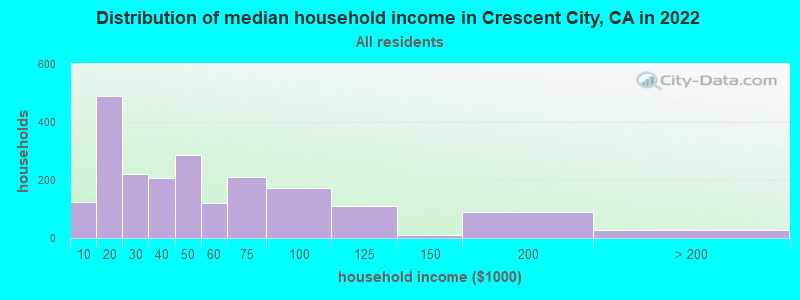


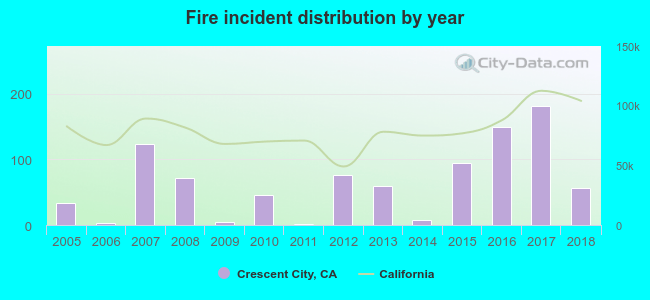 Based on the data from the years 2005 - 2018 the average number of fires per year is 65. The highest number of fires - 182 took place in 2017, and the least - 1 in 2011. The data has a growing trend.
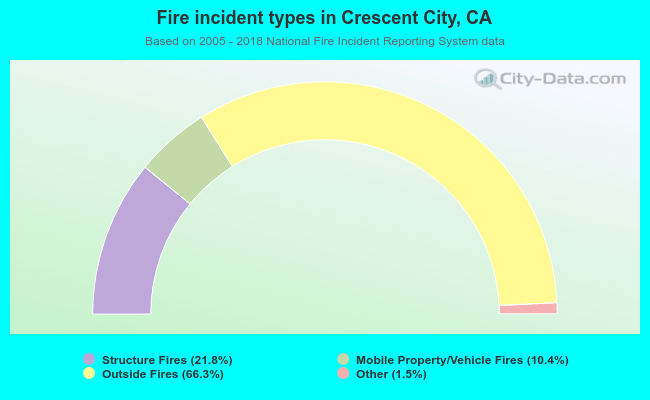 When looking into fire subcategories, the most reports belonged to: Outside Fires (66.3%), and Structure Fires (21.8%).