Estimated zip code population in 2022: 30,957 Zip code population in 2010: 29,269 Zip code population in 2000: 24,183
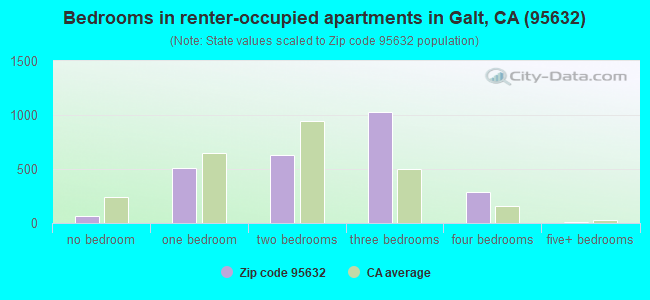
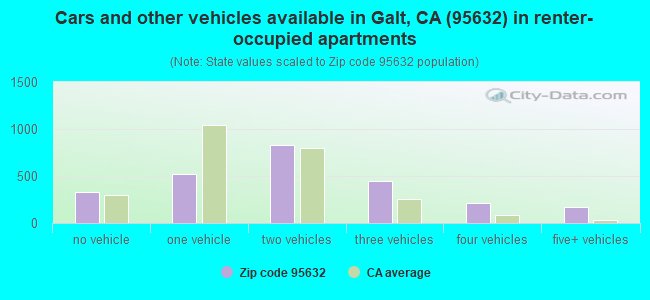
Houses and condos: 10,680 Renter-occupied apartments: 2,536
% of renters here:
25%
State:
44%
March 2022 cost of living index in zip code 95632: 100.8 (near average, U.S. average is 100)
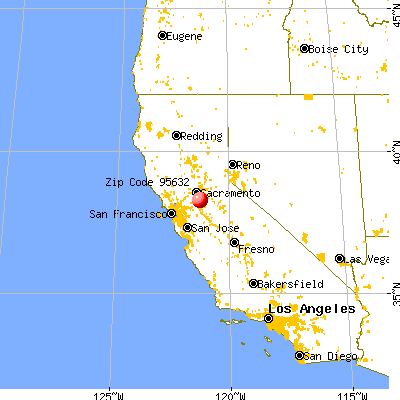
Land area: 110.8 sq. mi. Water area: 0.5 sq. mi.
Population density: 279 people per square mile
(very low).
OSM Map
General Map
Google Map
MSN Map
OSM Map
General Map
Google Map
MSN Map
OSM Map
General Map
Google Map
MSN Map
OSM Map
General Map
Google Map
MSN Map
Please wait while loading the map...
Real estate property taxes paid for housing units in 2022:
This zip code:
0.7% ($3,647)
California:
0.7% ($4,831)
Median real estate property taxes paid for housing units with mortgages in 2022: $3,874 (0.7%) Median real estate property taxes paid for housing units with no mortgage in 2022: $3,018 (0.6%)
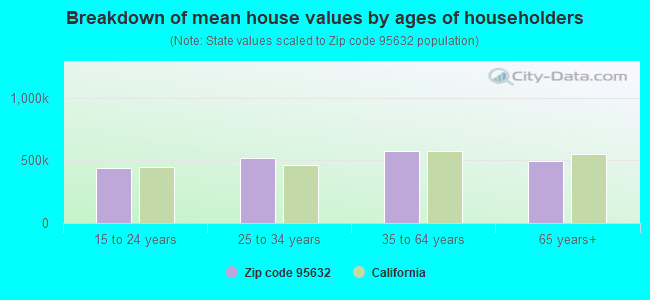
Estimated median house/condo value in 2022: $506,223
95632:
$506,223
California:
$715,900
According to our research of California and other state lists, there were 33 registered sex offenders living in 95632 zip code as of April 27, 2024. The ratio of all residents to sex offenders in zip code 95632 is 940 to 1. The ratio of registered sex offenders to all residents in this zip code is lower than the state average.
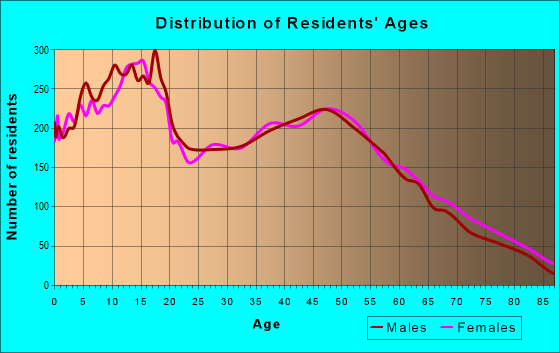
Median resident age:
This zip code:
39.6 years
California median age:
37.9 years
Average household size:
This zip code:
3.0 people
California:
2.8 people
Averages for the 2020 tax year for zip code 95632, filed in 2021:
Average Adjusted Gross Income (AGI) in 2020: $66,759 (Individual Income Tax Returns)
Here:
$66,759
State:
$95,910
Salary/wage: $60,527 (reported on 83.5% of returns)
Here:
$60,527
State:
$77,331
(% of AGI for various income ranges: 1311.3% for AGIs below $25k, 4002.1% for AGIs $25k-50k, 7325.8% for AGIs $50k-75k, 10407.2% for AGIs $75k-100k, 19412.0% for AGIs $100k-200k, 64630.0% for AGIs over 200k)
Taxable interest for individuals: $633 (reported on 37.8% of returns)
This zip code:
$633
California:
$2,294
(% of AGI for various income ranges: 11.8% for AGIs below $25k, 13.2% for AGIs $25k-50k, 35.1% for AGIs $50k-75k, 54.5% for AGIs $75k-100k, 68.8% for AGIs $100k-200k, 471.9% for AGIs over 200k)
Ordinary dividends: $3,403 (reported on 11.7% of returns)
Here:
$3,403
State:
$10,949
(% of AGI for various income ranges: 18.1% for AGIs below $25k, 22.6% for AGIs $25k-50k, 42.0% for AGIs $50k-75k, 58.9% for AGIs $75k-100k, 101.0% for AGIs $100k-200k, 1294.4% for AGIs over 200k)
Net capital gain/loss in AGI: +$15,384 (reported on 10.9% of returns)
Here:
+$15,384
State:
+$49,306
(% of AGI for various income ranges: 7.7% for AGIs below $25k, 22.0% for AGIs $25k-50k, 51.9% for AGIs $50k-75k, 86.5% for AGIs $75k-100k, 297.4% for AGIs $100k-200k, 11187.5% for AGIs over 200k)
Profit/loss from business: +$11,556 (reported on 13.0% of returns)
Here:
+$11,556
State:
+$15,671
(% of AGI for various income ranges: 101.0% for AGIs below $25k, 171.9% for AGIs $25k-50k, 142.2% for AGIs $50k-75k, 281.8% for AGIs $75k-100k, 458.7% for AGIs $100k-200k, 2005.0% for AGIs over 200k)
Taxable individual retirement arrangement distribution: $16,026 (reported on 5.8% of returns)
95632:
$16,026
California:
$23,505
(% of AGI for various income ranges: 41.7% for AGIs below $25k, 65.3% for AGIs $25k-50k, 132.3% for AGIs $50k-75k, 210.7% for AGIs $75k-100k, 350.6% for AGIs $100k-200k, 900.6% for AGIs over 200k)
Self-employed (Keogh) retirement plans: $14,025 (reported on 0.3% of returns)
95632:
$14,025
California:
$30,163
(% of AGI for various income ranges: 37.7% for AGIs $100k-200k)
Total itemized deductions: $29,528 (reported on 13.1% of returns)
Here:
$29,528
State:
$39,517
(% of AGI for various income ranges: 65.2% for AGIs below $25k, 144.1% for AGIs $25k-50k, 431.5% for AGIs $50k-75k, 820.0% for AGIs $75k-100k, 1747.9% for AGIs $100k-200k, 6801.2% for AGIs over 200k)
Charity contributions: $5,374 (reported on 10.6% of returns)
Here:
$5,374
State:
$12,598
(% of AGI for various income ranges: 3.4% for AGIs below $25k, 13.8% for AGIs $25k-50k, 44.3% for AGIs $50k-75k, 88.9% for AGIs $75k-100k, 299.0% for AGIs $100k-200k, 1191.2% for AGIs over 200k)
Taxes paid: $8,519 (reported on 13.1% of returns)
95632:
$8,519
State:
$8,807
(% of AGI for various income ranges: 11.6% for AGIs below $25k, 32.8% for AGIs $25k-50k, 121.7% for AGIs $50k-75k, 271.9% for AGIs $75k-100k, 556.8% for AGIs $100k-200k, 1481.2% for AGIs over 200k)
Earned income credit: $2,083 (reported on 13.3% of returns)
Here:
$2,083
State:
$2,074
(% of AGI for various income ranges: 82.9% for AGIs below $25k, 70.4% for AGIs $25k-50k, 1.8% for AGIs $50k-75k)
Percentage of individuals using paid preparers for their 2020 taxes: 92.6%
Here:
93%
State:
92%
(% for various income ranges: 91.6% for AGIs below $25k, 92.6% for AGIs $25k-50k, 91.3% for AGIs $50k-75k, 93.8% for AGIs $75k-100k, 94.0% for AGIs $100k-200k, 94.2% for AGIs over 200k)
Averages for the 2012 tax year for zip code 95632, filed in 2013:
Average Adjusted Gross Income (AGI) in 2012: $50,849 (Individual Income Tax Returns)
Here:
$50,849
State:
$72,726
Salary/wage: $46,529 (reported on 85.2% of returns)
Here:
$46,529
State:
$59,079
(% of AGI for various income ranges: 73.0% for AGIs below $25k, 78.6% for AGIs $25k-50k, 80.6% for AGIs $50k-75k, 79.3% for AGIs $75k-100k, 80.8% for AGIs $100k-200k, 58.0% for AGIs over 200k)
Taxable interest for individuals: $712 (reported on 37.3% of returns)
This zip code:
$712
California:
$2,146
(% of AGI for various income ranges: 0.7% for AGIs below $25k, 0.5% for AGIs $25k-50k, 0.5% for AGIs $50k-75k, 0.6% for AGIs $75k-100k, 0.3% for AGIs $100k-200k, 0.7% for AGIs over 200k)
Ordinary dividends: $2,168 (reported on 11.9% of returns)
Here:
$2,168
State:
$9,308
(% of AGI for various income ranges: 0.7% for AGIs below $25k, 0.5% for AGIs $25k-50k, 0.4% for AGIs $50k-75k, 0.4% for AGIs $75k-100k, 0.5% for AGIs $100k-200k, 1.1% for AGIs over 200k)
Net capital gain/loss in AGI: +$3,720 (reported on 9.2% of returns)
Here:
+$3,720
State:
+$30,460
(% of AGI for various income ranges: 0.2% for AGIs $25k-50k, 0.2% for AGIs $50k-75k, 0.3% for AGIs $75k-100k, 0.6% for AGIs $100k-200k, 6.4% for AGIs over 200k)
Profit/loss from business: +$13,039 (reported on 13.2% of returns)
Here:
+$13,039
State:
+$17,064
(% of AGI for various income ranges: 7.7% for AGIs below $25k, 4.0% for AGIs $25k-50k, 2.6% for AGIs $50k-75k, 1.9% for AGIs $75k-100k, 2.7% for AGIs $100k-200k, 5.4% for AGIs over 200k)
Taxable individual retirement arrangement distribution: $14,366 (reported on 6.6% of returns)
95632:
$14,366
California:
$19,557
(% of AGI for various income ranges: 2.1% for AGIs below $25k, 1.9% for AGIs $25k-50k, 1.9% for AGIs $50k-75k, 1.8% for AGIs $75k-100k, 2.2% for AGIs $100k-200k)
Self-employment retirement plans: $14,800 (reported on 0.3% of returns)
95632:
$14,800
California:
$24,530
Total itemized deductions: $22,225 (26% of AGI, reported on 36.6% of returns)
Here:
$22,225
State:
$34,004
Here:
25.9% of AGI
State:
22.7% of AGI
(% of AGI for various income ranges: 8.2% for AGIs below $25k, 12.4% for AGIs $25k-50k, 16.4% for AGIs $50k-75k, 17.5% for AGIs $75k-100k, 19.3% for AGIs $100k-200k, 16.2% for AGIs over 200k)
Charity contributions: $2,516 (reported on 30.3% of returns)
Here:
$2,516
State:
$4,659
(% of AGI for various income ranges: 0.5% for AGIs below $25k, 0.9% for AGIs $25k-50k, 1.5% for AGIs $50k-75k, 1.6% for AGIs $75k-100k, 2.1% for AGIs $100k-200k, 1.7% for AGIs over 200k)
Taxes paid: $6,953 (reported on 36.6% of returns)
95632:
$6,953
State:
$14,448
(% of AGI for various income ranges: 1.6% for AGIs below $25k, 2.8% for AGIs $25k-50k, 4.4% for AGIs $50k-75k, 5.3% for AGIs $75k-100k, 6.9% for AGIs $100k-200k, 8.0% for AGIs over 200k)
Earned income credit: $2,372 (reported on 19.7% of returns)
Here:
$2,372
State:
$2,286
(% of AGI for various income ranges: 6.9% for AGIs below $25k, 1.6% for AGIs $25k-50k)
Percentage of individuals using paid preparers for their 2012 taxes: 58.1%
Here:
58%
State:
64%
(% for various income ranges: 53.0% for AGIs below $25k, 58.1% for AGIs $25k-50k, 61.6% for AGIs $50k-75k, 63.9% for AGIs $75k-100k, 63.1% for AGIs $100k-200k, 69.2% for AGIs over 200k)
Averages for the 2004 tax year for zip code 95632, filed in 2005:
Average Adjusted Gross Income (AGI) in 2004: $45,426 (Individual Income Tax Returns)
Here:
$45,426
State:
$58,600
Salary/wage: $42,652 (reported on 86.9% of returns)
Here:
$42,652
State:
$49,455
(% of AGI for various income ranges: 213.0% for AGIs below $10k, 76.9% for AGIs $10k-25k, 83.6% for AGIs $25k-50k, 85.1% for AGIs $50k-75k, 86.2% for AGIs $75k-100k, 72.0% for AGIs over 100k)
Taxable interest for individuals: $1,014 (reported on 48.7% of returns)
This zip code:
$1,014
California:
$2,365
(% of AGI for various income ranges: 11.1% for AGIs below $10k, 2.0% for AGIs $10k-25k, 0.9% for AGIs $25k-50k, 0.8% for AGIs $50k-75k, 0.6% for AGIs $75k-100k, 1.2% for AGIs over 100k)
Taxable dividends: $1,451 (reported on 15.1% of returns)
Here:
$1,451
State:
$4,746
(% of AGI for various income ranges: 6.2% for AGIs below $10k, 0.8% for AGIs $10k-25k, 0.4% for AGIs $25k-50k, 0.3% for AGIs $50k-75k, 0.2% for AGIs $75k-100k, 0.6% for AGIs over 100k)
Net capital gain/loss: +$10,303 (reported on 12.2% of returns)
Here:
+$10,303
State:
+$23,418
(% of AGI for various income ranges: 9.1% for AGIs below $10k, 0.4% for AGIs $10k-25k, 0.4% for AGIs $25k-50k, 0.4% for AGIs $50k-75k, 0.6% for AGIs $75k-100k, 8.6% for AGIs over 100k)
Profit/loss from business: +$12,339 (reported on 14.0% of returns)
Here:
+$12,339
State:
+$16,826
(% of AGI for various income ranges: 7.1% for AGIs below $10k, 5.1% for AGIs $10k-25k, 3.8% for AGIs $25k-50k, 3.2% for AGIs $50k-75k, 3.1% for AGIs $75k-100k, 4.4% for AGIs over 100k)
IRA payment deduction: $2,985 (reported on 1.8% of returns)
95632:
$2,985
California:
$3,192
(% of AGI for various income ranges: 0.2% for AGIs $10k-25k, 0.2% for AGIs $25k-50k, 0.1% for AGIs $50k-75k, 0.1% for AGIs $75k-100k, 0.1% for AGIs over 100k)
Self-employed pension: $10,642 (reported on 0.5% of returns)
Here:
$10,642
California:
$17,688
Total itemized deductions: $23,833 (33% of AGI, reported on 45.8% of returns)
Here:
$23,833
State:
$28,113
Here:
33.2% of AGI
State:
25.3% of AGI
(% of AGI for various income ranges: 36.4% for AGIs below $10k, 13.2% for AGIs $10k-25k, 20.6% for AGIs $25k-50k, 36.1% for AGIs $50k-75k, 23.3% for AGIs $75k-100k, 20.1% for AGIs over 100k)
Charity contributions deductions: $2,264 (3% of AGI, reported on 39.8% of returns)
Here:
$2,264
State:
$3,923
Here:
3.0% of AGI
State:
3.3% of AGI
(% of AGI for various income ranges: 1.7% for AGIs below $10k, 1.0% for AGIs $10k-25k, 1.5% for AGIs $25k-50k, 2.2% for AGIs $50k-75k, 2.2% for AGIs $75k-100k, 2.4% for AGIs over 100k)
Total tax: $5,416 (reported on 72.6% of returns)
95632:
$5,416
State:
$10,761
(% of AGI for various income ranges: 6.6% for AGIs below $10k, 3.5% for AGIs $10k-25k, 5.3% for AGIs $25k-50k, 6.9% for AGIs $50k-75k, 8.7% for AGIs $75k-100k, 14.2% for AGIs over 100k)
Earned income credit: $1,718 (reported on 15.5% of returns)
Here:
$1,718
State:
$1,763
Percentage of individuals using paid preparers for their 2004 taxes: 63.2%
Here:
63%
State:
66%
(% for various income ranges: 50.8% for AGIs below $10k, 60.6% for AGIs $10k-25k, 66.8% for AGIs $25k-50k, 67.3% for AGIs $50k-75k, 66.7% for AGIs $75k-100k, 69.8% for AGIs over 100k)
Likely homosexual households (counted as self-reported same-sex unmarried-partner households)
Lesbian couples: 0.1% of all households
Gay men: 0.1% of all households
Household received Food Stamps/SNAP in the past 12 months: 1,080 Household did not receive Food Stamps/SNAP in the past 12 months: 9,050
Women who had a birth in the past 12 months: 189 (150 now married, 38 unmarried) Women who did not have a birth in the past 12 months: 6,534 (3,331 now married, 3,172 unmarried)
Housing units in zip code 95632 with a mortgage: 5,179 (399 second mortgage, 61 home equity loan, 273 both second mortgage and home equity loan) Houses without a mortgage: 62
Median monthly owner costs for units with a mortgage: $2,099 Median monthly owner costs for units without a mortgage: $707
Residents with income below the poverty level in 2022:
This zip code:
7.4%
Whole state:
12.2%
Residents with income below 50% of the poverty level in 2022:
This zip code:
3.3%
Whole state:
6.2%
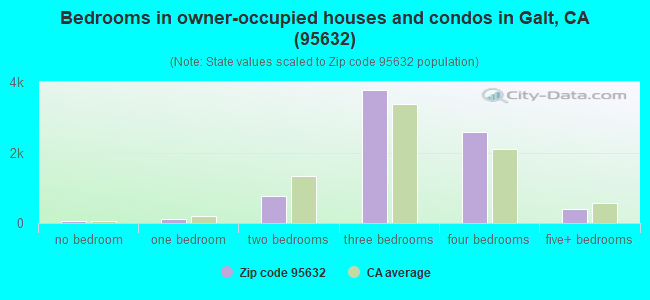
Median number of rooms in houses and condos:
Here:
6.0
State:
6.0
Median number of rooms in apartments:
Here:
4.6
State:
3.9
Notable locations in this zip code not listed on our city pages
Notable locations in zip code 95632: Dry Creek Ranch Golf Course (A), Seifert Dairy Farm (B), Van Warmerdam Dairy (C), Bottimore Ranch (D), Galt Neighborhood Library (E), Cosumnes Community Services District Fire Department Station 46 (F), Sacramento Metro Fire Station Number 45 (G), Rae House Museum (H), Galt Police Station (I), Cosumnes Community Services District Fire Department Station 45 (J), Galt City Hall (K). Display/hide their locations on the map
Streams, rivers, and creeks: Coyote Creek (A), Dry Creek (B), Goose Creek (C), Willow Creek (D), Laguna (E), Cosumnes River (F), Skunk Creek (G), Badger Creek (H). Display/hide their locations on the map
Parks in zip code 95632 include: Canyon Creek Park (1), Chabolla Park (2), Emerald Vista Park (3), Harvey Park (4), Lake Canyon Park (5), Meadow View Park (6), Oak Park (7), Smud Park (8). Display/hide their locations on the map
4,753 married couples with children.
1,265 single-parent households (412 men, 853 women).
65.4% of residents of 95632 zip code speak English at home.
29.9% of residents speak Spanish at home (57% very well, 23% well, 14% not well, 6% not at all).
2.6% of residents speak other Indo-European language at home (71% very well, 19% well, 11% not well).
1.7% of residents speak Asian or Pacific Island language at home (64% very well, 24% well, 2% not well, 9% not at all).
0.1% of residents speak other language at home (100% well).
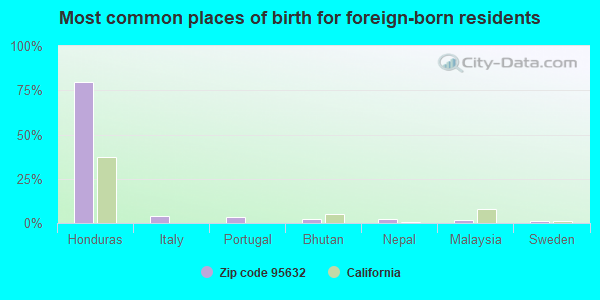
Foreign born population: 5,544 (17.9%) (57.4% of them are naturalized citizens)
This zip code:
17.9%
Whole state:
26.7%
80%Honduras
4%Italy
3%Portugal
2%Bhutan
2%Nepal
2%Malaysia
1%Sweden
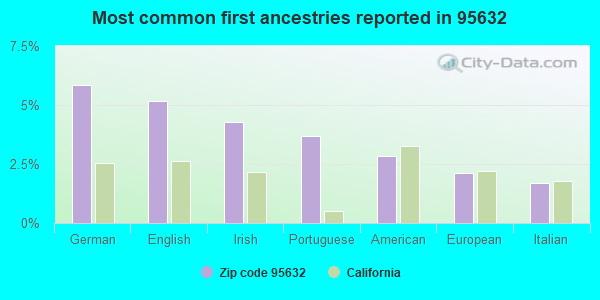
6%German
5%English
4%Irish
4%Portuguese
3%American
2%European
2%Italian
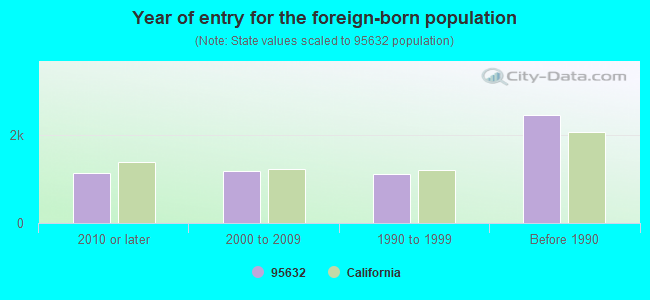
Year of entry for the foreign-born population
1,1322010 or later
1,1712000 to 2009
1,1121990 to 1999
2,442Before 1990
Major facilities with environmental interests located in this zip code:
GALT CLEANERS (825 C ST in GALT, CA)
STATE MASTER (California - Hazardous Waste Tracking) - HAZARDOU WASTE PROGRAM CRITERIA AND HAZARDOUS AIR POLLUTANT INVENTORY (Inventory of air pollution sources) Small Quantity Generators, between 100 kg and 1000 kg of hazardous waste/month (Resource Conservation and Recovery Act (tracking hazardous waste)) Business SIC classification: DRYCLEANING PLANTS, EXCEPT RUG CLEANING Alternative names: D & L CLEANERS
LONGS DRUG STORE NO 491 (1063 C ST in GALT, CA)
STATE MASTER (California - Hazardous Waste Tracking) - HAZARDOU WASTE PROGRAM Small Quantity Generators, between 100 kg and 1000 kg of hazardous waste/month (Resource Conservation and Recovery Act (tracking hazardous waste)) - notification Organizations: LONGS DRUG STORES CAL (CONTACT/OWNER)
, THRIFTY - PAYLESS (CONTACT/OWNER)
Alternative names: LONGS DRUG STORE #491
ESTRELLITA CONTINUATION HIGH (117 CAMELLIA WAY in GALT, CA)
(National Center for Education Statistics) - STATE ID-3432903 Organizations: GALT JOINT UNION HIGH (SCHOOL DISTRICT)
FAIRSITE ELEMENTARY (902 CAROLINE ST. in GALT, CA)
(National Center for Education Statistics) - STATE ID-6033294 Organizations: GALT JOINT UNION ELEMENTARY (SCHOOL DISTRICT)
GALT HIGH (145 N. LINCOLN WAY in GALT, CA)
(National Center for Education Statistics) - STATE ID-3433471 Organizations: GALT JOINT UNION HIGH (SCHOOL DISTRICT)
GREER (VERNON E.) MIDDLE (248 W. A ST. in GALT, CA)
(National Center for Education Statistics) - STATE ID-6033302 Organizations: GALT JOINT UNION ELEMENTARY (SCHOOL DISTRICT)
MARENGO RANCH ELEMENTARY (1000 ELK HILLS DR. in GALT, CA)
(National Center for Education Statistics) - STATE ID-6114185 Organizations: GALT JOINT UNION ELEMENTARY (SCHOOL DISTRICT)
GALT SD (495 INDUSTRIAL DRIVE in GALT, CA)
(Integrated Compliance Information System) - ICIS-09-2004-0156, FORMAL ENFORCEMENT ACTION Alternative names: CITY OF GALT
ACE OIL CO (323 A ST in GALT, CA)
Small Quantity Generators, between 100 kg and 1000 kg of hazardous waste/month (Resource Conservation and Recovery Act (tracking hazardous waste)) Organizations: JOHN R CROOKS (CONTACT/OWNER)
GALT COMMERCIAL TIRE (950 GLENDALE AVE in GALT, CA)
Small Quantity Generators, between 100 kg and 1000 kg of hazardous waste/month (Resource Conservation and Recovery Act (tracking hazardous waste)) - notification Business NAICS classification: TIRE RETREADING. Organizations: ALFRED E BROWN (CONTACT/OWNER)
GALT JOINT UNION ELEMENTARY SD (21 "C" ST in GALT, CA)
COMPLIANCE ACTIVITY (Tracking inspections of insecticide, fungicide, and rodenticide, and toxic substances)
GALT SD (11059 TWIN CITIES ROAD in GALT, CA)
National Pollutant Discharge Elimination System MAJOR (Tracking pollutant discharge elimination systems) - permit Business SIC classification: SEWERAGE SYSTEMS Organizations: GALT, CITY OF (CONTACT/OWNER)
Alternative names: GALT, CITY OF
AQUA BLUE (460 INDUSTRIAL DR in GALT, CA)
COMPLIANCE ACTIVITY (Tracking inspections of insecticide, fungicide, and rodenticide, and toxic substances)
Housing units lacking complete plumbing facilities: 0.3% Housing units lacking complete kitchen facilities: 0.6%
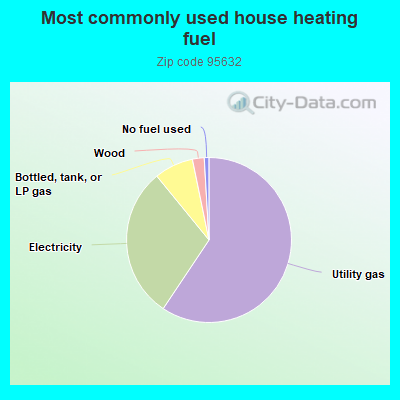
58.9%Utility gas
29.5%Electricity
7.6%Bottled, tank, or LP gas
2.3%Wood
0.9%No fuel used
Population in 1990: 14,173. Population change in the 1990s: +10,010 (+70.6%).
Place of birth for U.S.-born residents:
This state: 21,168
Northeast: 729
Midwest: 1,147
South: 746
West: 1,263
54% of the 95632 zip code residents lived in the same house 5 years ago. Out of people who lived in different houses, 49% lived in this county. Out of people who lived in different counties, 50% lived in California.
93% of the 95632 zip code residents lived in the same house 1 year ago. Out of people who lived in different houses, 58% moved from this county. Out of people who lived in different houses, 33% moved from different county within same state. Out of people who lived in different houses, 12% moved from different state.
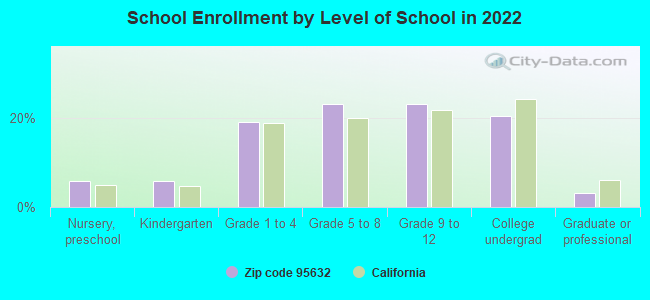
Private vs. public school enrollment:
Students in private schools in grades 1 to 8 (elementary and middle school): 214
Here:
6.7%
California:
10.5%
Students in private schools in grades 9 to 12 (high school): 137
Here:
7.8%
California:
8.5%
Students in private undergraduate colleges: 183
Here:
11.8%
California:
15.9%
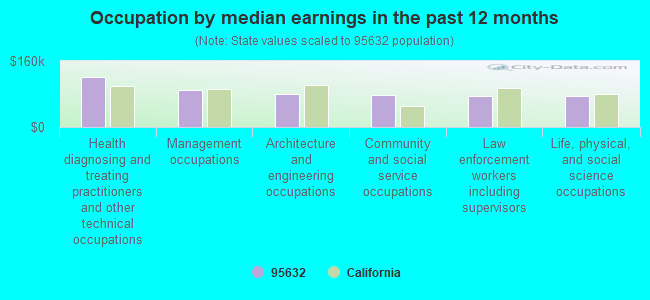
Occupation by median earnings in the past 12 months ($)
121,033Health diagnosing and treating practitioners and other technical occupations
89,288Management occupations
80,343Architecture and engineering occupations
78,648Community and social service occupations
74,688Law enforcement workers including supervisors
73,986Life, physical, and social science occupations
Companies with federal contracts located in this zip code:
AQUA TECH ENTERPRISES, INC (520 N LINCOLN WAY BLDG 2 in GALT, CA; small business) : $119,670 in 6 contractsfrom 2002 to 2005
Contracts for Water Distillation Equipment, Marine and Industrial, Chemicals by Navy Signed by year:2000: $0; 2001: $0; 2002: $25,000; 2003: $37,700; 2004: $26,928; 2005: $30,042; 2006: $0.
Biggest contracts:
$27,588 with Navy for Water Distillation Equipment, Marine and Industrial. Signed on 2005-11-15. Completion date: 2004-09-30.
$26,928, same as above.Signed on 2004-11-01. Completion date: 2004-09-30.
$26,268, same as above.Signed on 2003-09-29. Completion date: 2004-09-30.
$25,000 with Navy for Chemicals. Signed on 2002-10-01. Completion date: 2003-09-30.
WE CARE COMPANY (256 1/2 N LINCOLN WAY in GALT, CA; small business) : $97,915 in 2 contractsin 2004
$49,756 with Navy for Trailers. Signed on 2004-09-20. Completion date: 2005-01-31.
$48,159 with Air Force for Trailers. Signed on 2004-09-30. Completion date: 2004-10-29.
EVELYN R HATFIELD & ASSOCIATE (864 LAKE CANYON AVE in GALT, CA) : $10,000 in 2 contractsin 2005
$5,000 with U.S. Army Corps of Engineers - civil program financing only for Other Education and Training Services. Signed on 2005-01-05. Completion date: 2004-10-21.
$5,000 with Army for Other Education and Training Services. Signed on 2005-01-05. Completion date: 2004-10-21.
Top industries in this zip code by the number of employees in 2005:
Wholesale Trade: Other Construction Material Merchant Wholesalers (250-499 employees: 1 establishment)
2005 - 2018 National Fire Incident Reporting System (NFIRS) incidents
Based on the data from the years 2005 - 2018 the average number of fires per year is 37. The highest number of reported fire incidents - 113 took place in 2018, and the least - 1 in 2012. The data has a rising trend.
When looking into fire subcategories, the most incidents belonged to: Outside Fires (63.2%), and Structure Fires (16.8%).
Fire incident types reported to NFIRS in Zip Code 95632


 Nearest zip codes: 95220, 95258, 95693, 95638, 95237, 95624.
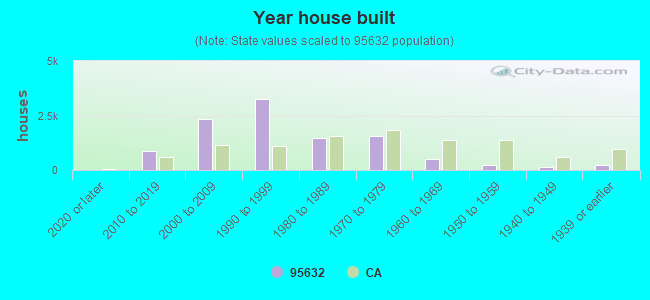


 Based on the data from the years 2005 - 2018 the average number of fires per year is 37. The highest number of reported fire incidents - 113 took place in 2018, and the least - 1 in 2012. The data has a rising trend.
 When looking into fire subcategories, the most incidents belonged to: Outside Fires (63.2%), and Structure Fires (16.8%).