Estimated zip code population in 2022: 1,123 Zip code population in 2010: 1,380 Zip code population in 2000: 1,156
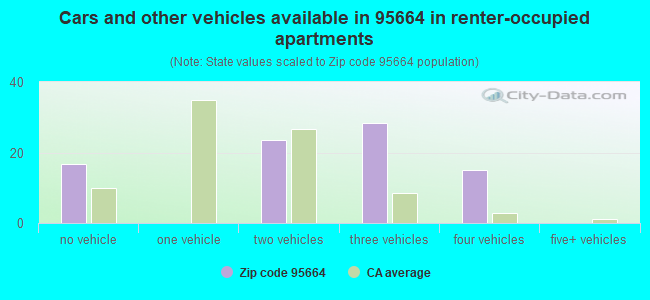
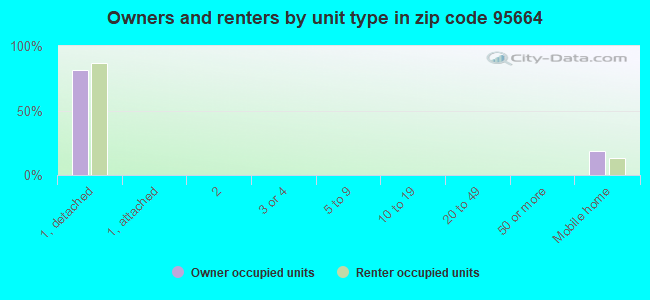
Houses and condos: 559 Renter-occupied apartments: 85
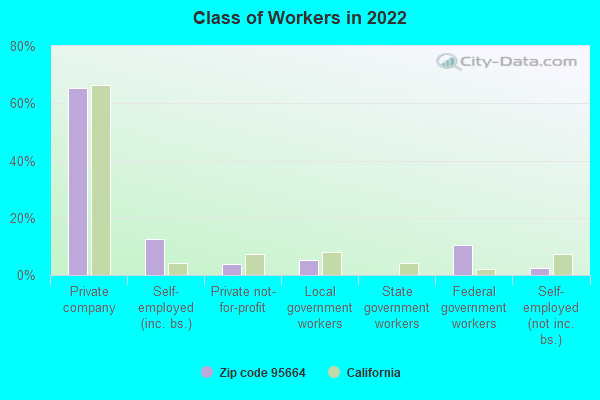
% of renters here:
16%
State:
44%
March 2022 cost of living index in zip code 95664: 95.9 (near average, U.S. average is 100)
Land area: 37.7 sq. mi. Water area: 4.7 sq. mi.
Population density: 30 people per square mile
(very low).
OSM Map
General Map
Google Map
MSN Map
OSM Map
General Map
Google Map
MSN Map
OSM Map
General Map
Google Map
MSN Map
OSM Map
General Map
Google Map
MSN Map
Please wait while loading the map...
Real estate property taxes paid for housing units in 2022:
This zip code:
0.6% ($2,597)
California:
0.7% ($4,831)
Median real estate property taxes paid for housing units with mortgages in 2022: $2,836 (0.4%) Median real estate property taxes paid for housing units with no mortgage in 2022: $2,044 (0.5%)
Business Search- 14 Million verified businesses
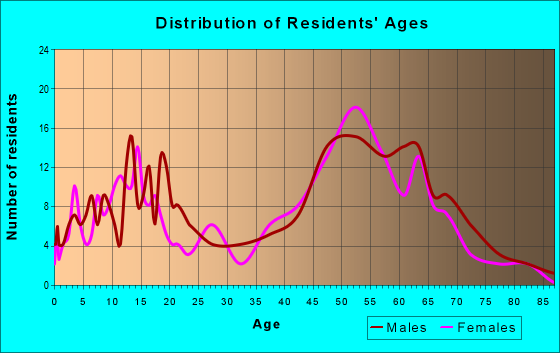
Males: 580
(51.7%)
Females: 542
(48.3%)
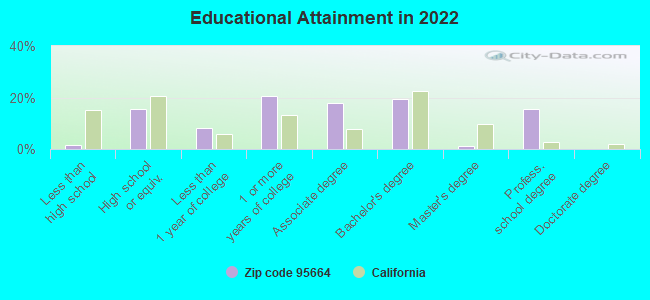
For population 25 years and over in 95664:
High school or higher: 97.9%
Bachelor's degree or higher: 36.0%
Graduate or professional degree: 16.7%
Mean travel time to work (commute): 35.6 minutes
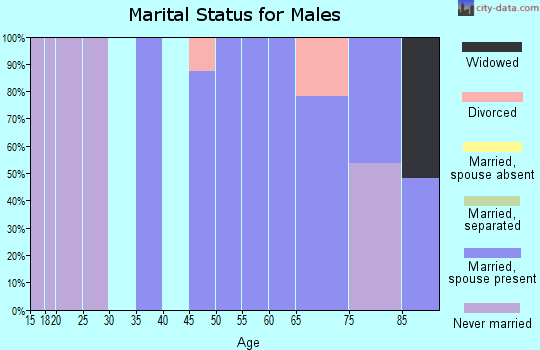
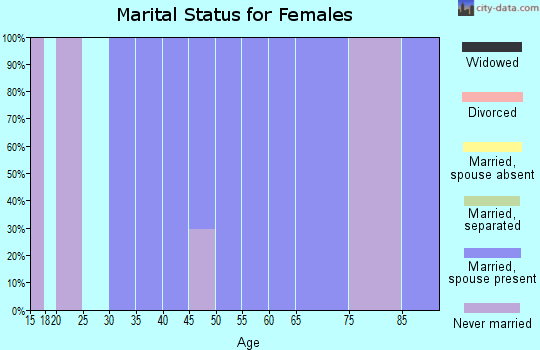
For population 15 years and over in 95664:
Never married: 15.0%
Now married: 71.5%
Separated: 0.0%
Widowed: 1.2%
Divorced: 12.3%
Zip code 95664 compared to state average:
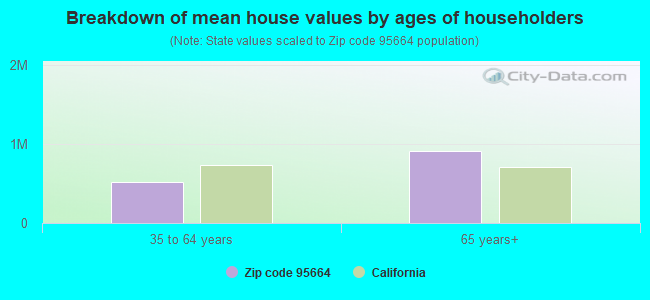
Median house value below state average.
Unemployed percentage significantly below state average.
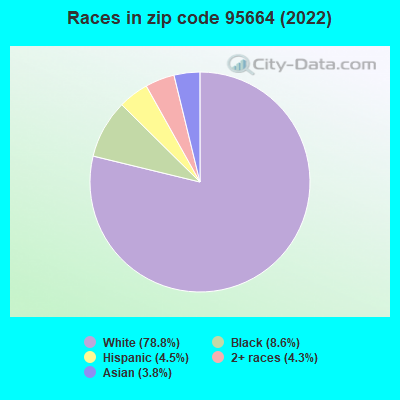
Hispanic race population percentage significantly below state average.
Median age significantly above state average.
Foreign-born population percentage significantly below state average.
Renting percentage significantly below state average.
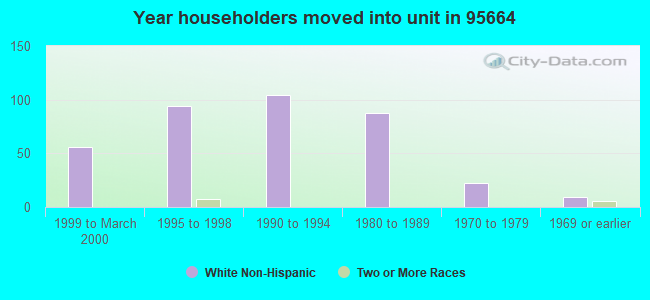
Length of stay since moving in significantly above state average.
Averages for the 2020 tax year for zip code 95664, filed in 2021:
Average Adjusted Gross Income (AGI) in 2020: $93,749 (Individual Income Tax Returns)
Here:
$93,749
State:
$95,910
Salary/wage: $79,906 (reported on 71.6% of returns)
Here:
$79,906
State:
$77,331
(% of AGI for various income ranges: 1153.0% for AGIs below $25k, 3888.6% for AGIs $25k-50k, 6682.5% for AGIs $50k-75k, 7975.0% for AGIs $75k-100k, 19476.2% for AGIs $100k-200k, 65180.0% for AGIs over 200k)
Taxable interest for individuals: $697 (reported on 50.7% of returns)
This zip code:
$697
California:
$2,294
(% of AGI for various income ranges: 14.0% for AGIs below $25k, 20.0% for AGIs $25k-50k, 57.5% for AGIs $50k-75k, 57.5% for AGIs $75k-100k, 92.5% for AGIs $100k-200k, 445.0% for AGIs over 200k)
Ordinary dividends: $3,656 (reported on 23.9% of returns)
Here:
$3,656
State:
$10,949
(% of AGI for various income ranges: 80.0% for AGIs below $25k, 195.0% for AGIs $50k-75k, 55.0% for AGIs $75k-100k, 326.2% for AGIs $100k-200k, 720.0% for AGIs over 200k)
Net capital gain/loss in AGI: +$13,556 (reported on 23.9% of returns)
Here:
+$13,556
State:
+$49,306
(% of AGI for various income ranges: 121.0% for AGIs below $25k, 147.5% for AGIs $50k-75k, 182.5% for AGIs $75k-100k, 763.8% for AGIs $100k-200k, 6525.0% for AGIs over 200k)
Profit/loss from business: +$9,979 (reported on 20.9% of returns)
Here:
+$9,979
State:
+$15,671
(% of AGI for various income ranges: 249.0% for AGIs below $25k, 468.6% for AGIs $25k-50k, 327.5% for AGIs $75k-100k, 861.3% for AGIs $100k-200k)
Taxable individual retirement arrangement distribution: $23,833 (reported on 13.4% of returns)
95664:
$23,833
California:
$23,505
(% of AGI for various income ranges: 200.0% for AGIs below $25k, 1190.0% for AGIs $50k-75k, 1836.2% for AGIs $100k-200k)
Total itemized deductions: $32,975 (reported on 17.9% of returns)
Here:
$32,975
State:
$39,517
(% of AGI for various income ranges: 2565.0% for AGIs $50k-75k, 2230.0% for AGIs $100k-200k, 5735.0% for AGIs over 200k)
Charity contributions: $4,530 (reported on 14.9% of returns)
Here:
$4,530
State:
$12,598
(% of AGI for various income ranges: 74.3% for AGIs $25k-50k, 297.5% for AGIs $100k-200k, 815.0% for AGIs over 200k)
Taxes paid: $8,950 (reported on 17.9% of returns)
95664:
$8,950
State:
$8,807
(% of AGI for various income ranges: 557.5% for AGIs $50k-75k, 675.0% for AGIs $100k-200k, 1555.0% for AGIs over 200k)
Earned income credit: $1,580 (reported on 7.5% of returns)
Here:
$1,580
State:
$2,074
(% of AGI for various income ranges: 79.0% for AGIs below $25k)
Percentage of individuals using paid preparers for their 2020 taxes: 92.5%
Here:
93%
State:
92%
(% for various income ranges: 88.2% for AGIs below $25k, 91.7% for AGIs $25k-50k, 87.5% for AGIs $50k-75k, 100.0% for AGIs $75k-100k, 94.1% for AGIs $100k-200k, 100.0% for AGIs over 200k)
Averages for the 2012 tax year for zip code 95664, filed in 2013:
Average Adjusted Gross Income (AGI) in 2012: $68,755 (Individual Income Tax Returns)
Here:
$68,755
State:
$72,726
Salary/wage: $65,400 (reported on 69.4% of returns)
Here:
$65,400
State:
$59,079
(% of AGI for various income ranges: 59.1% for AGIs below $25k, 66.3% for AGIs $25k-50k, 64.7% for AGIs $50k-75k, 61.1% for AGIs $75k-100k, 71.3% for AGIs $100k-200k, 60.0% for AGIs over 200k)
Taxable interest for individuals: $970 (reported on 48.4% of returns)
This zip code:
$970
California:
$2,146
(% of AGI for various income ranges: 1.0% for AGIs below $25k, 1.3% for AGIs $25k-50k, 0.7% for AGIs $50k-75k, 0.2% for AGIs $75k-100k, 0.4% for AGIs $100k-200k, 1.1% for AGIs over 200k)
Ordinary dividends: $2,264 (reported on 22.6% of returns)
Here:
$2,264
State:
$9,308
(% of AGI for various income ranges: 2.4% for AGIs below $25k, 1.8% for AGIs $50k-75k, 0.9% for AGIs $100k-200k)
Net capital gain/loss in AGI: +$3,562 (reported on 21.0% of returns)
Here:
+$3,562
State:
+$30,460
(% of AGI for various income ranges: 1.1% for AGIs below $25k, 0.9% for AGIs $50k-75k, 2.2% for AGIs $100k-200k)
Profit/loss from business: +$11,215 (reported on 21.0% of returns)
Here:
+$11,215
State:
+$17,064
(% of AGI for various income ranges: 15.7% for AGIs below $25k, 4.9% for AGIs $25k-50k, 7.6% for AGIs $50k-75k, 2.7% for AGIs $100k-200k)
Taxable individual retirement arrangement distribution: $22,129 (reported on 11.3% of returns)
95664:
$22,129
California:
$19,557
Total itemized deductions: $26,872 (26% of AGI, reported on 51.6% of returns)
Here:
$26,872
State:
$34,004
Here:
26.1% of AGI
State:
22.7% of AGI
(% of AGI for various income ranges: 34.6% for AGIs below $25k, 20.6% for AGIs $25k-50k, 18.7% for AGIs $50k-75k, 18.0% for AGIs $75k-100k, 20.6% for AGIs $100k-200k, 17.9% for AGIs over 200k)
Charity contributions: $2,658 (reported on 41.9% of returns)
Here:
$2,658
State:
$4,659
(% of AGI for various income ranges: 1.7% for AGIs $25k-50k, 1.4% for AGIs $50k-75k, 1.2% for AGIs $75k-100k, 2.4% for AGIs $100k-200k, 0.9% for AGIs over 200k)
Taxes paid: $9,100 (reported on 51.6% of returns)
95664:
$9,100
State:
$14,448
(% of AGI for various income ranges: 7.2% for AGIs below $25k, 4.0% for AGIs $25k-50k, 5.4% for AGIs $50k-75k, 5.5% for AGIs $75k-100k, 7.5% for AGIs $100k-200k, 8.7% for AGIs over 200k)
Earned income credit: $1,729 (reported on 11.3% of returns)
Here:
$1,729
State:
$2,286
(% of AGI for various income ranges: 3.7% for AGIs below $25k, 1.1% for AGIs $25k-50k)
Percentage of individuals using paid preparers for their 2012 taxes: 58.1%
Here:
58%
State:
64%
(% for various income ranges: 47.4% for AGIs below $25k, 54.5% for AGIs $25k-50k, 60.0% for AGIs $50k-75k, 66.7% for AGIs $75k-100k, 84.6% for AGIs $100k-200k)
Averages for the 2004 tax year for zip code 95664, filed in 2005:
Average Adjusted Gross Income (AGI) in 2004: $64,039 (Individual Income Tax Returns)
Here:
$64,039
State:
$58,600
Salary/wage: $62,834 (reported on 77.1% of returns)
Here:
$62,834
State:
$49,455
(% of AGI for various income ranges: 197.4% for AGIs below $10k, 66.4% for AGIs $10k-25k, 73.7% for AGIs $25k-50k, 74.9% for AGIs $50k-75k, 73.9% for AGIs $75k-100k, 76.9% for AGIs over 100k)
Taxable interest for individuals: $1,285 (reported on 61.7% of returns)
This zip code:
$1,285
California:
$2,365
(% of AGI for various income ranges: 6.7% for AGIs below $10k, 3.3% for AGIs $10k-25k, 1.3% for AGIs $25k-50k, 0.8% for AGIs $50k-75k, 0.7% for AGIs $75k-100k, 1.4% for AGIs over 100k)
Taxable dividends: $1,432 (reported on 27.7% of returns)
Here:
$1,432
State:
$4,746
(% of AGI for various income ranges: 3.1% for AGIs below $10k, 0.5% for AGIs $10k-25k, 0.7% for AGIs $25k-50k, 0.4% for AGIs $50k-75k, 0.3% for AGIs $75k-100k, 0.8% for AGIs over 100k)
Net capital gain/loss: +$5,691 (reported on 23.2% of returns)
Here:
+$5,691
State:
+$23,418
(% of AGI for various income ranges: -1.1% for AGIs $10k-25k, -0.6% for AGIs $25k-50k, -0.5% for AGIs $50k-75k, 0.3% for AGIs $75k-100k, 5.0% for AGIs over 100k)
Profit/loss from business: +$5,059 (reported on 20.2% of returns)
Here:
+$5,059
State:
+$16,826
(% of AGI for various income ranges: 21.8% for AGIs below $10k, 7.5% for AGIs $10k-25k, 5.4% for AGIs $25k-50k, 2.3% for AGIs $50k-75k, 8.0% for AGIs $75k-100k, -3.6% for AGIs over 100k)
Self-employed pension: $8,300 (reported on 1.7% of returns)
Here:
$8,300
California:
$17,688
Total itemized deductions: $24,960 (28% of AGI, reported on 59.1% of returns)
Here:
$24,960
State:
$28,113
Here:
27.7% of AGI
State:
25.3% of AGI
(% of AGI for various income ranges: 38.6% for AGIs $10k-25k, 24.3% for AGIs $25k-50k, 25.4% for AGIs $50k-75k, 23.5% for AGIs $75k-100k, 20.0% for AGIs over 100k)
Charity contributions deductions: $2,643 (3% of AGI, reported on 53.7% of returns)
Here:
$2,643
State:
$3,923
Here:
2.8% of AGI
State:
3.3% of AGI
(% of AGI for various income ranges: 2.3% for AGIs $10k-25k, 1.5% for AGIs $25k-50k, 2.2% for AGIs $50k-75k, 2.6% for AGIs $75k-100k, 2.2% for AGIs over 100k)
Total tax: $9,458 (reported on 82.9% of returns)
95664:
$9,458
State:
$10,761
(% of AGI for various income ranges: 5.2% for AGIs below $10k, 5.4% for AGIs $10k-25k, 6.4% for AGIs $25k-50k, 8.5% for AGIs $50k-75k, 10.2% for AGIs $75k-100k, 16.9% for AGIs over 100k)
Earned income credit: $1,714 (reported on 4.8% of returns)
Here:
$1,714
State:
$1,763
Percentage of individuals using paid preparers for their 2004 taxes: 58.8%
Here:
59%
State:
66%
(% for various income ranges: 48.8% for AGIs below $10k, 50.4% for AGIs $10k-25k, 48.5% for AGIs $25k-50k, 67.3% for AGIs $50k-75k, 68.8% for AGIs $75k-100k, 69.0% for AGIs over 100k)
Household received Food Stamps/SNAP in the past 12 months: 21 Household did not receive Food Stamps/SNAP in the past 12 months: 494
Women who did not have a birth in the past 12 months: 132 (65 now married, 66 unmarried)
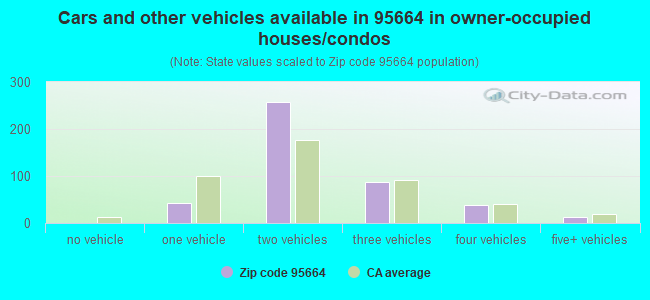
Housing units in zip code 95664 with a mortgage: 185 (36 second mortgage, 37 both second mortgage and home equity loan) Residents with income below the poverty level in 2022:
This zip code:
2.1%
Whole state:
12.2%
Residents with income below 50% of the poverty level in 2022:
This zip code:
2.1%
Whole state:
6.2%
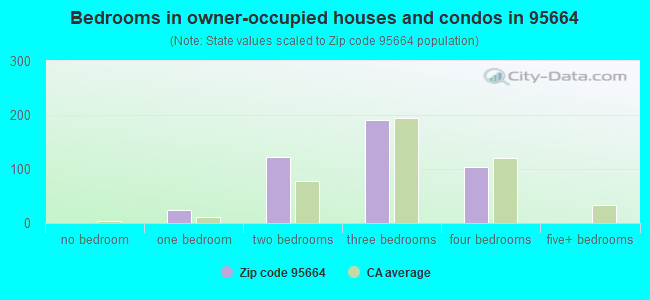
Median number of rooms in houses and condos:
Here:
6.0
State:
6.0
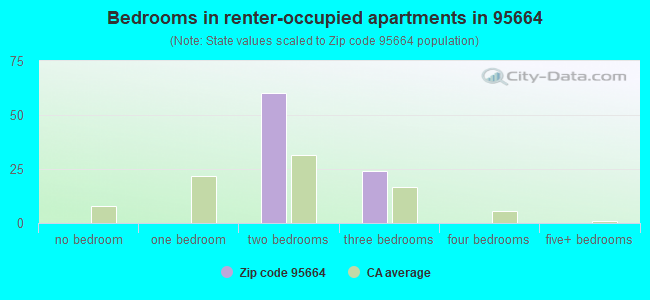
Median number of rooms in apartments:
Here:
4.3
State:
3.9
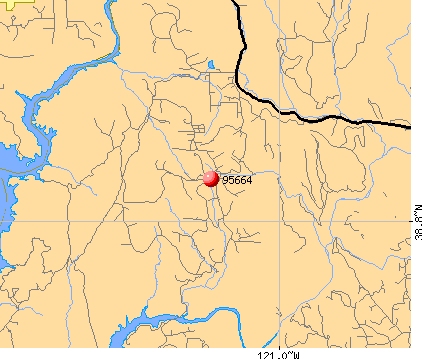
Notable locations in this zip code not listed on our city pages
Notable locations in zip code 95664: Goose Flat (A), Bayley House (B), El Dorado County Fire Protection District Station 73 Pilot Hill (C), Department of Forestry and Fire Protection Station 70 Pilot Hill (D). Display/hide their locations on the map
Creeks: Hancock Creek (A), Indian Springs Creek (B), Knickerbocker Creek (C), Pilot Creek (D), Acorn Creek (E), Anderson Creek (F). Display/hide their locations on the map
Size of family households: 275 2-persons, 30 3-persons, 45 4-persons, 12 5-persons, 16 7-or-more-persons
Size of nonfamily households: 147 1-person
143 married couples with children.
15 single-parent households (15 women).
95.2% of residents of 95664 zip code speak English at home.
1.0% of residents speak Spanish at home (100% very well).
3.8% of residents speak Asian or Pacific Island language at home (100% well).
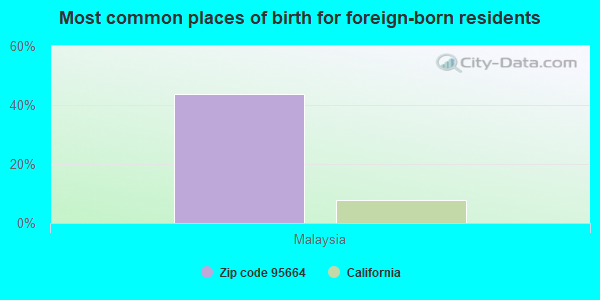
Foreign born population: 98 (8.8%) (61.0% of them are naturalized citizens)
This zip code:
8.8%
Whole state:
26.7%
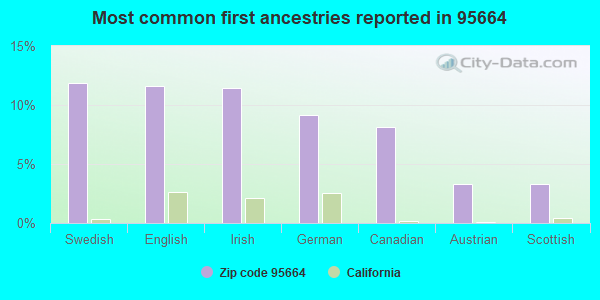
44%Malaysia
12%Swedish
12%English
11%Irish
9%German
8%Canadian
3%Austrian
3%Scottish
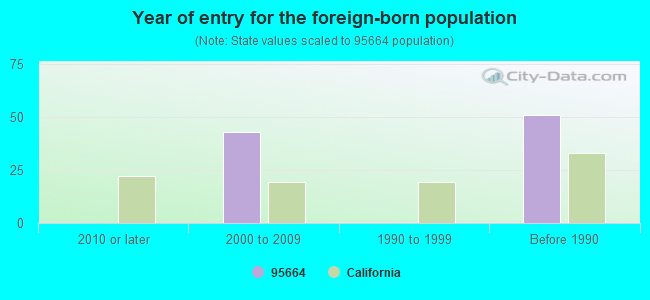
Year of entry for the foreign-born population
02010 or later
432000 to 2009
01990 to 1999
51Before 1990
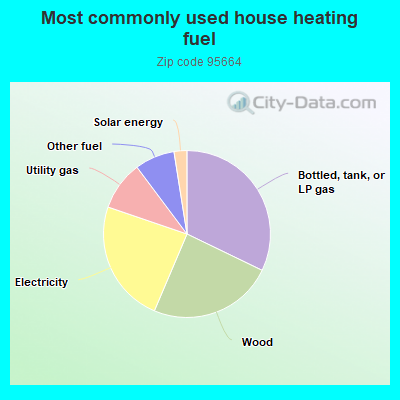
32.4%Bottled, tank, or LP gas
24.4%Wood
24.0%Electricity
9.6%Utility gas
7.8%Other fuel
2.5%Solar energy
Population in 1990: 1,152. Population change in the 1990s: +4 (+0.3%).
Place of birth for U.S.-born residents:
This state: 664
Midwest: 81
South: 140
West: 127
62% of the 95664 zip code residents lived in the same house 5 years ago. Out of people who lived in different houses, 24% lived in this county. Out of people who lived in different counties, 50% lived in California.
97% of the 95664 zip code residents lived in the same house 1 year ago. Out of people who lived in different houses, 118% moved from different county within same state.
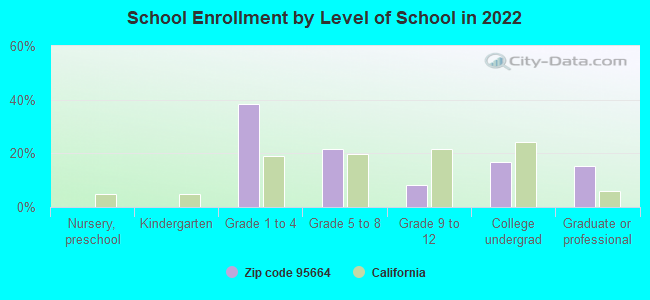
Private vs. public school enrollment:
Students in private schools in grades 1 to 8 (elementary and middle school): 26
Here:
23.8%
California:
10.5%
Students in private schools in grades 9 to 12 (high school):
Here:
0.0%
California:
8.5%
Students in private undergraduate colleges: 10
Here:
34.1%
California:
15.9%
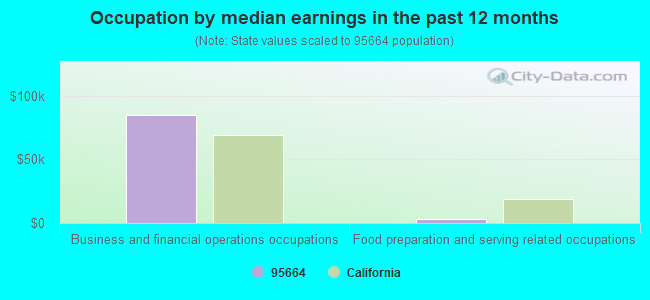
Occupation by median earnings in the past 12 months ($)
84,922Business and financial operations occupations
3,018Food preparation and serving related occupations
Top industries in this zip code by the number of employees in 2005:
Professional, Scientific, and Technical Services: Human Resources and Executive Search Consulting Services (10-19 employees: 1 establishment)
Professional, Scientific, and Technical Services: Other Accounting Services (5-9: 1)
Accommodation and Food Services: Full-Service Restaurants (5-9: 1)
Construction: New Single-Family Housing Construction (except Operative Builders) (5-9: 1)
Wholesale Trade: Other Farm Product Raw Material Merchant Wholesalers (5-9: 1)
Professional, Scientific, and Technical Services: Computer Systems Design Services (1-4: 1)
Professional, Scientific, and Technical Services: Architectural Services (1-4: 1)
Professional, Scientific, and Technical Services: Engineering Services (1-4: 1)
Construction: Residential Remodelers (1-4: 1)
Finance and Insurance: Insurance Agencies and Brokerages (1-4: 1)
Fatal accident statistics in 2014:
Fatal accident count: 1
Vehicles involved in fatal accidents: 1
Fatal accidents caused by drunken drivers: 1
Fatalities: 1
Persons involved in fatal accidents: 1
Pedestrians involved in fatal accidents: 0
Fatal accident statistics in 2012:
Fatal accident count: 1
Vehicles involved in fatal accidents: 1
Fatal accidents caused by drunken drivers: 0
Fatalities: 1
Persons involved in fatal accidents: 1
Pedestrians involved in fatal accidents: 0
Home Mortgage Disclosure Act Aggregated Statistics For Year 2009 (Based on 2 partial tracts)
A) FHA, FSA/RHS & VA Home Purchase Loans
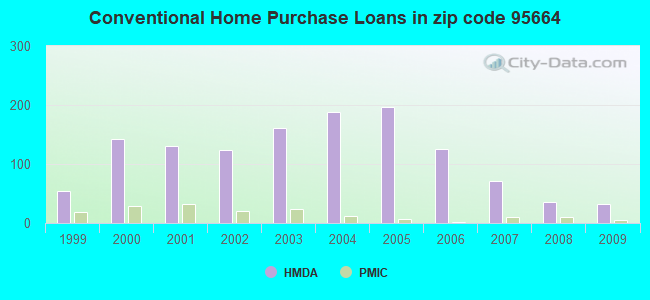
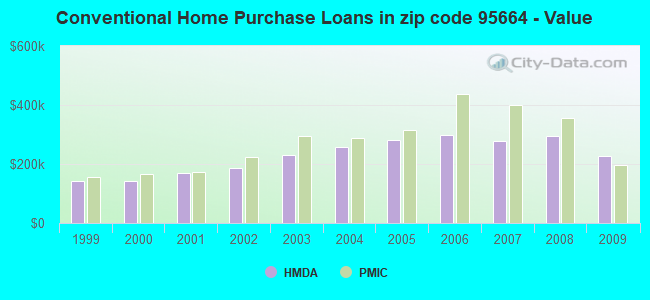
B) Conventional Home Purchase Loans
C) Refinancings
D) Home Improvement Loans
F) Non-occupant Loans on < 5 Family Dwellings (A B C & D)
G) Loans On Manufactured Home Dwelling (A B C & D)
Number
Average Value
Number
Average Value
Number
Average Value
Number
Average Value
Number
Average Value
Number
Average Value
LOANS ORIGINATED
24
$255,180
33
$225,848
193
$241,227
6
$350,937
11
$219,570
15
$191,570
APPLICATIONS APPROVED, NOT ACCEPTED
3
$285,253
6
$368,577
26
$313,851
1
$273,620
1
$164,400
0
$0
APPLICATIONS DENIED
7
$235,173
8
$252,505
80
$294,519
8
$109,504
5
$144,354
3
$305,897
APPLICATIONS WITHDRAWN
7
$198,016
2
$325,975
66
$264,695
3
$93,833
2
$162,145
1
$152,010
FILES CLOSED FOR INCOMPLETENESS
1
$199,300
0
$0
12
$252,412
3
$93,833
1
$335,550
0
$0
Aggregated Statistics For Year 2008 (Based on 2 partial tracts)
A) FHA, FSA/RHS & VA Home Purchase Loans
B) Conventional Home Purchase Loans
C) Refinancings
D) Home Improvement Loans
F) Non-occupant Loans on < 5 Family Dwellings (A B C & D)
G) Loans On Manufactured Home Dwelling (A B C & D)
Number
Average Value
Number
Average Value
Number
Average Value
Number
Average Value
Number
Average Value
Number
Average Value
LOANS ORIGINATED
11
$294,295
35
$296,009
114
$274,369
20
$90,530
6
$283,565
10
$231,618
APPLICATIONS APPROVED, NOT ACCEPTED
0
$0
6
$581,392
29
$320,367
1
$56,300
2
$251,660
2
$191,420
APPLICATIONS DENIED
0
$0
7
$322,840
70
$354,079
18
$159,642
6
$293,510
5
$204,706
APPLICATIONS WITHDRAWN
2
$300,640
7
$353,564
32
$284,808
6
$82,573
2
$353,565
1
$472,920
FILES CLOSED FOR INCOMPLETENESS
0
$0
2
$292,760
14
$423,617
6
$143,190
1
$157,640
0
$0
Aggregated Statistics For Year 2007 (Based on 2 partial tracts)
A) FHA, FSA/RHS & VA Home Purchase Loans
B) Conventional Home Purchase Loans
C) Refinancings
D) Home Improvement Loans
F) Non-occupant Loans on < 5 Family Dwellings (A B C & D)
G) Loans On Manufactured Home Dwelling (A B C & D)
Number
Average Value
Number
Average Value
Number
Average Value
Number
Average Value
Number
Average Value
Number
Average Value
LOANS ORIGINATED
1
$414,370
71
$279,200
214
$286,188
32
$189,942
18
$288,444
18
$264,610
APPLICATIONS APPROVED, NOT ACCEPTED
1
$333,300
19
$397,241
39
$340,716
7
$130,937
6
$203,807
2
$145,255
APPLICATIONS DENIED
0
$0
17
$283,686
90
$320,109
32
$192,652
6
$322,975
17
$245,468
APPLICATIONS WITHDRAWN
1
$414,370
9
$358,318
53
$282,159
11
$237,688
5
$161,244
6
$259,543
FILES CLOSED FOR INCOMPLETENESS
0
$0
6
$434,260
12
$327,197
3
$181,660
1
$432,380
0
$0
Aggregated Statistics For Year 2006 (Based on 2 partial tracts)
A) FHA, FSA/RHS & VA Home Purchase Loans
B) Conventional Home Purchase Loans
C) Refinancings
D) Home Improvement Loans
F) Non-occupant Loans on < 5 Family Dwellings (A B C & D)
G) Loans On Manufactured Home Dwelling (A B C & D)
Number
Average Value
Number
Average Value
Number
Average Value
Number
Average Value
Number
Average Value
Number
Average Value
LOANS ORIGINATED
1
$396,350
125
$299,147
254
$294,032
45
$197,801
12
$265,923
15
$196,375
APPLICATIONS APPROVED, NOT ACCEPTED
0
$0
35
$276,063
44
$294,321
9
$67,686
7
$211,044
2
$204,930
APPLICATIONS DENIED
0
$0
27
$333,504
104
$315,334
23
$132,133
5
$278,572
17
$236,924
APPLICATIONS WITHDRAWN
0
$0
17
$286,468
69
$283,442
10
$175,656
6
$215,628
2
$271,365
FILES CLOSED FOR INCOMPLETENESS
0
$0
1
$255,600
17
$326,142
2
$168,900
1
$430,130
0
$0
Aggregated Statistics For Year 2005 (Based on 2 partial tracts)
B) Conventional Home Purchase Loans
C) Refinancings
D) Home Improvement Loans
F) Non-occupant Loans on < 5 Family Dwellings (A B C & D)
G) Loans On Manufactured Home Dwelling (A B C & D)
Number
Average Value
Number
Average Value
Number
Average Value
Number
Average Value
Number
Average Value
LOANS ORIGINATED
196
$281,035
364
$266,522
60
$179,653
35
$235,109
19
$224,548
APPLICATIONS APPROVED, NOT ACCEPTED
26
$285,874
54
$262,900
8
$175,515
6
$194,610
3
$109,597
APPLICATIONS DENIED
37
$296,290
100
$280,509
26
$147,723
6
$179,222
15
$206,583
APPLICATIONS WITHDRAWN
44
$278,915
114
$277,915
21
$190,348
3
$229,330
6
$258,605
FILES CLOSED FOR INCOMPLETENESS
5
$281,274
47
$280,158
1
$16,890
5
$182,638
2
$229,140
Aggregated Statistics For Year 2004 (Based on 2 partial tracts)
A) FHA, FSA/RHS & VA Home Purchase Loans
B) Conventional Home Purchase Loans
C) Refinancings
D) Home Improvement Loans
F) Non-occupant Loans on < 5 Family Dwellings (A B C & D)
G) Loans On Manufactured Home Dwelling (A B C & D)
Number
Average Value
Number
Average Value
Number
Average Value
Number
Average Value
Number
Average Value
Number
Average Value
LOANS ORIGINATED
1
$261,230
188
$256,303
381
$225,256
55
$145,090
28
$235,937
25
$189,664
APPLICATIONS APPROVED, NOT ACCEPTED
0
$0
43
$234,234
65
$244,498
9
$213,564
3
$270,990
7
$192,386
APPLICATIONS DENIED
0
$0
43
$230,620
102
$289,415
19
$99,799
8
$262,218
12
$201,272
APPLICATIONS WITHDRAWN
0
$0
37
$242,638
96
$245,280
17
$127,371
5
$357,618
2
$343,995
FILES CLOSED FOR INCOMPLETENESS
0
$0
1
$296,140
39
$267,699
2
$30,965
1
$296,140
2
$221,260
Aggregated Statistics For Year 2003 (Based on 2 partial tracts)
A) FHA, FSA/RHS & VA Home Purchase Loans
B) Conventional Home Purchase Loans
C) Refinancings
D) Home Improvement Loans
F) Non-occupant Loans on < 5 Family Dwellings (A B C & D)
Number
Average Value
Number
Average Value
Number
Average Value
Number
Average Value
Number
Average Value
LOANS ORIGINATED
1
$280,370
161
$231,886
727
$199,993
36
$57,489
35
$188,299
APPLICATIONS APPROVED, NOT ACCEPTED
0
$0
20
$236,122
62
$207,384
9
$55,674
5
$218,670
APPLICATIONS DENIED
0
$0
23
$217,367
176
$214,164
17
$38,284
7
$211,849
APPLICATIONS WITHDRAWN
1
$222,950
19
$258,921
162
$212,286
6
$74,128
6
$190,107
FILES CLOSED FOR INCOMPLETENESS
0
$0
6
$231,768
23
$200,575
0
$0
1
$185,790
Aggregated Statistics For Year 2002 (Based on 2 partial tracts)
A) FHA, FSA/RHS & VA Home Purchase Loans
B) Conventional Home Purchase Loans
C) Refinancings
D) Home Improvement Loans
F) Non-occupant Loans on < 5 Family Dwellings (A B C & D)
Number
Average Value
Number
Average Value
Number
Average Value
Number
Average Value
Number
Average Value
LOANS ORIGINATED
5
$192,096
123
$187,923
555
$176,427
36
$46,322
34
$147,142
APPLICATIONS APPROVED, NOT ACCEPTED
0
$0
37
$210,775
61
$176,524
5
$39,184
2
$157,640
APPLICATIONS DENIED
0
$0
16
$264,329
97
$190,956
20
$48,306
1
$215,070
APPLICATIONS WITHDRAWN
0
$0
12
$203,149
105
$177,511
6
$84,450
1
$153,140
FILES CLOSED FOR INCOMPLETENESS
0
$0
7
$147,989
27
$179,326
1
$197,050
1
$173,400
Aggregated Statistics For Year 2001 (Based on 2 partial tracts)
A) FHA, FSA/RHS & VA Home Purchase Loans
B) Conventional Home Purchase Loans
C) Refinancings
D) Home Improvement Loans
F) Non-occupant Loans on < 5 Family Dwellings (A B C & D)
Number
Average Value
Number
Average Value
Number
Average Value
Number
Average Value
Number
Average Value
LOANS ORIGINATED
14
$168,739
131
$170,344
452
$167,251
20
$46,729
24
$160,408
APPLICATIONS APPROVED, NOT ACCEPTED
2
$217,880
11
$162,758
43
$146,642
3
$109,223
2
$123,860
APPLICATIONS DENIED
1
$188,040
15
$193,297
84
$132,345
10
$39,185
5
$135,346
APPLICATIONS WITHDRAWN
1
$204,930
14
$182,573
77
$155,812
3
$78,070
1
$148,630
FILES CLOSED FOR INCOMPLETENESS
0
$0
0
$0
17
$175,987
1
$28,150
0
$0
Aggregated Statistics For Year 2000 (Based on 2 partial tracts)
A) FHA, FSA/RHS & VA Home Purchase Loans
B) Conventional Home Purchase Loans
C) Refinancings
D) Home Improvement Loans
F) Non-occupant Loans on < 5 Family Dwellings (A B C & D)
Number
Average Value
Number
Average Value
Number
Average Value
Number
Average Value
Number
Average Value
LOANS ORIGINATED
20
$161,581
142
$141,480
96
$110,782
23
$39,753
12
$120,388
APPLICATIONS APPROVED, NOT ACCEPTED
1
$200,430
17
$123,396
17
$121,542
6
$39,410
2
$140,185
APPLICATIONS DENIED
3
$160,267
27
$139,249
33
$122,529
18
$40,348
0
$0
APPLICATIONS WITHDRAWN
2
$145,815
16
$132,657
17
$111,606
2
$19,140
2
$45,040
FILES CLOSED FOR INCOMPLETENESS
0
$0
1
$163,270
8
$192,124
0
$0
0
$0
Aggregated Statistics For Year 1999 (Based on 1 partial tract)
A) FHA, FSA/RHS & VA Home Purchase Loans
B) Conventional Home Purchase Loans
C) Refinancings
D) Home Improvement Loans
F) Non-occupant Loans on < 5 Family Dwellings (A B C & D)
Detailed PMIC statistics for the following Tracts:0306.01
2005 - 2018 National Fire Incident Reporting System (NFIRS) incidents
According to the data from the years 2005 - 2018 the average number of fires per year is 9. The highest number of reported fire incidents - 19 took place in 2008, and the least - 4 in 2015. The data has a dropping trend.
When looking into fire subcategories, the most reports belonged to: Outside Fires (75.0%), and Structure Fires (17.4%).
Fire incident types reported to NFIRS in Zip Code 95664
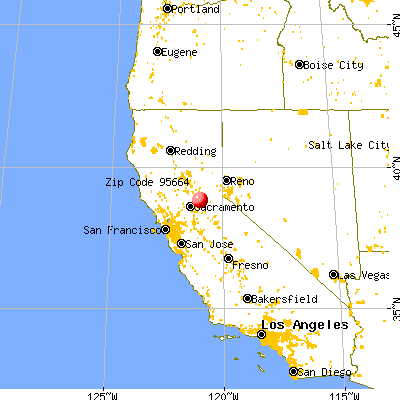


 Nearest zip codes: 95672, 95614, 95651, 95762, 95603, 95650.
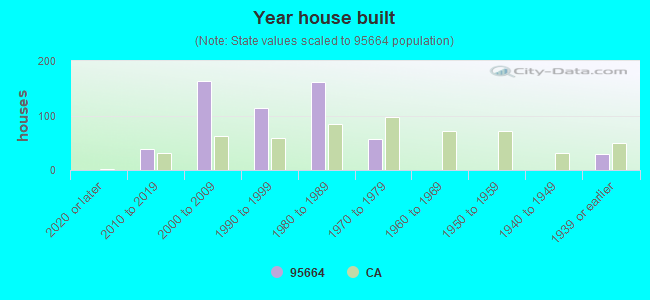


 According to the data from the years 2005 - 2018 the average number of fires per year is 9. The highest number of reported fire incidents - 19 took place in 2008, and the least - 4 in 2015. The data has a dropping trend.
 When looking into fire subcategories, the most reports belonged to: Outside Fires (75.0%), and Structure Fires (17.4%).