Estimated zip code population in 2022: 28,130 Zip code population in 2010: 27,844 Zip code population in 2000: 24,941
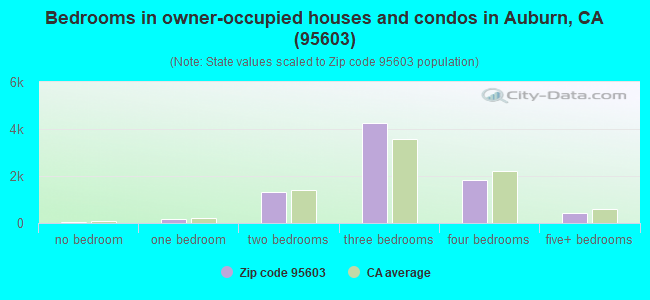
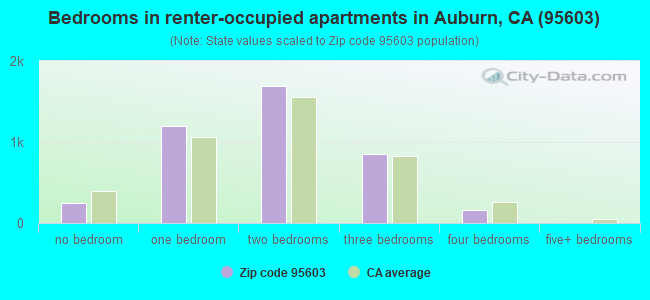
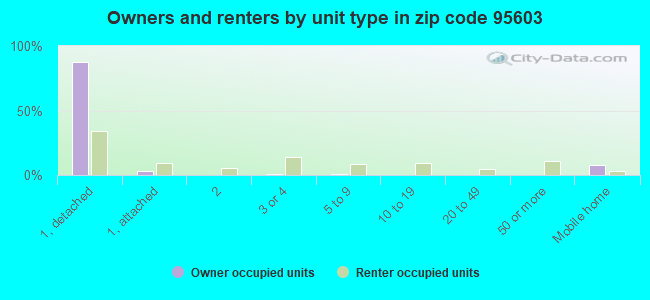
Houses and condos: 12,978 Renter-occupied apartments: 4,162
% of renters here:
34%
State:
44%
March 2022 cost of living index in zip code 95603: 103.3 (near average, U.S. average is 100)
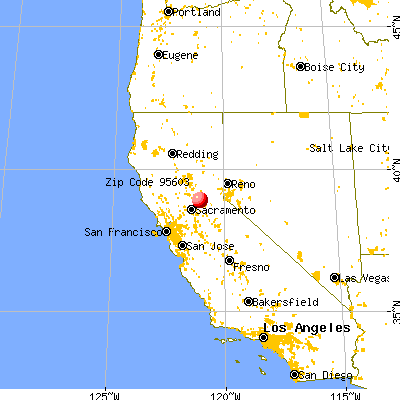
Land area: 39.0 sq. mi. Water area: 0.5 sq. mi.
Population density: 721 people per square mile
(low).
OSM Map
General Map
Google Map
MSN Map
OSM Map
General Map
Google Map
MSN Map
OSM Map
General Map
Google Map
MSN Map
OSM Map
General Map
Google Map
MSN Map
Please wait while loading the map...
Real estate property taxes paid for housing units in 2022:
This zip code:
0.8% ($4,791)
California:
0.7% ($4,831)
Median real estate property taxes paid for housing units with mortgages in 2022: $5,454 (0.8%) Median real estate property taxes paid for housing units with no mortgage in 2022: $3,844 (0.7%)
Averages for the 2020 tax year for zip code 95603, filed in 2021:
Average Adjusted Gross Income (AGI) in 2020: $90,745 (Individual Income Tax Returns)
Here:
$90,745
State:
$95,910
Salary/wage: $73,558 (reported on 71.0% of returns)
Here:
$73,558
State:
$77,331
(% of AGI for various income ranges: 1168.5% for AGIs below $25k, 3622.2% for AGIs $25k-50k, 6378.0% for AGIs $50k-75k, 9254.2% for AGIs $75k-100k, 18763.9% for AGIs $100k-200k, 79779.0% for AGIs over 200k)
Taxable interest for individuals: $1,418 (reported on 47.3% of returns)
This zip code:
$1,418
California:
$2,294
(% of AGI for various income ranges: 28.3% for AGIs below $25k, 40.1% for AGIs $25k-50k, 79.1% for AGIs $50k-75k, 132.0% for AGIs $75k-100k, 187.8% for AGIs $100k-200k, 1158.0% for AGIs over 200k)
Ordinary dividends: $7,436 (reported on 25.9% of returns)
Here:
$7,436
State:
$10,949
(% of AGI for various income ranges: 48.4% for AGIs below $25k, 86.6% for AGIs $25k-50k, 206.1% for AGIs $50k-75k, 265.0% for AGIs $75k-100k, 575.6% for AGIs $100k-200k, 3961.0% for AGIs over 200k)
Net capital gain/loss in AGI: +$22,031 (reported on 25.0% of returns)
Here:
+$22,031
State:
+$49,306
(% of AGI for various income ranges: 15.5% for AGIs below $25k, 58.9% for AGIs $25k-50k, 160.4% for AGIs $50k-75k, 301.2% for AGIs $75k-100k, 849.9% for AGIs $100k-200k, 19425.7% for AGIs over 200k)
Profit/loss from business: +$18,784 (reported on 17.6% of returns)
Here:
+$18,784
State:
+$15,671
(% of AGI for various income ranges: 143.7% for AGIs below $25k, 315.0% for AGIs $25k-50k, 411.2% for AGIs $50k-75k, 635.1% for AGIs $75k-100k, 861.1% for AGIs $100k-200k, 5193.7% for AGIs over 200k)
Taxable individual retirement arrangement distribution: $23,049 (reported on 13.4% of returns)
95603:
$23,049
California:
$23,505
(% of AGI for various income ranges: 91.6% for AGIs below $25k, 194.2% for AGIs $25k-50k, 433.3% for AGIs $50k-75k, 605.1% for AGIs $75k-100k, 1298.5% for AGIs $100k-200k, 3489.7% for AGIs over 200k)
Self-employed (Keogh) retirement plans: $22,815 (reported on 1.0% of returns)
95603:
$22,815
California:
$30,163
(% of AGI for various income ranges: 48.0% for AGIs $50k-75k, 60.9% for AGIs $100k-200k, 556.7% for AGIs over 200k)
Total itemized deductions: $32,008 (reported on 18.0% of returns)
Here:
$32,008
State:
$39,517
(% of AGI for various income ranges: 138.0% for AGIs below $25k, 268.2% for AGIs $25k-50k, 713.1% for AGIs $50k-75k, 1187.0% for AGIs $75k-100k, 2176.3% for AGIs $100k-200k, 8666.3% for AGIs over 200k)
Charity contributions: $7,348 (reported on 15.1% of returns)
Here:
$7,348
State:
$12,598
(% of AGI for various income ranges: 6.0% for AGIs below $25k, 24.8% for AGIs $25k-50k, 70.0% for AGIs $50k-75k, 139.5% for AGIs $75k-100k, 350.6% for AGIs $100k-200k, 2723.0% for AGIs over 200k)
Taxes paid: $8,568 (reported on 18.0% of returns)
95603:
$8,568
State:
$8,807
(% of AGI for various income ranges: 23.0% for AGIs below $25k, 56.8% for AGIs $25k-50k, 192.4% for AGIs $50k-75k, 361.4% for AGIs $75k-100k, 677.2% for AGIs $100k-200k, 1979.3% for AGIs over 200k)
Earned income credit: $1,674 (reported on 9.6% of returns)
Here:
$1,674
State:
$2,074
(% of AGI for various income ranges: 57.3% for AGIs below $25k, 49.6% for AGIs $25k-50k)
Percentage of individuals using paid preparers for their 2020 taxes: 93.5%
Here:
94%
State:
92%
(% for various income ranges: 91.7% for AGIs below $25k, 93.5% for AGIs $25k-50k, 93.8% for AGIs $50k-75k, 93.4% for AGIs $75k-100k, 94.7% for AGIs $100k-200k, 96.5% for AGIs over 200k)
Averages for the 2012 tax year for zip code 95603, filed in 2013:
Average Adjusted Gross Income (AGI) in 2012: $64,784 (Individual Income Tax Returns)
Here:
$64,784
State:
$72,726
Salary/wage: $53,366 (reported on 73.4% of returns)
Here:
$53,366
State:
$59,079
(% of AGI for various income ranges: 63.9% for AGIs below $25k, 65.0% for AGIs $25k-50k, 62.6% for AGIs $50k-75k, 63.3% for AGIs $75k-100k, 66.9% for AGIs $100k-200k, 47.1% for AGIs over 200k)
Taxable interest for individuals: $1,500 (reported on 46.9% of returns)
This zip code:
$1,500
California:
$2,146
(% of AGI for various income ranges: 2.1% for AGIs below $25k, 1.2% for AGIs $25k-50k, 1.0% for AGIs $50k-75k, 1.0% for AGIs $75k-100k, 0.9% for AGIs $100k-200k, 1.1% for AGIs over 200k)
Ordinary dividends: $5,237 (reported on 26.2% of returns)
Here:
$5,237
State:
$9,308
(% of AGI for various income ranges: 2.8% for AGIs below $25k, 2.1% for AGIs $25k-50k, 2.1% for AGIs $50k-75k, 1.7% for AGIs $75k-100k, 1.9% for AGIs $100k-200k, 2.3% for AGIs over 200k)
Net capital gain/loss in AGI: +$7,261 (reported on 22.2% of returns)
Here:
+$7,261
State:
+$30,460
(% of AGI for various income ranges: 0.2% for AGIs $25k-50k, 0.4% for AGIs $50k-75k, 0.8% for AGIs $75k-100k, 1.8% for AGIs $100k-200k, 7.1% for AGIs over 200k)
Profit/loss from business: +$18,053 (reported on 17.7% of returns)
Here:
+$18,053
State:
+$17,064
(% of AGI for various income ranges: 8.3% for AGIs below $25k, 5.1% for AGIs $25k-50k, 4.9% for AGIs $50k-75k, 4.6% for AGIs $75k-100k, 4.0% for AGIs $100k-200k, 5.2% for AGIs over 200k)
Taxable individual retirement arrangement distribution: $17,380 (reported on 14.2% of returns)
95603:
$17,380
California:
$19,557
(% of AGI for various income ranges: 3.9% for AGIs below $25k, 4.4% for AGIs $25k-50k, 3.9% for AGIs $50k-75k, 4.1% for AGIs $75k-100k, 4.2% for AGIs $100k-200k, 2.8% for AGIs over 200k)
Self-employment retirement plans: $18,915 (reported on 1.1% of returns)
95603:
$18,915
California:
$24,530
(% of AGI for various income ranges: 0.5% for AGIs $50k-75k, 0.3% for AGIs $100k-200k, 0.6% for AGIs over 200k)
Total itemized deductions: $27,285 (24% of AGI, reported on 41.7% of returns)
Here:
$27,285
State:
$34,004
Here:
24.1% of AGI
State:
22.7% of AGI
(% of AGI for various income ranges: 16.5% for AGIs below $25k, 16.2% for AGIs $25k-50k, 15.8% for AGIs $50k-75k, 18.6% for AGIs $75k-100k, 19.0% for AGIs $100k-200k, 17.1% for AGIs over 200k)
Charity contributions: $3,496 (reported on 35.9% of returns)
Here:
$3,496
State:
$4,659
(% of AGI for various income ranges: 1.1% for AGIs below $25k, 1.2% for AGIs $25k-50k, 1.5% for AGIs $50k-75k, 2.1% for AGIs $75k-100k, 2.2% for AGIs $100k-200k, 2.3% for AGIs over 200k)
Taxes paid: $10,311 (reported on 41.6% of returns)
95603:
$10,311
State:
$14,448
(% of AGI for various income ranges: 3.5% for AGIs below $25k, 3.5% for AGIs $25k-50k, 4.6% for AGIs $50k-75k, 6.1% for AGIs $75k-100k, 7.5% for AGIs $100k-200k, 9.2% for AGIs over 200k)
Earned income credit: $1,841 (reported on 13.2% of returns)
Here:
$1,841
State:
$2,286
(% of AGI for various income ranges: 4.2% for AGIs below $25k, 0.7% for AGIs $25k-50k)
Percentage of individuals using paid preparers for their 2012 taxes: 56.3%
Here:
56%
State:
64%
(% for various income ranges: 46.1% for AGIs below $25k, 54.7% for AGIs $25k-50k, 62.6% for AGIs $50k-75k, 64.1% for AGIs $75k-100k, 66.7% for AGIs $100k-200k, 78.8% for AGIs over 200k)
Averages for the 2004 tax year for zip code 95603, filed in 2005:
Average Adjusted Gross Income (AGI) in 2004: $55,707 (Individual Income Tax Returns)
Here:
$55,707
State:
$58,600
Salary/wage: $47,201 (reported on 74.6% of returns)
Here:
$47,201
State:
$49,455
(% of AGI for various income ranges: 247.1% for AGIs below $10k, 63.0% for AGIs $10k-25k, 67.0% for AGIs $25k-50k, 67.5% for AGIs $50k-75k, 68.6% for AGIs $75k-100k, 57.1% for AGIs over 100k)
Taxable interest for individuals: $1,991 (reported on 58.7% of returns)
This zip code:
$1,991
California:
$2,365
(% of AGI for various income ranges: 22.3% for AGIs below $10k, 3.6% for AGIs $10k-25k, 2.5% for AGIs $25k-50k, 1.7% for AGIs $50k-75k, 1.9% for AGIs $75k-100k, 1.7% for AGIs over 100k)
Taxable dividends: $3,141 (reported on 32.4% of returns)
Here:
$3,141
State:
$4,746
(% of AGI for various income ranges: 15.7% for AGIs below $10k, 2.4% for AGIs $10k-25k, 2.1% for AGIs $25k-50k, 1.5% for AGIs $50k-75k, 1.7% for AGIs $75k-100k, 1.7% for AGIs over 100k)
Net capital gain/loss: +$13,763 (reported on 28.2% of returns)
Here:
+$13,763
State:
+$23,418
(% of AGI for various income ranges: -11.2% for AGIs below $10k, -0.1% for AGIs $10k-25k, 0.7% for AGIs $25k-50k, 1.3% for AGIs $50k-75k, 2.2% for AGIs $75k-100k, 13.5% for AGIs over 100k)
Profit/loss from business: +$19,788 (reported on 19.7% of returns)
Here:
+$19,788
State:
+$16,826
(% of AGI for various income ranges: 15.0% for AGIs below $10k, 7.7% for AGIs $10k-25k, 6.1% for AGIs $25k-50k, 6.2% for AGIs $50k-75k, 6.1% for AGIs $75k-100k, 7.7% for AGIs over 100k)
IRA payment deduction: $3,163 (reported on 3.5% of returns)
95603:
$3,163
California:
$3,192
(% of AGI for various income ranges: 1.1% for AGIs below $10k, 0.2% for AGIs $10k-25k, 0.3% for AGIs $25k-50k, 0.3% for AGIs $50k-75k, 0.3% for AGIs $75k-100k, 0.1% for AGIs over 100k)
Self-employed pension: $14,168 (reported on 2.2% of returns)
Here:
$14,168
California:
$17,688
(% of AGI for various income ranges: 1.8% for AGIs below $10k, 0.3% for AGIs $25k-50k, 0.4% for AGIs $50k-75k, 0.3% for AGIs $75k-100k, 0.8% for AGIs over 100k)
Total itemized deductions: $23,755 (25% of AGI, reported on 44.7% of returns)
Here:
$23,755
State:
$28,113
Here:
25.2% of AGI
State:
25.3% of AGI
(% of AGI for various income ranges: 49.2% for AGIs below $10k, 15.6% for AGIs $10k-25k, 16.9% for AGIs $25k-50k, 21.5% for AGIs $50k-75k, 22.2% for AGIs $75k-100k, 18.2% for AGIs over 100k)
Charity contributions deductions: $3,246 (3% of AGI, reported on 41.2% of returns)
Here:
$3,246
State:
$3,923
Here:
3.3% of AGI
State:
3.3% of AGI
(% of AGI for various income ranges: 2.2% for AGIs below $10k, 1.3% for AGIs $10k-25k, 1.6% for AGIs $25k-50k, 2.4% for AGIs $50k-75k, 2.7% for AGIs $75k-100k, 2.7% for AGIs over 100k)
Total tax: $8,643 (reported on 81.0% of returns)
95603:
$8,643
State:
$10,761
(% of AGI for various income ranges: 10.0% for AGIs below $10k, 5.0% for AGIs $10k-25k, 7.7% for AGIs $25k-50k, 9.1% for AGIs $50k-75k, 10.3% for AGIs $75k-100k, 17.0% for AGIs over 100k)
Earned income credit: $1,403 (reported on 9.6% of returns)
Here:
$1,403
State:
$1,763
Percentage of individuals using paid preparers for their 2004 taxes: 64.1%
Here:
64%
State:
66%
(% for various income ranges: 52.0% for AGIs below $10k, 60.8% for AGIs $10k-25k, 64.5% for AGIs $25k-50k, 70.0% for AGIs $50k-75k, 70.4% for AGIs $75k-100k, 73.1% for AGIs over 100k)
Household received Food Stamps/SNAP in the past 12 months: 959 Household did not receive Food Stamps/SNAP in the past 12 months: 11,155
Women who had a birth in the past 12 months: 179 (59 now married, 121 unmarried) Women who did not have a birth in the past 12 months: 5,103 (2,147 now married, 2,950 unmarried)
Housing units in zip code 95603 with a mortgage: 4,634 (508 second mortgage, 5 home equity loan, 387 both second mortgage and home equity loan) Houses without a mortgage: 34
Median monthly owner costs for units with a mortgage: $2,579 Median monthly owner costs for units without a mortgage: $839
Residents with income below the poverty level in 2022:
This zip code:
12.7%
Whole state:
12.2%
Residents with income below 50% of the poverty level in 2022:
This zip code:
6.5%
Whole state:
6.2%
Median number of rooms in houses and condos:
Here:
6.3
State:
6.0
Median number of rooms in apartments:
Here:
4.1
State:
3.9
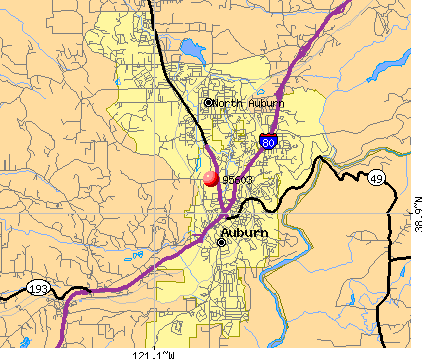
Notable locations in this zip code not listed on our city pages
Notable locations in zip code 95603: Gasoline Alley (A), DeWitt Government Center (B), Auburn Waste Water Treatment Facility (C), Angus Hills Golf Course (D), Veterans Memorial Hall (E), Placer County Historical Museum (F), Placer County Courthouse (G), Auburn-Placer County Library (H), Auburn City Hall (I), Applegate Branch Auburn-Placer County Library (J), Lubeck Mansion (K), California Shock Trauma Air Rescue (L), Auburn City Fire Department Station 2 Gietzen (M), Placer County Fire Department Station 85 / Placer Hills Fire Department Station 2 (N), Placer County Fire Department Station 182 / Ophir Fire Department (O), Placer County Fire Department Station 180 Atwood (P), Auburn City Fire Department Station 3 Maidu (Q), Auburn City Fire Department Station 1 Martin Park (R), Mount Vernon Community Hall (S). Display/hide their locations on the map
Parks in zip code 95603 include: Spring Meadows Park (1), Auburn State Recreation Area (2), Ashford Park (3), Auburn Recreation Park (4), Gold Country Fairgrounds (5), McCann Stadium (6), Old Auburn Historic District (7). Display/hide their locations on the map
2,987 married couples with children.
1,488 single-parent households (458 men, 1,030 women).
87.7% of residents of 95603 zip code speak English at home.
9.4% of residents speak Spanish at home (61% very well, 22% well, 16% not well, 1% not at all).
1.9% of residents speak other Indo-European language at home (75% very well, 10% well, 15% not well).
0.6% of residents speak Asian or Pacific Island language at home (41% very well, 37% well, 22% not well).
0.1% of residents speak other language at home (71% very well, 29% well).
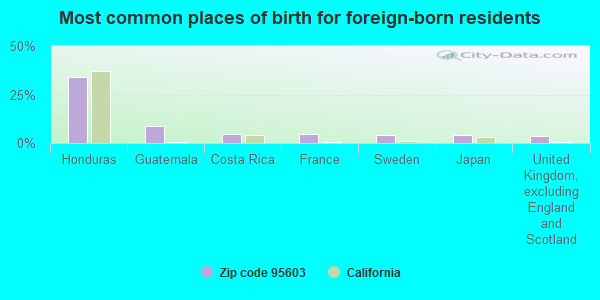
Foreign born population: 2,348 (8.3%) (38.3% of them are naturalized citizens)
This zip code:
8.3%
Whole state:
26.7%
34%Honduras
9%Guatemala
5%Costa Rica
5%France
4%Sweden
4%Japan
4%United Kingdom, excluding England and Scotland
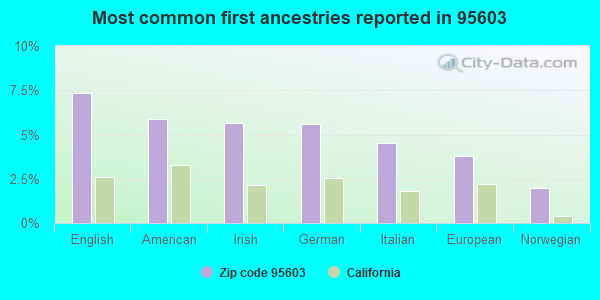
7%English
6%American
6%Irish
6%German
5%Italian
4%European
2%Norwegian
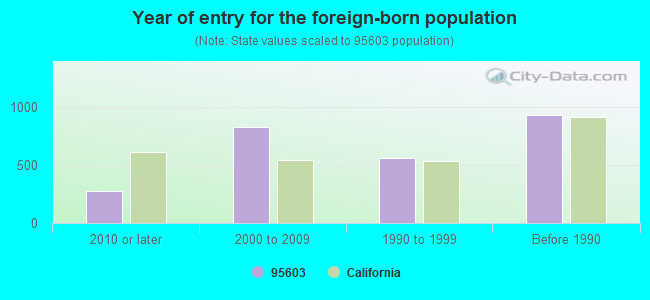
Year of entry for the foreign-born population
2752010 or later
8282000 to 2009
5591990 to 1999
930Before 1990
Major facilities with environmental interests located in this zip code:
AMERICAN BODY AND FRAME (120 BORLAND AVE in AUBURN, CA)
STATE MASTER (California - Hazardous Waste Tracking) - HAZARDOU WASTE PROGRAM Small Quantity Generators, between 100 kg and 1000 kg of hazardous waste/month (Resource Conservation and Recovery Act (tracking hazardous waste)) - notification Business NAICS classification: GENERAL AUTOMOTIVE REPAIR. Organizations: JERRY MYERS (CONTACT/OWNER)
CALTRANS DISTRICT 03 (1050 GRASS VALLEY HWY in AUBURN, CA)
STATE MASTER (California - Hazardous Waste Tracking) - HAZARDOU WASTE PROGRAM Small Quantity Generators, between 100 kg and 1000 kg of hazardous waste/month (Resource Conservation and Recovery Act (tracking hazardous waste)) - notification Organizations: CALIFORNIA DEPT OF TRANSPORTATION (CONTACT/OWNER)
Alternative names: CALTRANS DISTRICT 3
JAKE TOMLINSON AND CA (13810 LINCOLN WAY in AUBURN, CA)
STATE MASTER (California - Hazardous Waste Tracking) - HAZARDOU WASTE PROGRAM Small Quantity Generators, between 100 kg and 1000 kg of hazardous waste/month (Resource Conservation and Recovery Act (tracking hazardous waste)) - notification Organizations: JAKE JEANETTE TOMLINSON (CONTACT/OWNER)
EQUILON ENTERPRISES (13436 LINCOLN WY in AUBURN, CA) . Federal Facility
STATE MASTER (California - Hazardous Waste Tracking) - HAZARDOU WASTE PROGRAM Small Quantity Generators, between 100 kg and 1000 kg of hazardous waste/month (Resource Conservation and Recovery Act (tracking hazardous waste)) - notification Organizations: EQUILON ENTERPRISES, LLC (CONTACT/OWNER)
Alternative names: SHELL OIL CO
EQUILON ENTERPRISES (1650 LINCOLN WAY in AUBURN, CA) . Federal Facility
STATE MASTER (California - Hazardous Waste Tracking) - HAZARDOU WASTE PROGRAM Small Quantity Generators, between 100 kg and 1000 kg of hazardous waste/month (Resource Conservation and Recovery Act (tracking hazardous waste)) - notification Organizations: EQUILON ENTERPRISES, LLC (CONTACT/OWNER)
Alternative names: SHELL OIL CO
EQUILON ENTERPRISES (390 GRASS VALLEY HWY in AUBURN, CA) . Federal Facility
STATE MASTER (California - Hazardous Waste Tracking) - HAZARDOU WASTE PROGRAM Small Quantity Generators, between 100 kg and 1000 kg of hazardous waste/month (Resource Conservation and Recovery Act (tracking hazardous waste)) - notification Organizations: EQUILON ENTERPRISES, LLC (CONTACT/OWNER)
Alternative names: SHELL OIL CO
HALLS AUTOMOTIVE (345 SACRAMENTO ST in AUBURN, CA)
STATE MASTER (California - Hazardous Waste Tracking) - HAZARDOU WASTE PROGRAM Small Quantity Generators, between 100 kg and 1000 kg of hazardous waste/month (Resource Conservation and Recovery Act (tracking hazardous waste)) - notification Business NAICS classification: OTHER AUTOMOTIVE MECHANICAL AND ELECTRICAL REPAIR AND MAINTENANCE. Organizations: DEAN ALLEN TRACY (CONTACT/OWNER)
MAGNUSSEN S AUBURN TOYOTA (800 NEVADA ST in AUBURN, CA)
STATE MASTER (California - Hazardous Waste Tracking) - HAZARDOU WASTE PROGRAM Small Quantity Generators, between 100 kg and 1000 kg of hazardous waste/month (Resource Conservation and Recovery Act (tracking hazardous waste)) - notification Organizations: BERNARD MAGNUSSEN (CONTACT/OWNER)
Alternative names: MAGNUSSEN'S AUBURN TOYOTA
CHEVRON STATION NO 99375 (13381 LINCOLN WAY in AUBURN, CA)
STATE MASTER (California - Hazardous Waste Tracking) - HAZARDOU WASTE PROGRAM Small Quantity Generators, between 100 kg and 1000 kg of hazardous waste/month (Resource Conservation and Recovery Act (tracking hazardous waste)) - notification Organizations: CHEVRON PRODUCTS CO (CONTACT/OWNER)
ADOLESCENT DAY TREATMENT AT DEWITT (11484 B AVE. in AUBURN, CA)
(National Center for Education Statistics) - STATE ID-3130093 Organizations: PLACER UNION HIGH (SCHOOL DISTRICT)
ALTA VISTA ELEMENTARY (173 OAK ST. in AUBURN, CA)
(National Center for Education Statistics) - STATE ID-6031025 Organizations: AUBURN UNION ELEMENTARY (SCHOOL DISTRICT)
INCREDIBLE PETS (2120 GRASS VALLEY HIGHWAY in AUBURN, CA)
(Integrated Compliance Information System) - ICIS-09-2004-0083, FORMAL ENFORCEMENT ACTION COMPLIANCE ACTIVITY (Tracking inspections of insecticide, fungicide, and rodenticide, and toxic substances)
HONOUR SCHAPS/ALDER GROVER (360 NEVADA ST. in AUBURN, CA)
(National Center for Education Statistics) - STATE ID-3130101 Organizations: PLACER CO. OFFICE OF EDUCATION (SCHOOL DISTRICT)
Housing units lacking complete plumbing facilities: 0.4% Housing units lacking complete kitchen facilities: 1.1%
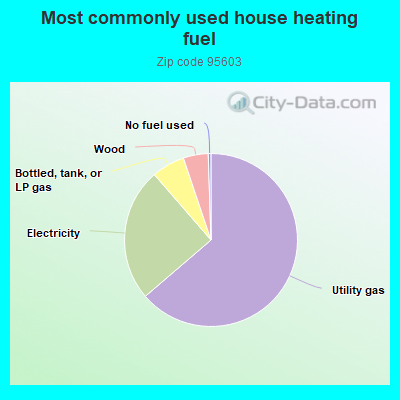
62.9%Utility gas
24.6%Electricity
6.1%Bottled, tank, or LP gas
4.6%Wood
0.5%No fuel used
Population in 1990: 32,535.
Place of birth for U.S.-born residents:
This state: 19,512
Northeast: 1,417
Midwest: 1,726
South: 1,267
West: 1,466
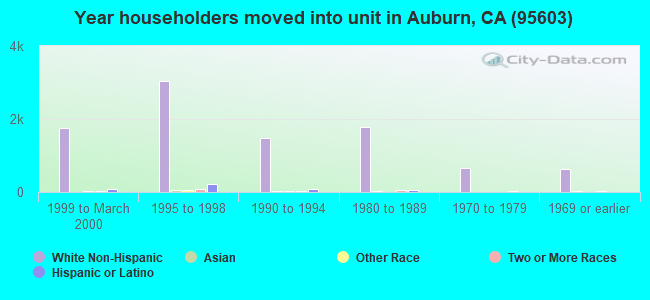
52% of the 95603 zip code residents lived in the same house 5 years ago. Out of people who lived in different houses, 58% lived in this county. Out of people who lived in different counties, 50% lived in California.
87% of the 95603 zip code residents lived in the same house 1 year ago. Out of people who lived in different houses, 43% moved from this county. Out of people who lived in different houses, 47% moved from different county within same state. Out of people who lived in different houses, 7% moved from different state. Out of people who lived in different houses, 1% moved from abroad.
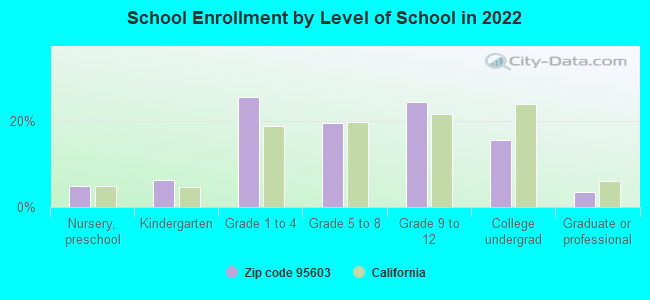
Private vs. public school enrollment:
Students in private schools in grades 1 to 8 (elementary and middle school): 143
Here:
6.5%
California:
10.5%
Students in private schools in grades 9 to 12 (high school): 55
Here:
4.5%
California:
8.5%
Students in private undergraduate colleges: 149
Here:
19.3%
California:
15.9%
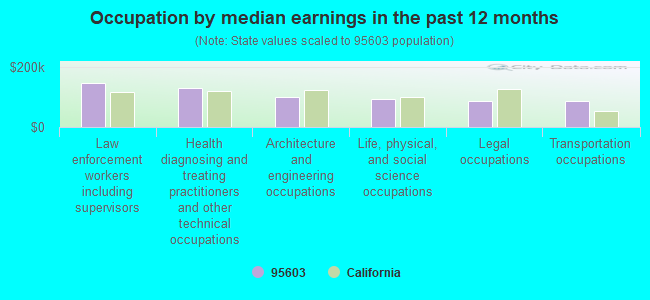
Occupation by median earnings in the past 12 months ($)
147,471Law enforcement workers including supervisors
130,456Health diagnosing and treating practitioners and other technical occupations
100,238Architecture and engineering occupations
94,241Life, physical, and social science occupations
86,633Legal occupations
86,592Transportation occupations
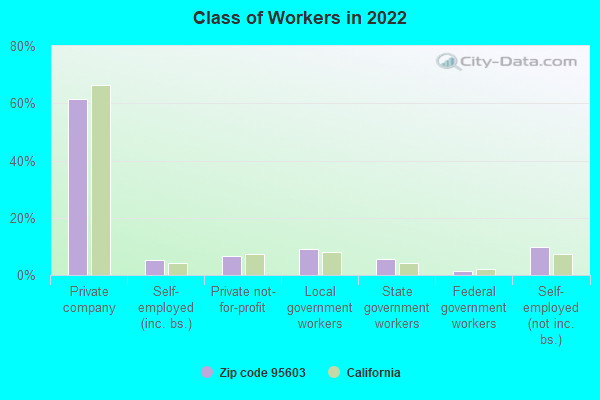
Companies with federal contracts located in this zip code (AUBURN, CA):
PHILIP HAWKINS ARCHITECT, INC (2280 GRASS VALLEY HWY # 27; small business) : $368,818 in 2 contractsfrom 2005 to 2006
$354,683 with Air Force for Maintenance, Repair or Alteration of Real Property -- Other Industrial Buildings. Signed on 2005-09-22. Completion date: 2006-02-14.
$14,135, same as above.Signed on 2006-03-09. Completion date: 2006-03-31.
JAMES J OAKHAM JR (1238 GRIZZLY FLAT COURT; small business) : $71,495 in 13 contractsfrom 1999 to 2006
Contracts for Real Property Appraisals Services (SIC 6531) by Army, U.S. Fish and Wildlife Service Signed by year:2000: $6,000; 2001: $21,000; 2002: $14,380; 2003: $7,040; 2004: $600; 2005: $6,800; 2006: $12,675.
Biggest contracts:
$11,975 with Army for Real Property Appraisals Services (SIC 6531). Signed on 2006-04-21. Completion date: 2006-06-28.
$11,000 with U.S. Fish and Wildlife Service for Real Property Appraisals Services (SIC 6531). Signed on 2001-02-15. Completion date: 2001-06-15.
$10,000, same as above.Signed on 2001-09-15. Completion date: 2001-11-15.
$8,000, same as above.Signed on 2002-05-15. Completion date: 2002-07-15.
VIAN ENTERPRISES, INC (1501 INDUSTRIAL DR; small business) : $20,600 in 2 contractsfrom 2004 to 2005
$12,000 with Navy for Maintenance, Repair and Rebuilding of Equipment -- Pumps and Compressors. Signed on 2004-12-13. Completion date: 2005-09-30.
$8,600 with Navy for Miscellaneous Aircraft Accessories and Components. Signed on 2005-04-22. Completion date: 2005-08-19.
AQUA SIERRA CONTROLS INC. (1650 INDUSTRIAL DR.; small business) : $18,620 in 2 contractsin 2000
$15,000 with Air Force for Maintenance, Repair or Alteration of Real Property -- Dams. Signed on 2000-01-19. Completion date: 2000-03-05.
$3,620, same as above.Signed on 2000-05-10. Completion date: 2000-04-14.
DELIVERUS NETWORK INC (2945 BELL ROAD; small business)
$4,800 with Navy for ADP Central Processing Unit (CPU, Computer), Analog. Signed on 2006-06-30. Completion date: 2006-07-14.
FOSTER TECHNOLOGY (1581 CORNELL WAY; small business)
-$30,000 with Air Force for Maintenance, Repair and Rebuilding of Equipment -- Instruments and Laboratory Equipment. Signed on 1999-12-28. Completion date: 1999-09-30.
Top industries in this zip code by the number of employees in 2005:
2002 - 2018 National Fire Incident Reporting System (NFIRS) incidents
According to the data from the years 2002 - 2018 the average number of fires per year is 127. The highest number of reported fires - 242 took place in 2008, and the least - 0 in 2003. The data has a growing trend.
When looking into fire subcategories, the most reports belonged to: Outside Fires (50.3%), and Structure Fires (25.0%).
Fire incident types reported to NFIRS in Zip Code 95603


 Nearest zip codes: 95602, 95658, 95722, 95614, 95663, 95664.


 According to the data from the years 2002 - 2018 the average number of fires per year is 127. The highest number of reported fires - 242 took place in 2008, and the least - 0 in 2003. The data has a growing trend.
 When looking into fire subcategories, the most reports belonged to: Outside Fires (50.3%), and Structure Fires (25.0%).