Estimated zip code population in 2022: 2,493 Zip code population in 2010: 2,443 Zip code population in 2000: 2,214
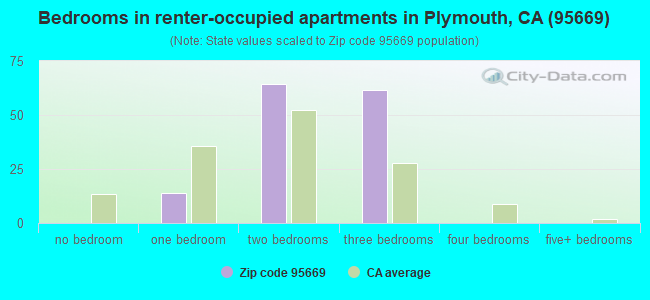
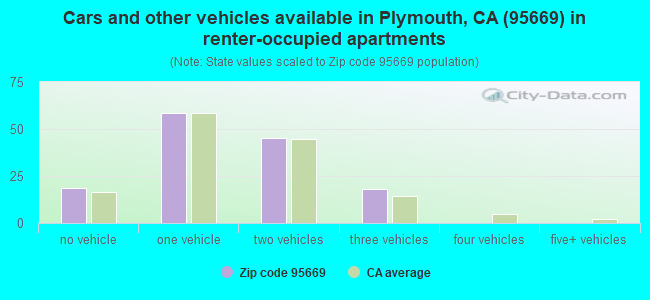
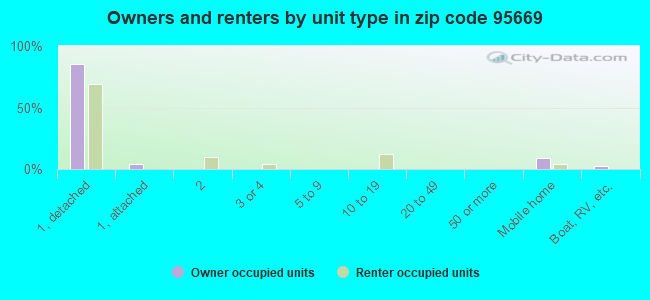
Houses and condos: 1,089 Renter-occupied apartments: 140
% of renters here:
14%
State:
44%
March 2022 cost of living index in zip code 95669: 97.7 (near average, U.S. average is 100)
Land area: 88.3 sq. mi. Water area: 0.1 sq. mi.
Population density: 28 people per square mile
(very low).
OSM Map
General Map
Google Map
MSN Map
OSM Map
General Map
Google Map
MSN Map
OSM Map
General Map
Google Map
MSN Map
OSM Map
General Map
Google Map
MSN Map
Please wait while loading the map...
Real estate property taxes paid for housing units in 2022:
This zip code:
0.5% ($3,261)
California:
0.7% ($4,831)
Median real estate property taxes paid for housing units with mortgages in 2022: $3,815 (0.6%) Median real estate property taxes paid for housing units with no mortgage in 2022: $3,201 (0.5%)
Business Search- 14 Million verified businesses
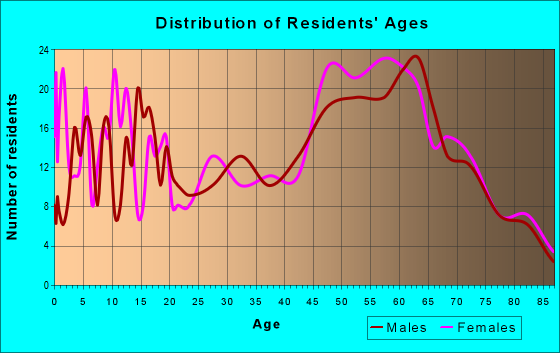
Males: 1,320
(53.0%)
Females: 1,172
(47.0%)
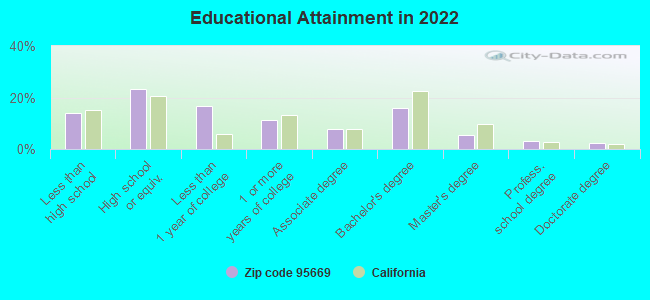
For population 25 years and over in 95669:
High school or higher: 85.5%
Bachelor's degree or higher: 26.8%
Graduate or professional degree: 10.8%
Unemployed: 11.0%
Mean travel time to work (commute): 23.6 minutes
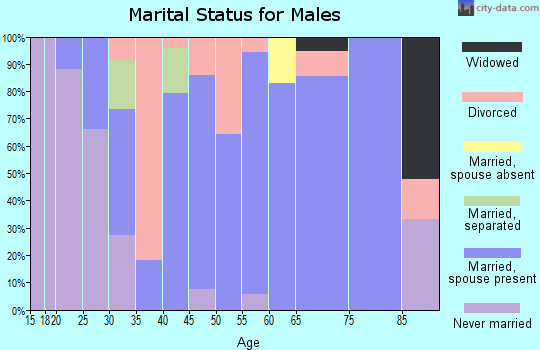
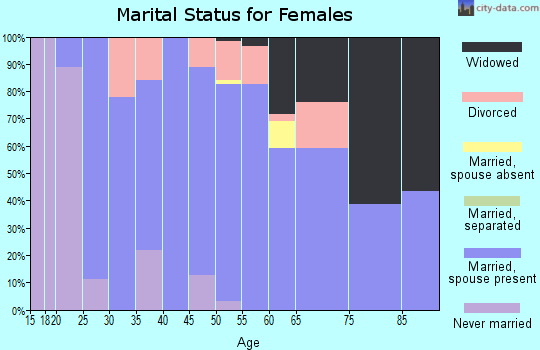
For population 15 years and over in 95669:
Never married: 31.4%
Now married: 50.7%
Separated: 0.0%
Widowed: 5.6%
Divorced: 12.3%
Zip code 95669 compared to state average:
Unemployed percentage above state average.
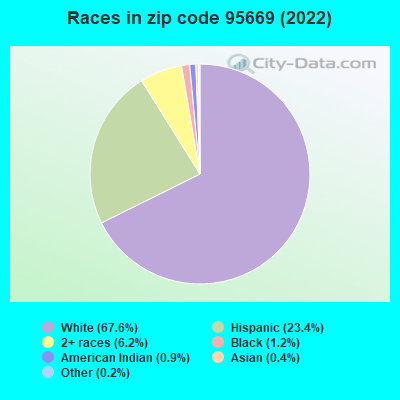
Black race population percentage significantly below state average.
Median age significantly above state average.
Foreign-born population percentage below state average.
Renting percentage significantly below state average.
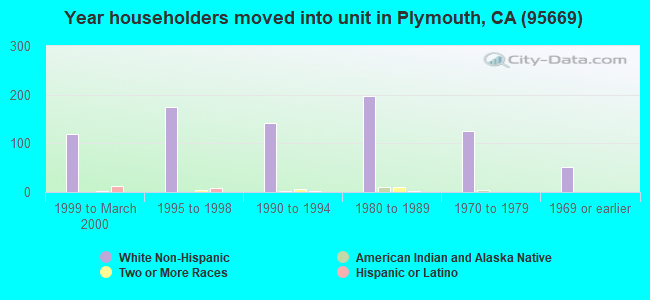
Length of stay since moving in above state average.
Estimated median house/condo value in 2022: $597,760
95669:
$597,760
California:
$715,900
Median resident age:
This zip code:
48.0 years
California median age:
37.9 years
Average household size:
This zip code:
2.5 people
California:
2.8 people
Averages for the 2020 tax year for zip code 95669, filed in 2021:
Average Adjusted Gross Income (AGI) in 2020: $94,427 (Individual Income Tax Returns)
Here:
$94,427
State:
$95,910
Salary/wage: $65,495 (reported on 72.0% of returns)
Here:
$65,495
State:
$77,331
(% of AGI for various income ranges: 1236.0% for AGIs below $25k, 4166.3% for AGIs $25k-50k, 7236.7% for AGIs $50k-75k, 10000.0% for AGIs $75k-100k, 17122.3% for AGIs $100k-200k, 74445.0% for AGIs over 200k)
Taxable interest for individuals: $1,058 (reported on 47.0% of returns)
This zip code:
$1,058
California:
$2,294
(% of AGI for various income ranges: 62.0% for AGIs below $25k, 35.8% for AGIs $25k-50k, 45.8% for AGIs $50k-75k, 68.3% for AGIs $75k-100k, 175.4% for AGIs $100k-200k, 700.0% for AGIs over 200k)
Ordinary dividends: $7,937 (reported on 22.7% of returns)
Here:
$7,937
State:
$10,949
(% of AGI for various income ranges: 101.0% for AGIs below $25k, 52.1% for AGIs $25k-50k, 139.2% for AGIs $50k-75k, 281.7% for AGIs $75k-100k, 566.2% for AGIs $100k-200k, 5040.0% for AGIs over 200k)
Net capital gain/loss in AGI: +$26,677 (reported on 22.7% of returns)
Here:
+$26,677
State:
+$49,306
(% of AGI for various income ranges: 10.5% for AGIs below $25k, 101.6% for AGIs $25k-50k, 107.5% for AGIs $50k-75k, 383.3% for AGIs $75k-100k, 953.1% for AGIs $100k-200k, 30955.0% for AGIs over 200k)
Profit/loss from business: +$11,865 (reported on 17.4% of returns)
Here:
+$11,865
State:
+$15,671
(% of AGI for various income ranges: 133.5% for AGIs below $25k, 452.5% for AGIs $50k-75k, 548.3% for AGIs $75k-100k, 580.8% for AGIs $100k-200k, 4450.0% for AGIs over 200k)
Taxable individual retirement arrangement distribution: $29,019 (reported on 12.1% of returns)
95669:
$29,019
California:
$23,505
(% of AGI for various income ranges: 97.0% for AGIs below $25k, 146.3% for AGIs $25k-50k, 478.3% for AGIs $50k-75k, 1159.2% for AGIs $100k-200k, 10450.0% for AGIs over 200k)
Total itemized deductions: $30,917 (reported on 13.6% of returns)
Here:
$30,917
State:
$39,517
(% of AGI for various income ranges: 349.0% for AGIs below $25k, 1030.0% for AGIs $50k-75k, 1789.2% for AGIs $100k-200k, 6525.0% for AGIs over 200k)
Charity contributions: $6,757 (reported on 10.6% of returns)
Here:
$6,757
State:
$12,598
(% of AGI for various income ranges: 22.0% for AGIs below $25k, 194.2% for AGIs $50k-75k, 257.7% for AGIs $100k-200k, 1670.0% for AGIs over 200k)
Taxes paid: $8,039 (reported on 13.6% of returns)
95669:
$8,039
State:
$8,807
(% of AGI for various income ranges: 72.5% for AGIs below $25k, 218.3% for AGIs $50k-75k, 526.9% for AGIs $100k-200k, 1775.0% for AGIs over 200k)
Earned income credit: $1,792 (reported on 9.8% of returns)
Here:
$1,792
State:
$2,074
(% of AGI for various income ranges: 65.5% for AGIs below $25k, 53.7% for AGIs $25k-50k)
Percentage of individuals using paid preparers for their 2020 taxes: 92.4%
Here:
92%
State:
92%
(% for various income ranges: 88.6% for AGIs below $25k, 93.3% for AGIs $25k-50k, 95.0% for AGIs $50k-75k, 91.7% for AGIs $75k-100k, 96.2% for AGIs $100k-200k, 88.9% for AGIs over 200k)
Averages for the 2012 tax year for zip code 95669, filed in 2013:
Average Adjusted Gross Income (AGI) in 2012: $63,547 (Individual Income Tax Returns)
Here:
$63,547
State:
$72,726
Salary/wage: $51,068 (reported on 74.6% of returns)
Here:
$51,068
State:
$59,079
(% of AGI for various income ranges: 67.1% for AGIs below $25k, 72.0% for AGIs $25k-50k, 59.2% for AGIs $50k-75k, 65.7% for AGIs $75k-100k, 60.1% for AGIs $100k-200k, 50.3% for AGIs over 200k)
Taxable interest for individuals: $1,620 (reported on 43.0% of returns)
This zip code:
$1,620
California:
$2,146
(% of AGI for various income ranges: 2.1% for AGIs below $25k, 1.7% for AGIs $25k-50k, 1.4% for AGIs $50k-75k, 0.8% for AGIs $75k-100k, 1.4% for AGIs $100k-200k, 0.3% for AGIs over 200k)
Ordinary dividends: $6,333 (reported on 21.1% of returns)
Here:
$6,333
State:
$9,308
(% of AGI for various income ranges: 3.8% for AGIs below $25k, 1.8% for AGIs $25k-50k, 1.7% for AGIs $50k-75k, 1.5% for AGIs $75k-100k, 2.8% for AGIs $100k-200k, 1.7% for AGIs over 200k)
Net capital gain/loss in AGI: +$3,165 (reported on 17.5% of returns)
Here:
+$3,165
State:
+$30,460
(% of AGI for various income ranges: 0.2% for AGIs $50k-75k, 3.2% for AGIs over 200k)
Profit/loss from business: +$13,505 (reported on 16.7% of returns)
Here:
+$13,505
State:
+$17,064
(% of AGI for various income ranges: 7.3% for AGIs below $25k, 7.0% for AGIs $25k-50k, 8.5% for AGIs $50k-75k, 3.2% for AGIs $100k-200k)
Taxable individual retirement arrangement distribution: $14,062 (reported on 14.0% of returns)
95669:
$14,062
California:
$19,557
(% of AGI for various income ranges: 2.9% for AGIs below $25k, 2.2% for AGIs $25k-50k, 4.0% for AGIs $50k-75k, 3.0% for AGIs $75k-100k, 7.0% for AGIs $100k-200k)
Total itemized deductions: $27,802 (23% of AGI, reported on 36.8% of returns)
Here:
$27,802
State:
$34,004
Here:
23.5% of AGI
State:
22.7% of AGI
(% of AGI for various income ranges: 15.7% for AGIs below $25k, 13.5% for AGIs $25k-50k, 14.9% for AGIs $50k-75k, 16.4% for AGIs $75k-100k, 19.6% for AGIs $100k-200k, 15.3% for AGIs over 200k)
Charity contributions: $3,153 (reported on 28.1% of returns)
Here:
$3,153
State:
$4,659
(% of AGI for various income ranges: 0.9% for AGIs $25k-50k, 1.2% for AGIs $50k-75k, 1.5% for AGIs $75k-100k, 1.7% for AGIs $100k-200k, 1.7% for AGIs over 200k)
Taxes paid: $10,867 (reported on 36.8% of returns)
95669:
$10,867
State:
$14,448
(% of AGI for various income ranges: 2.4% for AGIs below $25k, 2.6% for AGIs $25k-50k, 3.8% for AGIs $50k-75k, 5.4% for AGIs $75k-100k, 7.3% for AGIs $100k-200k, 10.0% for AGIs over 200k)
Earned income credit: $2,067 (reported on 13.2% of returns)
Here:
$2,067
State:
$2,286
(% of AGI for various income ranges: 3.8% for AGIs below $25k, 1.3% for AGIs $25k-50k)
Percentage of individuals using paid preparers for their 2012 taxes: 57.0%
Here:
57%
State:
64%
(% for various income ranges: 48.7% for AGIs below $25k, 58.6% for AGIs $25k-50k, 63.2% for AGIs $50k-75k, 60.0% for AGIs $75k-100k, 66.7% for AGIs $100k-200k, 60.0% for AGIs over 200k)
Averages for the 2004 tax year for zip code 95669, filed in 2005:
Average Adjusted Gross Income (AGI) in 2004: $48,794 (Individual Income Tax Returns)
Here:
$48,794
State:
$58,600
Salary/wage: $42,544 (reported on 74.5% of returns)
Here:
$42,544
State:
$49,455
(% of AGI for various income ranges: 61.6% for AGIs $10k-25k, 71.8% for AGIs $25k-50k, 69.9% for AGIs $50k-75k, 68.3% for AGIs $75k-100k, 54.5% for AGIs over 100k)
Taxable interest for individuals: $1,953 (reported on 56.5% of returns)
This zip code:
$1,953
California:
$2,365
(% of AGI for various income ranges: 4.8% for AGIs $10k-25k, 2.6% for AGIs $25k-50k, 1.1% for AGIs $50k-75k, 0.6% for AGIs $75k-100k, 2.2% for AGIs over 100k)
Taxable dividends: $4,135 (reported on 25.6% of returns)
Here:
$4,135
State:
$4,746
(% of AGI for various income ranges: 2.2% for AGIs $10k-25k, 1.2% for AGIs $25k-50k, 0.8% for AGIs $50k-75k, 1.0% for AGIs $75k-100k, 3.3% for AGIs over 100k)
Net capital gain/loss: +$10,933 (reported on 22.9% of returns)
Here:
+$10,933
State:
+$23,418
(% of AGI for various income ranges: -0.3% for AGIs $10k-25k, 0.3% for AGIs $25k-50k, 0.7% for AGIs $50k-75k, 4.3% for AGIs $75k-100k, 10.5% for AGIs over 100k)
Profit/loss from business: +$10,512 (reported on 19.7% of returns)
Here:
+$10,512
State:
+$16,826
(% of AGI for various income ranges: 10.0% for AGIs $10k-25k, 2.1% for AGIs $25k-50k, 7.6% for AGIs $50k-75k, 5.4% for AGIs $75k-100k, 2.8% for AGIs over 100k)
IRA payment deduction: $2,949 (reported on 3.5% of returns)
95669:
$2,949
California:
$3,192
(% of AGI for various income ranges: 0.4% for AGIs $10k-25k, 0.7% for AGIs $50k-75k, 0.1% for AGIs over 100k)
Total itemized deductions: $20,727 (24% of AGI, reported on 38.3% of returns)
Here:
$20,727
State:
$28,113
Here:
24.2% of AGI
State:
25.3% of AGI
(% of AGI for various income ranges: 14.4% for AGIs $10k-25k, 13.6% for AGIs $25k-50k, 16.5% for AGIs $50k-75k, 16.3% for AGIs $75k-100k, 16.2% for AGIs over 100k)
Charity contributions deductions: $2,349 (3% of AGI, reported on 32.2% of returns)
Here:
$2,349
State:
$3,923
Here:
2.6% of AGI
State:
3.3% of AGI
(% of AGI for various income ranges: 1.7% for AGIs $10k-25k, 0.9% for AGIs $25k-50k, 2.0% for AGIs $50k-75k, 1.3% for AGIs $75k-100k, 1.6% for AGIs over 100k)
Total tax: $7,781 (reported on 76.4% of returns)
95669:
$7,781
State:
$10,761
(% of AGI for various income ranges: 4.5% for AGIs $10k-25k, 7.0% for AGIs $25k-50k, 9.7% for AGIs $50k-75k, 11.0% for AGIs $75k-100k, 16.9% for AGIs over 100k)
Earned income credit: $1,600 (reported on 12.7% of returns)
Here:
$1,600
State:
$1,763
Percentage of individuals using paid preparers for their 2004 taxes: 62.0%
Here:
62%
State:
66%
(% for various income ranges: 52.9% for AGIs below $10k, 56.2% for AGIs $10k-25k, 60.8% for AGIs $25k-50k, 65.0% for AGIs $50k-75k, 74.2% for AGIs $75k-100k, 77.4% for AGIs over 100k)
Household received Food Stamps/SNAP in the past 12 months: 74 Household did not receive Food Stamps/SNAP in the past 12 months: 917
Women who had a birth in the past 12 months: 7 (7 now married, 0 unmarried) Women who did not have a birth in the past 12 months: 513 (187 now married, 325 unmarried)
Housing units in zip code 95669 with a mortgage: 465 (17 second mortgage, 18 both second mortgage and home equity loan) Houses without a mortgage: 6
Median monthly owner costs for units with a mortgage: $2,346 Median monthly owner costs for units without a mortgage: $754
Residents with income below the poverty level in 2022:
This zip code:
10.9%
Whole state:
12.2%
Residents with income below 50% of the poverty level in 2022:
This zip code:
0.8%
Whole state:
6.2%
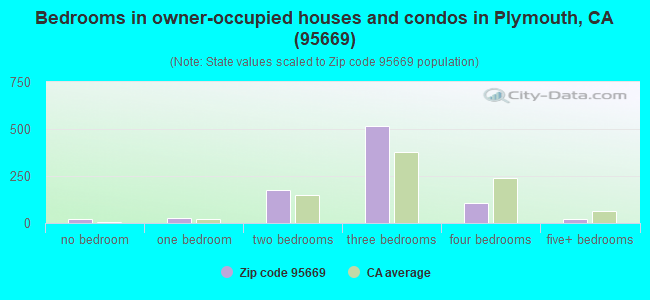
Median number of rooms in houses and condos:
Here:
5.9
State:
6.0
Median number of rooms in apartments:
Here:
4.7
State:
3.9
Notable locations in this zip code not listed on our city pages
Streams, rivers, and creeks: Horse Creek (A), South Fork Cosumnes River (B), Willow Springs Creek (C), Spring Valley Branch (D), Pigeon Creek (E), Little Indian Creek (F), Slate Creek (G). Display/hide their locations on the map
Size of family households: 426 2-persons, 76 3-persons, 52 4-persons, 69 5-persons, 17 6-persons, 23 7-or-more-persons
Size of nonfamily households: 289 1-person, 55 2-persons
244 married couples with children.
69 single-parent households (24 men, 45 women).
79.2% of residents of 95669 zip code speak English at home.
16.9% of residents speak Spanish at home (59% very well, 19% well, 19% not well, 2% not at all).
2.2% of residents speak other Indo-European language at home (87% well, 13% not well).
0.3% of residents speak Asian or Pacific Island language at home (14% well, 86% not well).
0.8% of residents speak other language at home (100% very well).
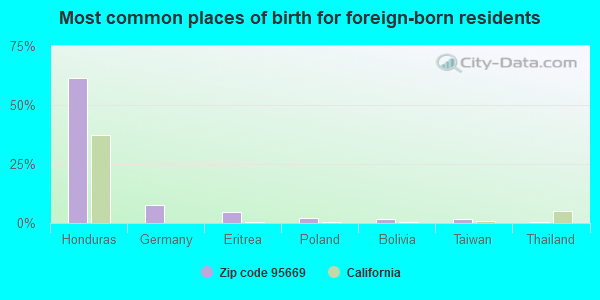
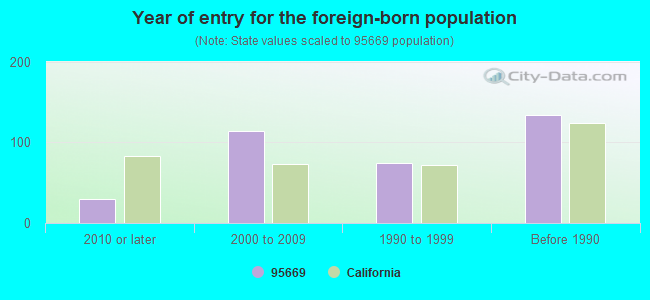
Foreign born population: 336 (13.5%) (48.2% of them are naturalized citizens)
This zip code:
13.5%
Whole state:
26.7%
62%Honduras
7%Germany
4%Eritrea
2%Poland
2%Bolivia
1%Taiwan
1%Thailand
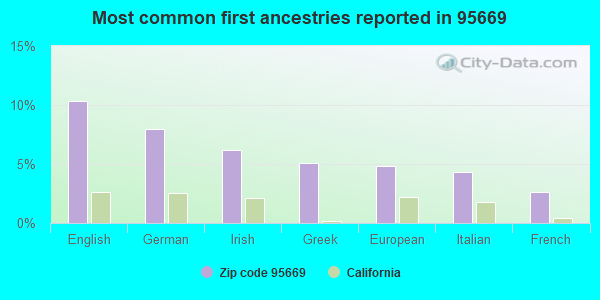
10%English
8%German
6%Irish
5%Greek
5%European
4%Italian
3%French
Year of entry for the foreign-born population
302010 or later
1142000 to 2009
751990 to 1999
134Before 1990
Facilities with environmental interests located in this zip code:
GOLDEN STATE EXPLOSIVES (2901 HWY. 16 in PLYMOUTH, CA)
TRI REPORTER (Tracking of toxic chemicals releasing facilities) Business SIC classification: EXPLOSIVES
HOPE FOUNDATION (240 STATE 16 HWY in PLYMOUTH, CA)
CRITERIA AND HAZARDOUS AIR POLLUTANT INVENTORY (Inventory of air pollution sources) Business SIC classification: REFUSE SYSTEMS Business NAICS classification: SOLID WASTE LANDFILL.
Housing units lacking complete plumbing facilities: 0.6% Housing units lacking complete kitchen facilities: 0.6%
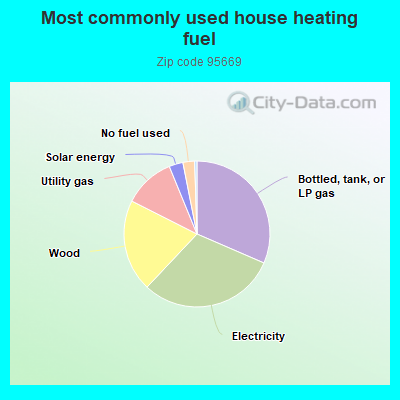
31.6%Bottled, tank, or LP gas
30.6%Electricity
20.5%Wood
11.4%Utility gas
3.1%Solar energy
2.6%No fuel used
0.5%Fuel oil, kerosene, etc.
Population in 1990: 969. Population change in the 1990s: +1,245 (+128.5%).
Place of birth for U.S.-born residents:
This state: 1,814
Northeast: 61
Midwest: 136
South: 33
West: 83
58% of the 95669 zip code residents lived in the same house 5 years ago. Out of people who lived in different houses, 42% lived in this county. Out of people who lived in different counties, 50% lived in California.
97% of the 95669 zip code residents lived in the same house 1 year ago. Out of people who lived in different houses, 43% moved from this county. Out of people who lived in different houses, 41% moved from different county within same state. Out of people who lived in different houses, 29% moved from different state.
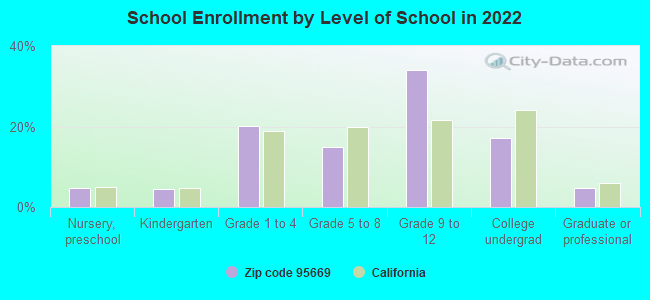
Private vs. public school enrollment:
Students in private schools in grades 1 to 8 (elementary and middle school):
Here:
0.0%
California:
10.5%
Students in private schools in grades 9 to 12 (high school): 14
Here:
8.1%
California:
8.5%
Students in private undergraduate colleges: 2
Here:
3.1%
California:
15.9%
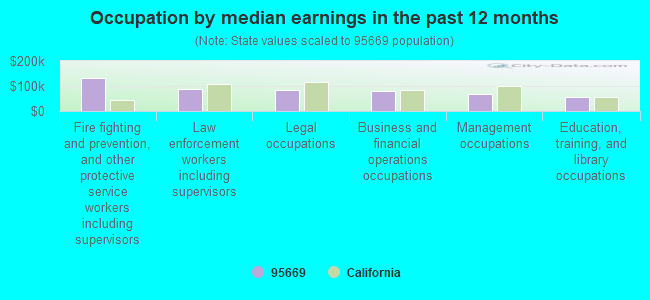
Occupation by median earnings in the past 12 months ($)
131,193Fire fighting and prevention, and other protective service workers including supervisors
89,472Law enforcement workers including supervisors
84,853Legal occupations
79,178Business and financial operations occupations
66,694Management occupations
54,755Education, training, and library occupations
Top industries in this zip code by the number of employees in 2005:
Health Care and Social Assistance: Offices of Dentists (10-19: 1)
Construction: Site Preparation Contractors (5-9: 1, 1-4: 4)
Accommodation and Food Services: Caterers (10-19: 1)
People in group quarters in 2010:
9 people in workers' group living quarters and job corps centers
Fatal accident statistics in 2011:
Fatal accident count: 2
Vehicles involved in fatal accidents: 4
Fatal accidents caused by drunken drivers: 1
Fatalities: 2
Persons involved in fatal accidents: 5
Pedestrians involved in fatal accidents: 0
2005 - 2018 National Fire Incident Reporting System (NFIRS) incidents
According to the data from the years 2005 - 2018 the average number of fires per year is 24. The highest number of reported fire incidents - 40 took place in 2017, and the least - 12 in 2011. The data has a growing trend.
When looking into fire subcategories, the most reports belonged to: Outside Fires (65.0%), and Structure Fires (18.8%).
Fire incident types reported to NFIRS in Zip Code 95669


 Nearest zip codes: 95699, 95601, 95623, 95685, 95682, 95640.
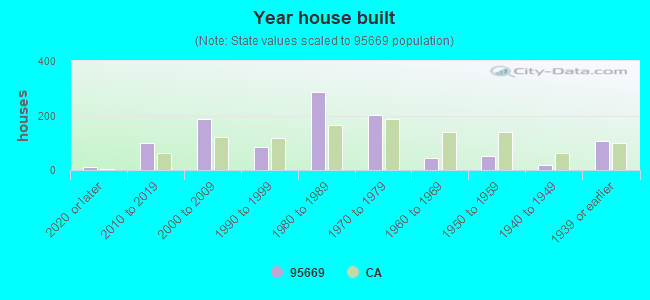


 According to the data from the years 2005 - 2018 the average number of fires per year is 24. The highest number of reported fire incidents - 40 took place in 2017, and the least - 12 in 2011. The data has a growing trend.
 When looking into fire subcategories, the most reports belonged to: Outside Fires (65.0%), and Structure Fires (18.8%).