Estimated zip code population in 2022: 6,277 Zip code population in 2010: 6,180 Zip code population in 2000: 4,711
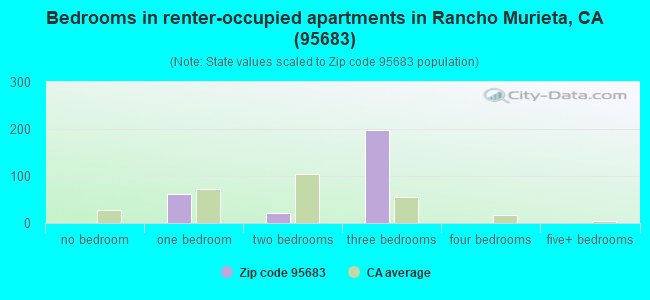
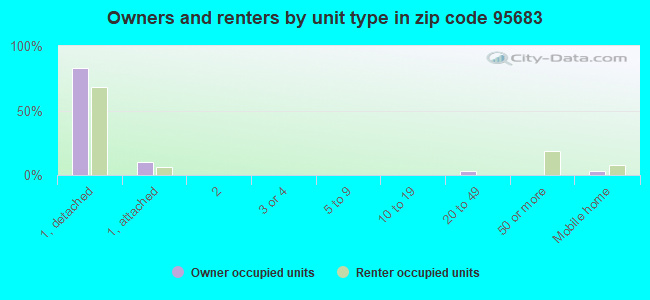
Houses and condos: 2,708 Renter-occupied apartments: 282
% of renters here:
10%
State:
44%
March 2022 cost of living index in zip code 95683: 102.9 (near average, U.S. average is 100)
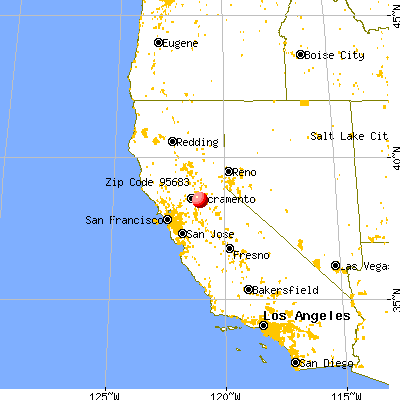
Land area: 90.8 sq. mi. Water area: 0.4 sq. mi.
Population density: 69 people per square mile
(very low).
OSM Map
General Map
Google Map
MSN Map
OSM Map
General Map
Google Map
MSN Map
OSM Map
General Map
Google Map
MSN Map
OSM Map
General Map
Google Map
MSN Map
Please wait while loading the map...
Real estate property taxes paid for housing units in 2022:
This zip code:
0.7% ($4,434)
California:
0.7% ($4,831)
Median real estate property taxes paid for housing units with mortgages in 2022: $4,874 (0.7%) Median real estate property taxes paid for housing units with no mortgage in 2022: $3,296 (0.6%)
Business Search- 14 Million verified businesses
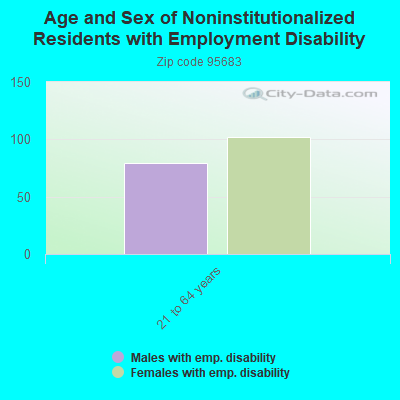
Males: 2,891
(46.1%)
Females: 3,386
(53.9%)
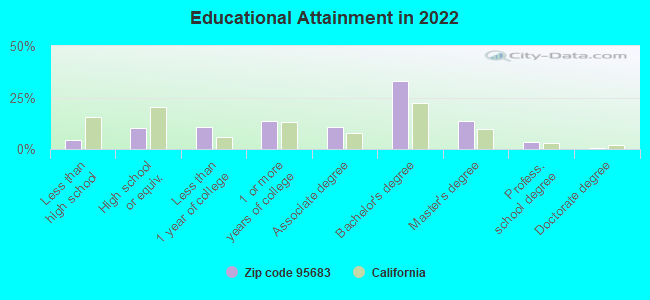
For population 25 years and over in 95683:
High school or higher: 95.7%
Bachelor's degree or higher: 50.3%
Graduate or professional degree: 17.2%
Unemployed: 2.7%
Mean travel time to work (commute): 38.7 minutes
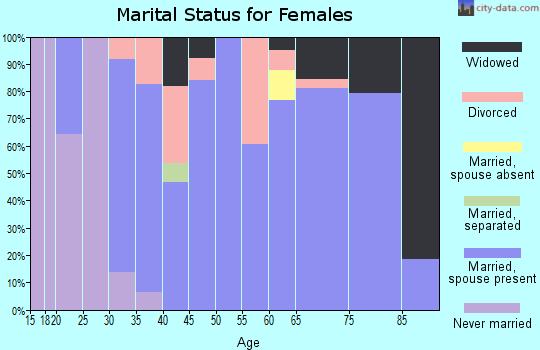
For population 15 years and over in 95683:
Never married: 19.8%
Now married: 62.1%
Separated: 0.4%
Widowed: 5.1%
Divorced: 12.6%
Zip code 95683 compared to state average:
Unemployed percentage below state average.
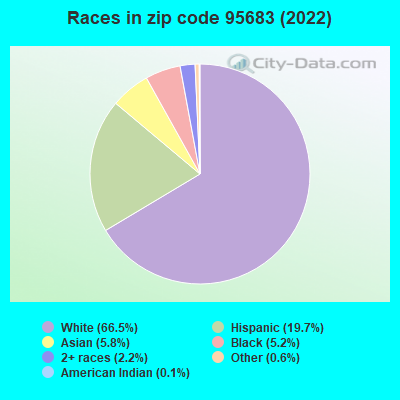
Hispanic race population percentage below state average.
Median age significantly above state average.
Foreign-born population percentage significantly below state average.
Renting percentage significantly below state average.
Length of stay since moving in above state average.
Number of rooms per house above state average.
House age below state average.
Number of college students below state average.
Percentage of population with a bachelor's degree or higher above state average.
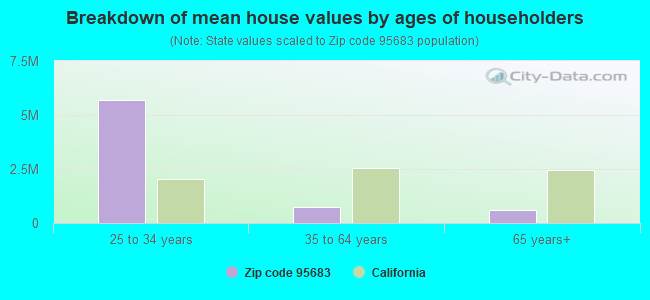
Estimated median house/condo value in 2022: $672,466
95683:
$672,466
California:
$715,900
According to our research of California and other state lists, there were 2 registered sex offenders living in 95683 zip code as of April 27, 2024. The ratio of all residents to sex offenders in zip code 95683 is 3,161 to 1. The ratio of registered sex offenders to all residents in this zip code is much lower than the state average.
Median resident age:
This zip code:
56.1 years
California median age:
37.9 years
Average household size:
This zip code:
2.3 people
California:
2.8 people
Averages for the 2020 tax year for zip code 95683, filed in 2021:
Average Adjusted Gross Income (AGI) in 2020: $122,337 (Individual Income Tax Returns)
Here:
$122,337
State:
$95,910
Salary/wage: $104,649 (reported on 67.4% of returns)
Here:
$104,649
State:
$77,331
(% of AGI for various income ranges: 1289.7% for AGIs below $25k, 3248.7% for AGIs $25k-50k, 5389.5% for AGIs $50k-75k, 8262.9% for AGIs $75k-100k, 19659.1% for AGIs $100k-200k, 80861.4% for AGIs over 200k)
Taxable interest for individuals: $1,441 (reported on 62.0% of returns)
This zip code:
$1,441
California:
$2,294
(% of AGI for various income ranges: 30.0% for AGIs below $25k, 121.2% for AGIs $25k-50k, 148.1% for AGIs $50k-75k, 151.0% for AGIs $75k-100k, 188.1% for AGIs $100k-200k, 864.3% for AGIs over 200k)
Ordinary dividends: $6,934 (reported on 33.4% of returns)
Here:
$6,934
State:
$10,949
(% of AGI for various income ranges: 77.9% for AGIs below $25k, 200.0% for AGIs $25k-50k, 289.5% for AGIs $50k-75k, 302.4% for AGIs $75k-100k, 519.4% for AGIs $100k-200k, 2609.3% for AGIs over 200k)
Net capital gain/loss in AGI: +$16,602 (reported on 31.7% of returns)
Here:
+$16,602
State:
+$49,306
(% of AGI for various income ranges: 34.2% for AGIs below $25k, 128.3% for AGIs $25k-50k, 151.0% for AGIs $50k-75k, 496.7% for AGIs $75k-100k, 747.7% for AGIs $100k-200k, 9368.6% for AGIs over 200k)
Profit/loss from business: +$19,338 (reported on 16.6% of returns)
Here:
+$19,338
State:
+$15,671
(% of AGI for various income ranges: 141.8% for AGIs below $25k, 180.4% for AGIs $25k-50k, 90.0% for AGIs $50k-75k, 425.7% for AGIs $75k-100k, 895.1% for AGIs $100k-200k, 3538.6% for AGIs over 200k)
Taxable individual retirement arrangement distribution: $23,865 (reported on 17.1% of returns)
95683:
$23,865
California:
$23,505
(% of AGI for various income ranges: 132.9% for AGIs below $25k, 413.3% for AGIs $25k-50k, 521.0% for AGIs $50k-75k, 860.0% for AGIs $75k-100k, 1335.5% for AGIs $100k-200k, 2603.6% for AGIs over 200k)
Self-employed (Keogh) retirement plans: $20,300 (reported on 1.1% of returns)
95683:
$20,300
California:
$30,163
(% of AGI for various income ranges: 580.0% for AGIs over 200k)
Total itemized deductions: $32,795 (reported on 27.1% of returns)
Here:
$32,795
State:
$39,517
(% of AGI for various income ranges: 142.1% for AGIs below $25k, 570.4% for AGIs $25k-50k, 875.2% for AGIs $50k-75k, 1711.4% for AGIs $75k-100k, 2656.8% for AGIs $100k-200k, 8090.7% for AGIs over 200k)
Charity contributions: $6,472 (reported on 23.4% of returns)
Here:
$6,472
State:
$12,598
(% of AGI for various income ranges: 59.6% for AGIs $25k-50k, 102.9% for AGIs $50k-75k, 196.2% for AGIs $75k-100k, 420.0% for AGIs $100k-200k, 1830.0% for AGIs over 200k)
Taxes paid: $9,039 (reported on 27.1% of returns)
95683:
$9,039
State:
$8,807
(% of AGI for various income ranges: 35.8% for AGIs below $25k, 108.7% for AGIs $25k-50k, 228.1% for AGIs $50k-75k, 482.4% for AGIs $75k-100k, 841.9% for AGIs $100k-200k, 1957.9% for AGIs over 200k)
Earned income credit: $1,692 (reported on 3.7% of returns)
Here:
$1,692
State:
$2,074
(% of AGI for various income ranges: 37.1% for AGIs below $25k, 32.9% for AGIs $25k-50k)
Percentage of individuals using paid preparers for their 2020 taxes: 91.1%
Here:
91%
State:
92%
(% for various income ranges: 88.4% for AGIs below $25k, 90.9% for AGIs $25k-50k, 91.9% for AGIs $50k-75k, 92.3% for AGIs $75k-100k, 92.7% for AGIs $100k-200k, 90.4% for AGIs over 200k)
Averages for the 2012 tax year for zip code 95683, filed in 2013:
Average Adjusted Gross Income (AGI) in 2012: $102,061 (Individual Income Tax Returns)
Here:
$102,061
State:
$72,726
Salary/wage: $82,824 (reported on 69.3% of returns)
Here:
$82,824
State:
$59,079
(% of AGI for various income ranges: 53.9% for AGIs below $25k, 54.5% for AGIs $25k-50k, 53.0% for AGIs $50k-75k, 57.1% for AGIs $75k-100k, 64.4% for AGIs $100k-200k, 47.7% for AGIs over 200k)
Taxable interest for individuals: $2,192 (reported on 62.4% of returns)
This zip code:
$2,192
California:
$2,146
(% of AGI for various income ranges: 3.2% for AGIs below $25k, 2.3% for AGIs $25k-50k, 1.6% for AGIs $50k-75k, 1.1% for AGIs $75k-100k, 0.6% for AGIs $100k-200k, 1.9% for AGIs over 200k)
Ordinary dividends: $7,008 (reported on 33.7% of returns)
Here:
$7,008
State:
$9,308
(% of AGI for various income ranges: 5.7% for AGIs below $25k, 2.4% for AGIs $25k-50k, 2.2% for AGIs $50k-75k, 1.8% for AGIs $75k-100k, 1.6% for AGIs $100k-200k, 3.0% for AGIs over 200k)
Net capital gain/loss in AGI: +$15,168 (reported on 29.7% of returns)
Here:
+$15,168
State:
+$30,460
(% of AGI for various income ranges: 1.2% for AGIs $50k-75k, 0.8% for AGIs $75k-100k, 1.2% for AGIs $100k-200k, 11.0% for AGIs over 200k)
Profit/loss from business: +$19,652 (reported on 19.1% of returns)
Here:
+$19,652
State:
+$17,064
(% of AGI for various income ranges: 9.6% for AGIs below $25k, 6.8% for AGIs $25k-50k, 4.4% for AGIs $50k-75k, 3.5% for AGIs $75k-100k, 2.1% for AGIs $100k-200k, 4.5% for AGIs over 200k)
Taxable individual retirement arrangement distribution: $22,860 (reported on 20.8% of returns)
95683:
$22,860
California:
$19,557
(% of AGI for various income ranges: 8.1% for AGIs below $25k, 7.4% for AGIs $25k-50k, 4.9% for AGIs $50k-75k, 5.3% for AGIs $75k-100k, 4.8% for AGIs $100k-200k, 3.6% for AGIs over 200k)
Self-employment retirement plans: $18,360 (reported on 1.7% of returns)
95683:
$18,360
California:
$24,530
Total itemized deductions: $32,974 (24% of AGI, reported on 62.4% of returns)
Here:
$32,974
State:
$34,004
Here:
23.8% of AGI
State:
22.7% of AGI
(% of AGI for various income ranges: 40.1% for AGIs below $25k, 20.8% for AGIs $25k-50k, 18.4% for AGIs $50k-75k, 20.4% for AGIs $75k-100k, 19.2% for AGIs $100k-200k, 20.1% for AGIs over 200k)
Charity contributions: $3,351 (reported on 55.4% of returns)
Here:
$3,351
State:
$4,659
(% of AGI for various income ranges: 1.8% for AGIs below $25k, 1.9% for AGIs $25k-50k, 1.7% for AGIs $50k-75k, 1.9% for AGIs $75k-100k, 1.9% for AGIs $100k-200k, 1.7% for AGIs over 200k)
Taxes paid: $13,182 (reported on 62.4% of returns)
95683:
$13,182
State:
$14,448
(% of AGI for various income ranges: 7.3% for AGIs below $25k, 5.3% for AGIs $25k-50k, 5.4% for AGIs $50k-75k, 6.6% for AGIs $75k-100k, 7.6% for AGIs $100k-200k, 10.2% for AGIs over 200k)
Earned income credit: $1,673 (reported on 5.0% of returns)
Here:
$1,673
State:
$2,286
(% of AGI for various income ranges: 2.2% for AGIs below $25k, 0.5% for AGIs $25k-50k)
Percentage of individuals using paid preparers for their 2012 taxes: 61.7%
Here:
62%
State:
64%
(% for various income ranges: 48.5% for AGIs below $25k, 63.4% for AGIs $25k-50k, 65.8% for AGIs $50k-75k, 65.0% for AGIs $75k-100k, 62.5% for AGIs $100k-200k, 78.6% for AGIs over 200k)
Averages for the 2004 tax year for zip code 95683, filed in 2005:
Average Adjusted Gross Income (AGI) in 2004: $92,521 (Individual Income Tax Returns)
Here:
$92,521
State:
$58,600
Salary/wage: $78,630 (reported on 72.6% of returns)
Here:
$78,630
State:
$49,455
(% of AGI for various income ranges: 47.9% for AGIs $10k-25k, 58.1% for AGIs $25k-50k, 60.1% for AGIs $50k-75k, 65.4% for AGIs $75k-100k, 60.4% for AGIs over 100k)
Taxable interest for individuals: $2,619 (reported on 76.2% of returns)
This zip code:
$2,619
California:
$2,365
(% of AGI for various income ranges: 4.8% for AGIs $10k-25k, 4.4% for AGIs $25k-50k, 1.9% for AGIs $50k-75k, 1.4% for AGIs $75k-100k, 1.8% for AGIs over 100k)
Taxable dividends: $3,214 (reported on 43.3% of returns)
Here:
$3,214
State:
$4,746
(% of AGI for various income ranges: 6.1% for AGIs $10k-25k, 3.3% for AGIs $25k-50k, 2.2% for AGIs $50k-75k, 1.4% for AGIs $75k-100k, 1.0% for AGIs over 100k)
Net capital gain/loss: +$14,910 (reported on 40.8% of returns)
Here:
+$14,910
State:
+$23,418
(% of AGI for various income ranges: -0.9% for AGIs $10k-25k, 0.8% for AGIs $25k-50k, 1.2% for AGIs $50k-75k, 0.8% for AGIs $75k-100k, 9.1% for AGIs over 100k)
Profit/loss from business: +$24,490 (reported on 22.6% of returns)
Here:
+$24,490
State:
+$16,826
(% of AGI for various income ranges: 9.6% for AGIs $10k-25k, 7.6% for AGIs $25k-50k, 4.6% for AGIs $50k-75k, 5.6% for AGIs $75k-100k, 5.9% for AGIs over 100k)
IRA payment deduction: $4,105 (reported on 3.6% of returns)
95683:
$4,105
California:
$3,192
(% of AGI for various income ranges: 0.5% for AGIs $25k-50k, 0.3% for AGIs $50k-75k, 0.3% for AGIs $75k-100k, 0.1% for AGIs over 100k)
Self-employed pension: $14,615 (reported on 3.7% of returns)
Here:
$14,615
California:
$17,688
(% of AGI for various income ranges: 1.3% for AGIs $10k-25k, 0.3% for AGIs $50k-75k, 0.4% for AGIs $75k-100k, 0.7% for AGIs over 100k)
Total itemized deductions: $29,966 (24% of AGI, reported on 67.9% of returns)
Here:
$29,966
State:
$28,113
Here:
24.1% of AGI
State:
25.3% of AGI
(% of AGI for various income ranges: 25.7% for AGIs $10k-25k, 27.3% for AGIs $25k-50k, 26.5% for AGIs $50k-75k, 25.5% for AGIs $75k-100k, 19.4% for AGIs over 100k)
Charity contributions deductions: $3,735 (3% of AGI, reported on 64.1% of returns)
Here:
$3,735
State:
$3,923
Here:
2.9% of AGI
State:
3.3% of AGI
(% of AGI for various income ranges: 1.8% for AGIs $10k-25k, 2.5% for AGIs $25k-50k, 2.1% for AGIs $50k-75k, 2.5% for AGIs $75k-100k, 2.7% for AGIs over 100k)
Total tax: $16,378 (reported on 85.4% of returns)
95683:
$16,378
State:
$10,761
(% of AGI for various income ranges: 4.7% for AGIs $10k-25k, 7.2% for AGIs $25k-50k, 8.6% for AGIs $50k-75k, 10.0% for AGIs $75k-100k, 17.9% for AGIs over 100k)
Earned income credit: $1,284 (reported on 3.0% of returns)
Here:
$1,284
State:
$1,763
Percentage of individuals using paid preparers for their 2004 taxes: 65.7%
Here:
66%
State:
66%
(% for various income ranges: 56.6% for AGIs below $10k, 59.6% for AGIs $10k-25k, 66.8% for AGIs $25k-50k, 66.7% for AGIs $50k-75k, 60.6% for AGIs $75k-100k, 72.7% for AGIs over 100k)
Likely homosexual households (counted as self-reported same-sex unmarried-partner households)
Lesbian couples: 0.7% of all households
Gay men: 0.0% of all households
Household received Food Stamps/SNAP in the past 12 months: 35 Household did not receive Food Stamps/SNAP in the past 12 months: 2,602
Women who had a birth in the past 12 months: 80 (41 now married, 40 unmarried) Women who did not have a birth in the past 12 months: 929 (376 now married, 552 unmarried)
Housing units in zip code 95683 with a mortgage: 1,810 (85 second mortgage, 60 both second mortgage and home equity loan) Houses without a mortgage: 85
Median monthly owner costs for units with a mortgage: $2,432 Median monthly owner costs for units without a mortgage: $862
Residents with income below the poverty level in 2022:
This zip code:
3.9%
Whole state:
12.2%
Residents with income below 50% of the poverty level in 2022:
This zip code:
1.5%
Whole state:
6.2%
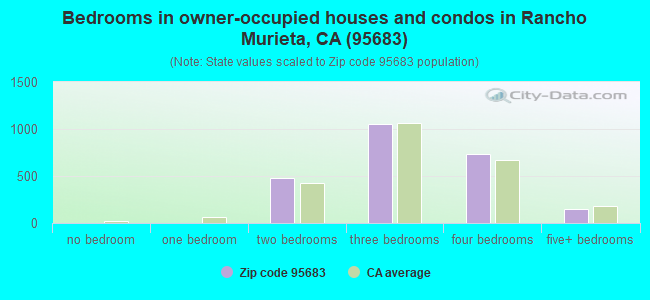
Median number of rooms in houses and condos:
Here:
7.0
State:
6.0
Median number of rooms in apartments:
Here:
4.9
State:
3.9
Notable locations in this zip code not listed on our city pages
Notable locations in zip code 95683: Bridge House (A), Rancho Murieta Golf Course and Country Club (B), Sacramento Metropolitan Fire District Station 59 (C), Sacramento County Boy's Ranch (D). Display/hide their locations on the map
Creeks: Burgoyne Creek (A), Carson Creek (B), Coyote Creek (C), Crevis Creek (D), Little Deer Creek (E), Willow Creek (F), Slate Creek (G), Arkansas Creek (H). Display/hide their locations on the map
In group quarters: 6 (-1 institutionalized population)
Size of family households: 1,239 2-persons, 234 3-persons, 372 4-persons, 47 5-persons, 76 6-persons, 12 7-or-more-persons
Size of nonfamily households: 589 1-person, 140 2-persons
744 married couples with children.
339 single-parent households (339 men).
92.4% of residents of 95683 zip code speak English at home.
4.5% of residents speak Spanish at home (84% very well, 7% well, 8% not well).
1.3% of residents speak other Indo-European language at home (55% very well, 45% well).
2.0% of residents speak Asian or Pacific Island language at home (33% very well, 67% well).
0.3% of residents speak other language at home (100% very well).
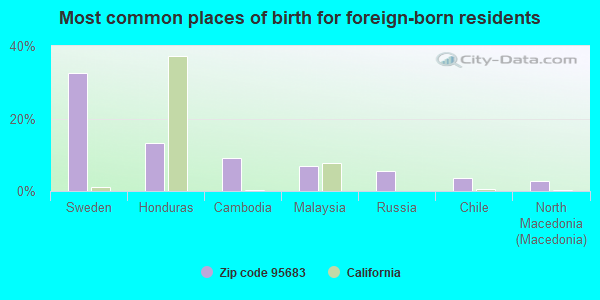
Foreign born population: 516 (8.2%) (46.0% of them are naturalized citizens)
This zip code:
8.2%
Whole state:
26.7%
32%Sweden
13%Honduras
9%Cambodia
7%Malaysia
6%Russia
3%Chile
3%North Macedonia (Macedonia)
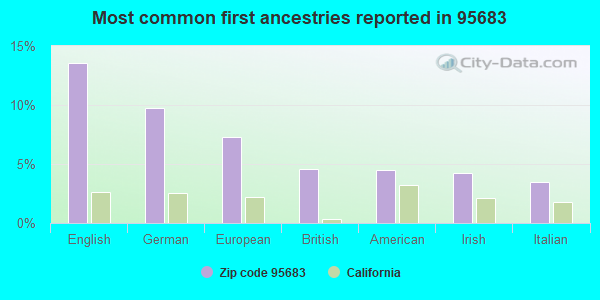
14%English
10%German
7%European
5%British
5%American
4%Irish
4%Italian
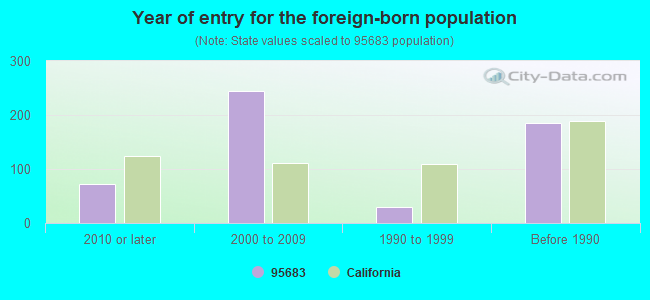
Year of entry for the foreign-born population
722010 or later
2452000 to 2009
301990 to 1999
186Before 1990
Facilities with environmental interests located in this zip code:
HENLEY & ASSOCIATES (6950 META COURT in SLOUGHHOUSE, CA)
TRANSPORTER (Resource Conservation and Recovery Act (tracking hazardous waste)) Organizations: CLINTON P HENLEY (CONTACT/OWNER)
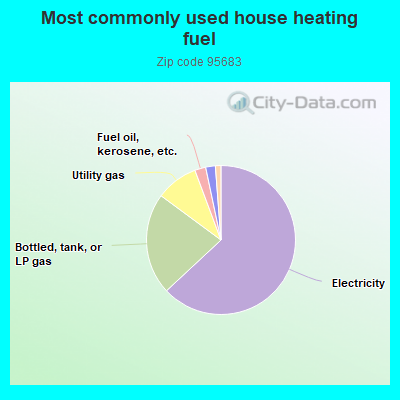
63.2%Electricity
22.1%Bottled, tank, or LP gas
9.2%Utility gas
2.4%Fuel oil, kerosene, etc.
2.1%Solar energy
1.2%Wood
Population in 1990: 3,035. Population change in the 1990s: +1,676 (+55.2%).
Place of birth for U.S.-born residents:
This state: 3,765
Northeast: 477
Midwest: 436
South: 397
West: 614
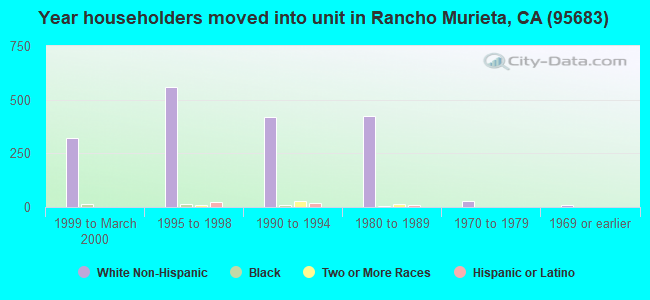
60% of the 95683 zip code residents lived in the same house 5 years ago. Out of people who lived in different houses, 53% lived in this county. Out of people who lived in different counties, 50% lived in California.
94% of the 95683 zip code residents lived in the same house 1 year ago. Out of people who lived in different houses, 29% moved from this county. Out of people who lived in different houses, 53% moved from different county within same state. Out of people who lived in different houses, 24% moved from different state.
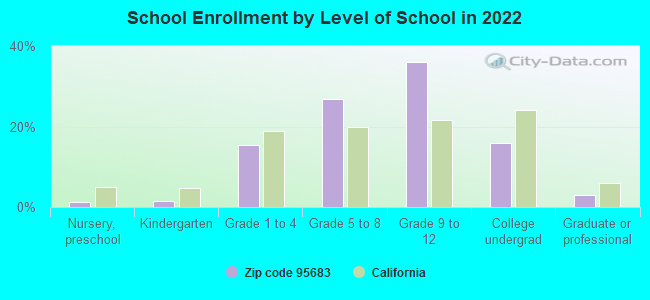
Private vs. public school enrollment:
Students in private schools in grades 1 to 8 (elementary and middle school): 21
Here:
4.3%
California:
10.5%
Students in private schools in grades 9 to 12 (high school): 25
Here:
5.9%
California:
8.5%
Students in private undergraduate colleges: 17
Here:
9.4%
California:
15.9%
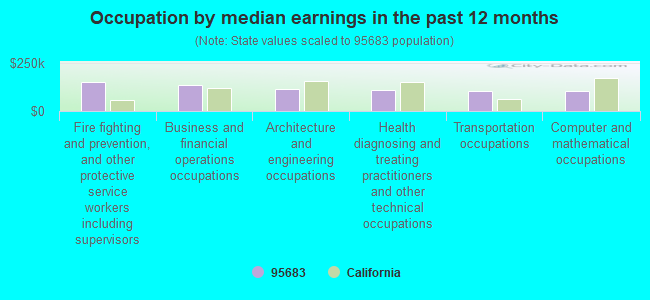
Occupation by median earnings in the past 12 months ($)
151,513Fire fighting and prevention, and other protective service workers including supervisors
136,769Business and financial operations occupations
111,763Architecture and engineering occupations
107,345Health diagnosing and treating practitioners and other technical occupations
105,605Transportation occupations
101,628Computer and mathematical occupations
Top industries in this zip code by the number of employees in 2005:
Arts, Entertainment, and Recreation: Golf Courses and Country Clubs (100-249 employees: 1 establishment, 50-99 employees: 1 establishment)
Construction: Poured Concrete Foundation and Structure Contractors (50-99: 1)
Arts, Entertainment, and Recreation: Fitness and Recreational Sports Centers (20-49: 1, 5-9: 2)
Arts, Entertainment, and Recreation: Promoters of Performing Arts, Sports, and Similar Events with Facilities (20-49: 1, 5-9: 1)
Professional, Scientific, and Technical Services: Offices of Lawyers (20-49: 1, 1-4: 1)
Educational Services: Apprenticeship Training (20-49: 1)
Other Services (except Public Administration): Other Similar Organizations (except Business, Professional, Labor, and Political Organizations) (20-49: 1)
People in group quarters in 2010:
71 people in correctional facilities intended for juveniles
Fatal accident statistics in 2013:
Fatal accident count: 1
Vehicles involved in fatal accidents: 2
Fatal accidents caused by drunken drivers: 1
Fatalities: 1
Persons involved in fatal accidents: 5
Pedestrians involved in fatal accidents: 0
Fatal accident statistics in 2012:
Fatal accident count: 1
Vehicles involved in fatal accidents: 2
Fatal accidents caused by drunken drivers: 0
Fatalities: 1
Persons involved in fatal accidents: 3
Pedestrians involved in fatal accidents: 0
Home Mortgage Disclosure Act Aggregated Statistics For Year 2009 (Based on 2 partial tracts)
A) FHA, FSA/RHS & VA Home Purchase Loans
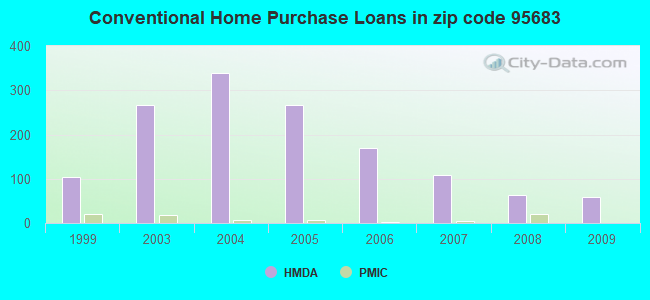
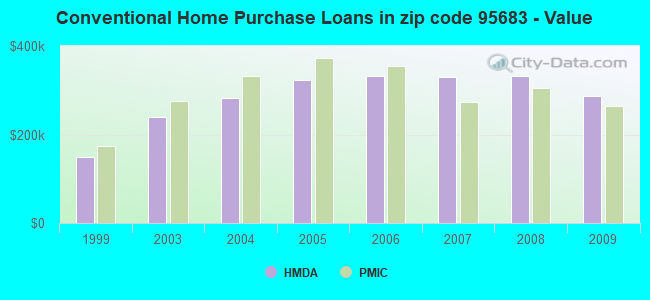
B) Conventional Home Purchase Loans
C) Refinancings
D) Home Improvement Loans
F) Non-occupant Loans on < 5 Family Dwellings (A B C & D)
G) Loans On Manufactured Home Dwelling (A B C & D)
Number
Average Value
Number
Average Value
Number
Average Value
Number
Average Value
Number
Average Value
Number
Average Value
LOANS ORIGINATED
49
$283,562
58
$286,632
225
$281,194
18
$257,307
16
$228,379
2
$75,865
APPLICATIONS APPROVED, NOT ACCEPTED
3
$345,273
3
$286,270
30
$309,060
0
$0
0
$0
1
$184,790
APPLICATIONS DENIED
9
$298,264
6
$247,688
90
$304,532
7
$113,377
6
$257,090
2
$124,005
APPLICATIONS WITHDRAWN
8
$325,700
5
$232,256
48
$318,222
6
$69,542
2
$358,890
2
$438,645
FILES CLOSED FOR INCOMPLETENESS
2
$274,275
1
$233,420
12
$294,131
0
$0
1
$233,420
0
$0
Aggregated Statistics For Year 2008 (Based on 2 partial tracts)
A) FHA, FSA/RHS & VA Home Purchase Loans
B) Conventional Home Purchase Loans
C) Refinancings
D) Home Improvement Loans
F) Non-occupant Loans on < 5 Family Dwellings (A B C & D)
G) Loans On Manufactured Home Dwelling (A B C & D)
Number
Average Value
Number
Average Value
Number
Average Value
Number
Average Value
Number
Average Value
Number
Average Value
LOANS ORIGINATED
26
$315,646
63
$332,784
115
$291,332
17
$134,562
12
$207,650
4
$155,615
APPLICATIONS APPROVED, NOT ACCEPTED
4
$310,260
10
$293,433
22
$346,909
1
$10,700
3
$253,850
0
$0
APPLICATIONS DENIED
2
$266,005
16
$408,006
88
$356,712
8
$64,921
5
$310,064
3
$174,420
APPLICATIONS WITHDRAWN
8
$295,184
16
$334,453
30
$354,804
2
$218,350
4
$172,150
0
$0
FILES CLOSED FOR INCOMPLETENESS
1
$335,550
5
$414,134
11
$251,196
1
$419,190
0
$0
1
$212,030
Aggregated Statistics For Year 2007 (Based on 2 partial tracts)
A) FHA, FSA/RHS & VA Home Purchase Loans
B) Conventional Home Purchase Loans
C) Refinancings
D) Home Improvement Loans
F) Non-occupant Loans on < 5 Family Dwellings (A B C & D)
G) Loans On Manufactured Home Dwelling (A B C & D)
Number
Average Value
Number
Average Value
Number
Average Value
Number
Average Value
Number
Average Value
Number
Average Value
LOANS ORIGINATED
1
$173,120
109
$329,934
197
$357,265
41
$141,668
23
$305,227
8
$193,182
APPLICATIONS APPROVED, NOT ACCEPTED
0
$0
10
$324,557
51
$379,810
6
$103,258
2
$831,575
0
$0
APPLICATIONS DENIED
0
$0
28
$418,704
90
$379,714
11
$249,605
6
$669,148
4
$108,688
APPLICATIONS WITHDRAWN
0
$0
10
$441,949
44
$373,147
4
$421,135
2
$1,135,510
2
$235,370
FILES CLOSED FOR INCOMPLETENESS
0
$0
6
$297,292
25
$353,637
0
$0
2
$403,630
0
$0
Aggregated Statistics For Year 2006 (Based on 2 partial tracts)
A) FHA, FSA/RHS & VA Home Purchase Loans
B) Conventional Home Purchase Loans
C) Refinancings
D) Home Improvement Loans
F) Non-occupant Loans on < 5 Family Dwellings (A B C & D)
G) Loans On Manufactured Home Dwelling (A B C & D)
Number
Average Value
Number
Average Value
Number
Average Value
Number
Average Value
Number
Average Value
Number
Average Value
LOANS ORIGINATED
1
$124,490
169
$333,136
271
$335,748
53
$116,840
35
$289,724
8
$138,839
APPLICATIONS APPROVED, NOT ACCEPTED
0
$0
28
$324,779
59
$326,925
9
$109,256
5
$419,968
1
$171,180
APPLICATIONS DENIED
0
$0
18
$800,179
95
$361,766
28
$175,832
9
$325,389
3
$147,187
APPLICATIONS WITHDRAWN
0
$0
18
$526,177
77
$364,195
6
$88,345
3
$362,457
1
$170,210
FILES CLOSED FOR INCOMPLETENESS
0
$0
7
$434,613
16
$386,669
1
$58,360
1
$291,780
0
$0
Aggregated Statistics For Year 2005 (Based on 2 partial tracts)
B) Conventional Home Purchase Loans
C) Refinancings
D) Home Improvement Loans
F) Non-occupant Loans on < 5 Family Dwellings (A B C & D)
G) Loans On Manufactured Home Dwelling (A B C & D)
Number
Average Value
Number
Average Value
Number
Average Value
Number
Average Value
Number
Average Value
LOANS ORIGINATED
266
$324,282
377
$326,938
86
$208,623
31
$248,076
8
$113,186
APPLICATIONS APPROVED, NOT ACCEPTED
38
$300,329
63
$318,303
12
$116,388
5
$248,402
3
$73,917
APPLICATIONS DENIED
55
$356,378
90
$324,902
19
$134,321
6
$273,463
5
$229,534
APPLICATIONS WITHDRAWN
37
$310,732
83
$324,216
8
$163,275
5
$274,662
5
$175,458
FILES CLOSED FOR INCOMPLETENESS
9
$452,691
24
$373,924
2
$34,040
2
$504,780
1
$170,210
Aggregated Statistics For Year 2004 (Based on 2 partial tracts)
A) FHA, FSA/RHS & VA Home Purchase Loans
B) Conventional Home Purchase Loans
C) Refinancings
D) Home Improvement Loans
F) Non-occupant Loans on < 5 Family Dwellings (A B C & D)
G) Loans On Manufactured Home Dwelling (A B C & D)
Number
Average Value
Number
Average Value
Number
Average Value
Number
Average Value
Number
Average Value
Number
Average Value
LOANS ORIGINATED
1
$232,450
339
$282,327
410
$280,925
61
$144,359
38
$253,004
10
$134,608
APPLICATIONS APPROVED, NOT ACCEPTED
0
$0
51
$293,515
58
$273,770
7
$120,741
6
$272,977
3
$121,250
APPLICATIONS DENIED
0
$0
52
$293,912
121
$322,726
22
$157,163
3
$246,717
7
$99,344
APPLICATIONS WITHDRAWN
0
$0
33
$327,530
93
$266,053
7
$202,996
5
$239,844
1
$116,710
FILES CLOSED FOR INCOMPLETENESS
0
$0
11
$310,613
31
$279,544
1
$131,300
1
$271,360
4
$105,528
Aggregated Statistics For Year 2003 (Based on 2 partial tracts)
A) FHA, FSA/RHS & VA Home Purchase Loans
B) Conventional Home Purchase Loans
C) Refinancings
D) Home Improvement Loans
F) Non-occupant Loans on < 5 Family Dwellings (A B C & D)
Number
Average Value
Number
Average Value
Number
Average Value
Number
Average Value
Number
Average Value
LOANS ORIGINATED
5
$240,622
266
$239,633
898
$228,071
53
$59,274
45
$209,390
APPLICATIONS APPROVED, NOT ACCEPTED
0
$0
32
$242,512
96
$238,672
12
$38,823
2
$91,425
APPLICATIONS DENIED
1
$258,710
25
$266,026
145
$234,142
16
$60,119
11
$248,720
APPLICATIONS WITHDRAWN
0
$0
21
$250,977
124
$251,841
2
$43,765
11
$196,112
FILES CLOSED FOR INCOMPLETENESS
0
$0
2
$201,815
18
$218,565
0
$0
1
$198,410
Aggregated Statistics For Year 1999 (Based on 1 partial tract)
A) FHA, FSA/RHS & VA Home Purchase Loans
B) Conventional Home Purchase Loans
C) Refinancings
D) Home Improvement Loans
F) Non-occupant Loans on < 5 Family Dwellings (A B C & D)
Detailed PMIC statistics for the following Tracts:0086.00
2005 - 2018 National Fire Incident Reporting System (NFIRS) incidents
According to the data from the years 2005 - 2018 the average number of fire incidents per year is 24. The highest number of fires - 39 took place in 2017, and the least - 9 in 2006. The data has an increasing trend.
When looking into fire subcategories, the most incidents belonged to: Outside Fires (74.9%), and Mobile Property/Vehicle Fires (10.5%).
Fire incident types reported to NFIRS in Zip Code 95683


 Nearest zip codes: 95742, 95693, 95630, 95682, 95762, 95655.
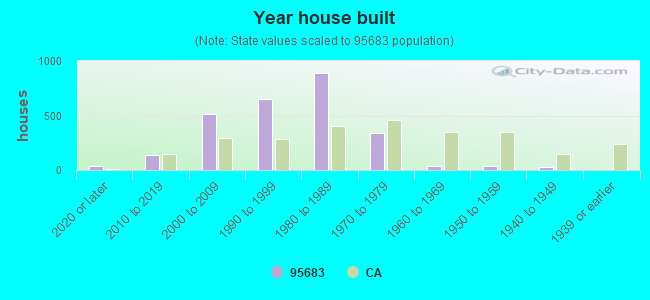


 According to the data from the years 2005 - 2018 the average number of fire incidents per year is 24. The highest number of fires - 39 took place in 2017, and the least - 9 in 2006. The data has an increasing trend.
 When looking into fire subcategories, the most incidents belonged to: Outside Fires (74.9%), and Mobile Property/Vehicle Fires (10.5%).