Estimated zip code population in 2022: 75,963 Zip code population in 2010: 72,180 Zip code population in 2000: 51,849
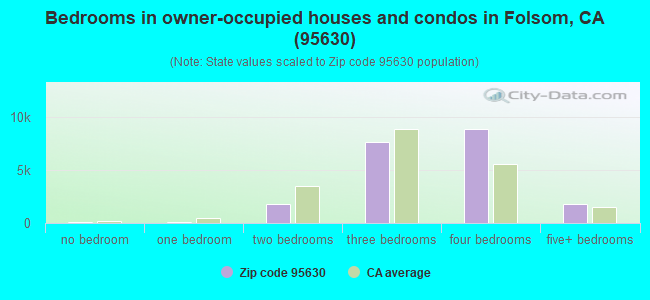
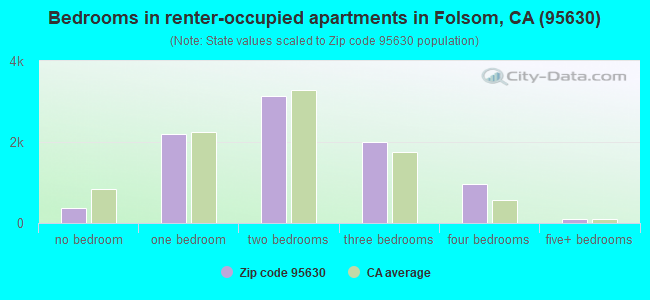
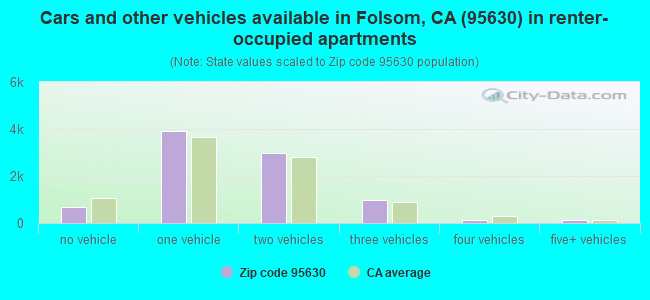
Houses and condos: 29,544 Renter-occupied apartments: 8,807
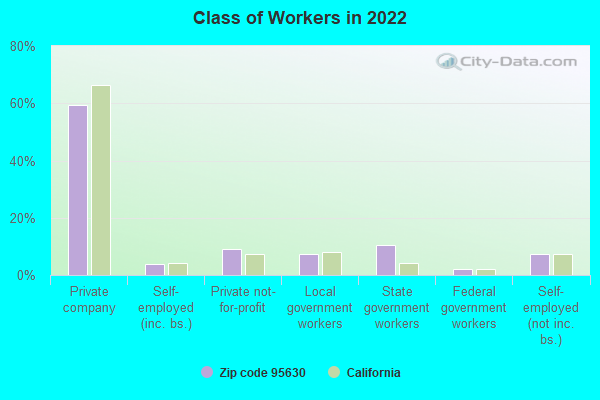
% of renters here:
31%
State:
44%
March 2022 cost of living index in zip code 95630: 102.4 (near average, U.S. average is 100)
Land area: 27.6 sq. mi. Water area: 2.3 sq. mi.
Population density: 2,754 people per square mile
(average).
OSM Map
General Map
Google Map
MSN Map
OSM Map
General Map
Google Map
MSN Map
OSM Map
General Map
Google Map
MSN Map
OSM Map
General Map
Google Map
MSN Map
Please wait while loading the map...
Real estate property taxes paid for housing units in 2022:
This zip code:
0.8% ($6,084)
California:
0.7% ($4,831)
Median real estate property taxes paid for housing units with mortgages in 2022: $6,431 (0.9%) Median real estate property taxes paid for housing units with no mortgage in 2022: $5,240 (0.8%)
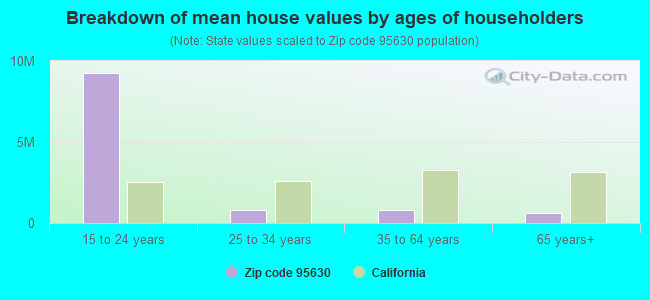
Estimated median house/condo value in 2022: $730,776
95630:
$730,776
California:
$715,900
According to our research of California and other state lists, there were 35 registered sex offenders living in 95630 zip code as of April 26, 2024. The ratio of all residents to sex offenders in zip code 95630 is 2,171 to 1. The ratio of registered sex offenders to all residents in this zip code is much lower than the state average.
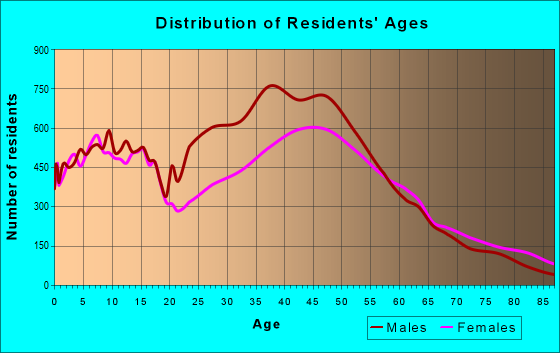
Median resident age:
This zip code:
40.6 years
California median age:
37.9 years
Average household size:
This zip code:
2.6 people
California:
2.8 people
Averages for the 2020 tax year for zip code 95630, filed in 2021:
Average Adjusted Gross Income (AGI) in 2020: $125,161 (Individual Income Tax Returns)
Here:
$125,161
State:
$95,910
Salary/wage: $110,340 (reported on 80.6% of returns)
Here:
$110,340
State:
$77,331
(% of AGI for various income ranges: 1135.3% for AGIs below $25k, 3580.2% for AGIs $25k-50k, 6768.8% for AGIs $50k-75k, 9959.9% for AGIs $75k-100k, 20552.9% for AGIs $100k-200k, 83819.5% for AGIs over 200k)
Taxable interest for individuals: $1,310 (reported on 54.1% of returns)
This zip code:
$1,310
California:
$2,294
(% of AGI for various income ranges: 31.4% for AGIs below $25k, 50.6% for AGIs $25k-50k, 72.8% for AGIs $50k-75k, 85.5% for AGIs $75k-100k, 115.3% for AGIs $100k-200k, 672.1% for AGIs over 200k)
Ordinary dividends: $4,997 (reported on 35.6% of returns)
Here:
$4,997
State:
$10,949
(% of AGI for various income ranges: 53.2% for AGIs below $25k, 91.6% for AGIs $25k-50k, 175.2% for AGIs $50k-75k, 165.7% for AGIs $75k-100k, 296.1% for AGIs $100k-200k, 1862.7% for AGIs over 200k)
Net capital gain/loss in AGI: +$25,585 (reported on 33.8% of returns)
Here:
+$25,585
State:
+$49,306
(% of AGI for various income ranges: 26.9% for AGIs below $25k, 81.9% for AGIs $25k-50k, 158.8% for AGIs $50k-75k, 220.3% for AGIs $75k-100k, 549.5% for AGIs $100k-200k, 14221.6% for AGIs over 200k)
Profit/loss from business: +$21,607 (reported on 16.1% of returns)
Here:
+$21,607
State:
+$15,671
(% of AGI for various income ranges: 112.3% for AGIs below $25k, 294.0% for AGIs $25k-50k, 369.1% for AGIs $50k-75k, 406.2% for AGIs $75k-100k, 618.3% for AGIs $100k-200k, 3174.1% for AGIs over 200k)
Taxable individual retirement arrangement distribution: $23,595 (reported on 10.2% of returns)
95630:
$23,595
California:
$23,505
(% of AGI for various income ranges: 79.2% for AGIs below $25k, 193.0% for AGIs $25k-50k, 324.6% for AGIs $50k-75k, 405.2% for AGIs $75k-100k, 632.8% for AGIs $100k-200k, 1435.5% for AGIs over 200k)
Self-employed (Keogh) retirement plans: $25,947 (reported on 1.3% of returns)
95630:
$25,947
California:
$30,163
(% of AGI for various income ranges: 4.3% for AGIs below $25k, 13.0% for AGIs $50k-75k, 15.4% for AGIs $75k-100k, 49.1% for AGIs $100k-200k, 468.2% for AGIs over 200k)
Total itemized deductions: $32,522 (reported on 23.2% of returns)
Here:
$32,522
State:
$39,517
(% of AGI for various income ranges: 125.7% for AGIs below $25k, 277.5% for AGIs $25k-50k, 685.9% for AGIs $50k-75k, 1041.7% for AGIs $75k-100k, 1933.3% for AGIs $100k-200k, 6187.7% for AGIs over 200k)
Charity contributions: $7,393 (reported on 19.5% of returns)
Here:
$7,393
State:
$12,598
(% of AGI for various income ranges: 4.9% for AGIs below $25k, 28.0% for AGIs $25k-50k, 73.5% for AGIs $50k-75k, 118.9% for AGIs $75k-100k, 289.6% for AGIs $100k-200k, 1663.9% for AGIs over 200k)
Taxes paid: $9,201 (reported on 23.1% of returns)
95630:
$9,201
State:
$8,807
(% of AGI for various income ranges: 25.0% for AGIs below $25k, 63.3% for AGIs $25k-50k, 187.1% for AGIs $50k-75k, 334.4% for AGIs $75k-100k, 625.1% for AGIs $100k-200k, 1547.1% for AGIs over 200k)
Earned income credit: $1,660 (reported on 5.2% of returns)
Here:
$1,660
State:
$2,074
(% of AGI for various income ranges: 38.4% for AGIs below $25k, 38.4% for AGIs $25k-50k, 0.5% for AGIs $50k-75k)
Percentage of individuals using paid preparers for their 2020 taxes: 93.0%
Here:
93%
State:
92%
(% for various income ranges: 90.8% for AGIs below $25k, 92.2% for AGIs $25k-50k, 93.1% for AGIs $50k-75k, 92.7% for AGIs $75k-100k, 94.0% for AGIs $100k-200k, 94.7% for AGIs over 200k)
Averages for the 2012 tax year for zip code 95630, filed in 2013:
Average Adjusted Gross Income (AGI) in 2012: $93,613 (Individual Income Tax Returns)
Here:
$93,613
State:
$72,726
Salary/wage: $85,818 (reported on 83.1% of returns)
Here:
$85,818
State:
$59,079
(% of AGI for various income ranges: 67.9% for AGIs below $25k, 69.9% for AGIs $25k-50k, 73.0% for AGIs $50k-75k, 78.8% for AGIs $75k-100k, 82.6% for AGIs $100k-200k, 70.1% for AGIs over 200k)
Taxable interest for individuals: $982 (reported on 54.2% of returns)
This zip code:
$982
California:
$2,146
(% of AGI for various income ranges: 1.7% for AGIs below $25k, 1.0% for AGIs $25k-50k, 0.7% for AGIs $50k-75k, 0.6% for AGIs $75k-100k, 0.4% for AGIs $100k-200k, 0.6% for AGIs over 200k)
Ordinary dividends: $4,015 (reported on 32.2% of returns)
Here:
$4,015
State:
$9,308
(% of AGI for various income ranges: 2.4% for AGIs below $25k, 1.4% for AGIs $25k-50k, 1.2% for AGIs $50k-75k, 0.9% for AGIs $75k-100k, 1.0% for AGIs $100k-200k, 2.0% for AGIs over 200k)
Net capital gain/loss in AGI: +$7,162 (reported on 28.4% of returns)
Here:
+$7,162
State:
+$30,460
(% of AGI for various income ranges: 0.3% for AGIs $50k-75k, 0.4% for AGIs $75k-100k, 0.6% for AGIs $100k-200k, 6.0% for AGIs over 200k)
Profit/loss from business: +$18,903 (reported on 16.8% of returns)
Here:
+$18,903
State:
+$17,064
(% of AGI for various income ranges: 9.7% for AGIs below $25k, 6.4% for AGIs $25k-50k, 4.0% for AGIs $50k-75k, 2.8% for AGIs $75k-100k, 2.7% for AGIs $100k-200k, 3.2% for AGIs over 200k)
Taxable individual retirement arrangement distribution: $17,754 (reported on 10.8% of returns)
95630:
$17,754
California:
$19,557
(% of AGI for various income ranges: 4.4% for AGIs below $25k, 3.5% for AGIs $25k-50k, 3.1% for AGIs $50k-75k, 2.6% for AGIs $75k-100k, 1.8% for AGIs $100k-200k, 1.4% for AGIs over 200k)
Self-employment retirement plans: $19,651 (reported on 1.3% of returns)
95630:
$19,651
California:
$24,530
(% of AGI for various income ranges: 0.2% for AGIs below $25k, 0.1% for AGIs $50k-75k, 0.2% for AGIs $75k-100k, 0.2% for AGIs $100k-200k, 0.5% for AGIs over 200k)
Total itemized deductions: $30,620 (22% of AGI, reported on 55.2% of returns)
Here:
$30,620
State:
$34,004
Here:
22.1% of AGI
State:
22.7% of AGI
(% of AGI for various income ranges: 18.2% for AGIs below $25k, 15.3% for AGIs $25k-50k, 18.4% for AGIs $50k-75k, 17.3% for AGIs $75k-100k, 18.6% for AGIs $100k-200k, 18.0% for AGIs over 200k)
Charity contributions: $3,225 (reported on 47.8% of returns)
Here:
$3,225
State:
$4,659
(% of AGI for various income ranges: 1.1% for AGIs below $25k, 1.3% for AGIs $25k-50k, 1.6% for AGIs $50k-75k, 1.7% for AGIs $75k-100k, 1.8% for AGIs $100k-200k, 1.6% for AGIs over 200k)
Taxes paid: $12,729 (reported on 55.1% of returns)
95630:
$12,729
State:
$14,448
(% of AGI for various income ranges: 3.9% for AGIs below $25k, 3.7% for AGIs $25k-50k, 5.3% for AGIs $50k-75k, 6.2% for AGIs $75k-100k, 7.9% for AGIs $100k-200k, 9.2% for AGIs over 200k)
Earned income credit: $1,738 (reported on 6.8% of returns)
Here:
$1,738
State:
$2,286
(% of AGI for various income ranges: 3.1% for AGIs below $25k, 0.6% for AGIs $25k-50k)
Percentage of individuals using paid preparers for their 2012 taxes: 50.9%
Here:
51%
State:
64%
(% for various income ranges: 43.0% for AGIs below $25k, 50.0% for AGIs $25k-50k, 52.6% for AGIs $50k-75k, 52.7% for AGIs $75k-100k, 54.0% for AGIs $100k-200k, 59.9% for AGIs over 200k)
Averages for the 2004 tax year for zip code 95630, filed in 2005:
Average Adjusted Gross Income (AGI) in 2004: $78,955 (Individual Income Tax Returns)
Here:
$78,955
State:
$58,600
Salary/wage: $68,860 (reported on 84.9% of returns)
Here:
$68,860
State:
$49,455
(% of AGI for various income ranges: 168.2% for AGIs below $10k, 69.5% for AGIs $10k-25k, 76.0% for AGIs $25k-50k, 80.5% for AGIs $50k-75k, 84.8% for AGIs $75k-100k, 69.4% for AGIs over 100k)
Taxable interest for individuals: $1,310 (reported on 63.9% of returns)
This zip code:
$1,310
California:
$2,365
(% of AGI for various income ranges: 10.2% for AGIs below $10k, 2.9% for AGIs $10k-25k, 1.8% for AGIs $25k-50k, 1.1% for AGIs $50k-75k, 0.6% for AGIs $75k-100k, 0.9% for AGIs over 100k)
Taxable dividends: $2,106 (reported on 35.8% of returns)
Here:
$2,106
State:
$4,746
(% of AGI for various income ranges: 9.6% for AGIs below $10k, 2.3% for AGIs $10k-25k, 1.0% for AGIs $25k-50k, 0.9% for AGIs $50k-75k, 0.7% for AGIs $75k-100k, 0.9% for AGIs over 100k)
Net capital gain/loss: +$17,570 (reported on 31.1% of returns)
Here:
+$17,570
State:
+$23,418
(% of AGI for various income ranges: -3.5% for AGIs below $10k, 0.1% for AGIs $10k-25k, 0.3% for AGIs $25k-50k, 0.6% for AGIs $50k-75k, 0.7% for AGIs $75k-100k, 11.0% for AGIs over 100k)
Profit/loss from business: +$20,540 (reported on 17.5% of returns)
Here:
+$20,540
State:
+$16,826
(% of AGI for various income ranges: -0.3% for AGIs below $10k, 7.5% for AGIs $10k-25k, 5.9% for AGIs $25k-50k, 4.5% for AGIs $50k-75k, 4.0% for AGIs $75k-100k, 4.4% for AGIs over 100k)
IRA payment deduction: $3,121 (reported on 3.2% of returns)
95630:
$3,121
California:
$3,192
(% of AGI for various income ranges: 0.8% for AGIs below $10k, 0.2% for AGIs $10k-25k, 0.3% for AGIs $25k-50k, 0.2% for AGIs $50k-75k, 0.2% for AGIs $75k-100k, 0.1% for AGIs over 100k)
Self-employed pension: $15,203 (reported on 2.2% of returns)
Here:
$15,203
California:
$17,688
(% of AGI for various income ranges: 0.1% for AGIs $10k-25k, 0.2% for AGIs $25k-50k, 0.2% for AGIs $50k-75k, 0.3% for AGIs $75k-100k, 0.6% for AGIs over 100k)
Total itemized deductions: $28,428 (24% of AGI, reported on 58.6% of returns)
Here:
$28,428
State:
$28,113
Here:
24.5% of AGI
State:
25.3% of AGI
(% of AGI for various income ranges: 46.2% for AGIs below $10k, 19.1% for AGIs $10k-25k, 20.2% for AGIs $25k-50k, 23.1% for AGIs $50k-75k, 24.3% for AGIs $75k-100k, 19.9% for AGIs over 100k)
Charity contributions deductions: $3,551 (3% of AGI, reported on 53.3% of returns)
Here:
$3,551
State:
$3,923
Here:
3.0% of AGI
State:
3.3% of AGI
(% of AGI for various income ranges: 1.9% for AGIs below $10k, 1.5% for AGIs $10k-25k, 1.9% for AGIs $25k-50k, 2.2% for AGIs $50k-75k, 2.3% for AGIs $75k-100k, 2.6% for AGIs over 100k)
Total tax: $13,915 (reported on 85.7% of returns)
95630:
$13,915
State:
$10,761
(% of AGI for various income ranges: 6.3% for AGIs below $10k, 5.1% for AGIs $10k-25k, 7.8% for AGIs $25k-50k, 9.2% for AGIs $50k-75k, 9.6% for AGIs $75k-100k, 19.2% for AGIs over 100k)
Earned income credit: $1,399 (reported on 5.2% of returns)
Here:
$1,399
State:
$1,763
Percentage of individuals using paid preparers for their 2004 taxes: 54.3%
Here:
54%
State:
66%
(% for various income ranges: 42.8% for AGIs below $10k, 51.4% for AGIs $10k-25k, 53.3% for AGIs $25k-50k, 56.6% for AGIs $50k-75k, 56.2% for AGIs $75k-100k, 60.6% for AGIs over 100k)
Likely homosexual households (counted as self-reported same-sex unmarried-partner households)
Lesbian couples: 0.1% of all households
Gay men: 0.1% of all households
Household received Food Stamps/SNAP in the past 12 months: 1,564 Household did not receive Food Stamps/SNAP in the past 12 months: 26,759
Women who had a birth in the past 12 months: 846 (696 now married, 148 unmarried) Women who did not have a birth in the past 12 months: 17,102 (9,487 now married, 7,501 unmarried)
Housing units in zip code 95630 with a mortgage: 14,382 (1,295 second mortgage, 25 home equity loan, 1,144 both second mortgage and home equity loan) Houses without a mortgage: 327
Median monthly owner costs for units with a mortgage: $2,920 Median monthly owner costs for units without a mortgage: $892
Residents with income below the poverty level in 2022:
This zip code:
5.3%
Whole state:
12.2%
Residents with income below 50% of the poverty level in 2022:
This zip code:
2.4%
Whole state:
6.2%
Median number of rooms in houses and condos:
Here:
6.8
State:
6.0
Median number of rooms in apartments:
Here:
4.1
State:
3.9
Notable locations in this zip code not listed on our city pages
Notable locations in zip code 95630: Folsom Zoo (A), Folsom Rodeo Grounds (B), Folsom Lake State Recreation Area Headquarters (C), Negro Bar Campground (D), Negro Bar Area Boat Launch (E), Folsom Factory Outlets (F), Green Valley Conservation Camp (G), Orangevale Gun Club (H), Folsom State Prison (I), Folsom Prison Fire Department (J), Bureau of Land Management Folsom Field Office (K), Gingerwood House (L), Folsom History Museum (M), Folsom Library (N), Folsom Historical Society (O), First Baptist Church of Folsom (P), R G Smith Clubhouse (Q), Folsom Community Center (R), Folsom City Hall (S), Folsom Prison Museum (T). Display/hide their locations on the map
Shopping Centers: Broadstone Mall (1), Willow Creek Town Center Shopping Center (2), Folsom Shopping Center (3), Folsom Lake Shopping Center (4), Commonwealth Square Shopping Center (5), Broadstone Mall Shopping Center (6). Display/hide their locations on the map
Churches in zip code 95630 include: Christian Faith Fellowship Church (A), Community Bible Church (B), Folsom Victory Chapel (C), Lakeside Church (D), Mount Olive Lutheran Church (E), Saint Johns Catholic Church (F), Trinity Episcopal Church (G), Victorious Word Christian Center (H), Calvary Assembly of God Church (I). Display/hide their locations on the map
Parks in zip code 95630 include: Folsom Powerhouse State Historic Park (1), Dike Eight Picnic Area (2), Lew Howard Park (3), B T Collins Park (4), Briggs Ranch Mini Park (5), California Hills Neighborhood Park (6), Ed Mitchell Park (7), Folsom Recreation Center Sports Complex (8), Lembi Park (9). Display/hide their locations on the map
14,817 married couples with children.
2,275 single-parent households (947 men, 1,328 women).
75.3% of residents of 95630 zip code speak English at home.
5.1% of residents speak Spanish at home (82% very well, 11% well, 5% not well, 2% not at all).
8.7% of residents speak other Indo-European language at home (83% very well, 12% well, 4% not well, 1% not at all).
9.1% of residents speak Asian or Pacific Island language at home (68% very well, 24% well, 6% not well, 1% not at all).
1.6% of residents speak other language at home (90% very well, 9% well, 1% not well).
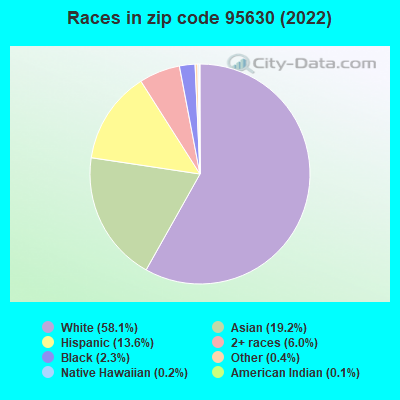
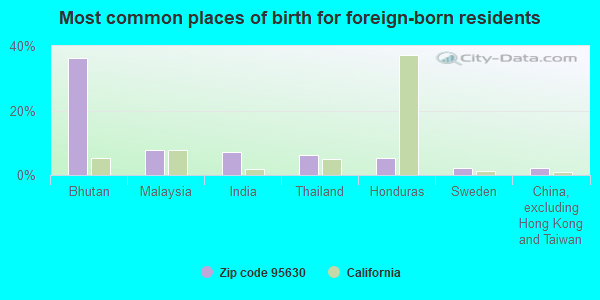
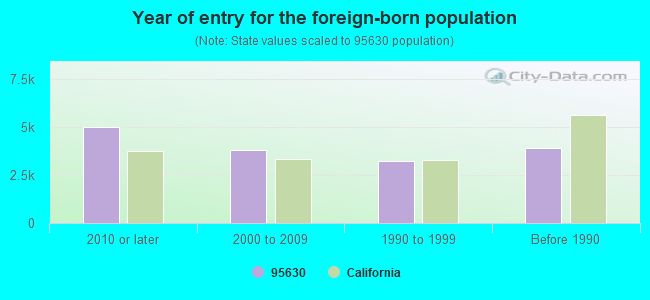
Foreign born population: 14,516 (19.1%) (61.9% of them are naturalized citizens)
Major facilities with environmental interests located in this zip code:
JIFFY LUBE #1142 (709 E BIDWELL ST in FOLSOM, CA)
STATE MASTER (California - Hazardous Waste Tracking) - HAZARDOU WASTE PROGRAM Small Quantity Generators, between 100 kg and 1000 kg of hazardous waste/month (Resource Conservation and Recovery Act (tracking hazardous waste)) - notification STATE MASTER (California - Used Oil Recycling System ) - USED OIL RECYCLING Organizations: PENNZOIL CO (CONTACT/OWNER)
Alternative names: JIFFY LUBE INTERNATIONAL, JIFFY LUBE STORE 1142
FOLSOM LAKE FORD INC (12755 FOLSOM BLVD in FOLSOM, CA)
STATE MASTER (California - Hazardous Waste Tracking) - HAZARDOU WASTE PROGRAM Small Quantity Generators, between 100 kg and 1000 kg of hazardous waste/month (Resource Conservation and Recovery Act (tracking hazardous waste)) - notification STATE MASTER (California - Used Oil Recycling System ) - USED OIL RECYCLING Organizations: CHARLES PETERSON (CONTACT/OWNER)
AGILENT TECHNOLOGIES INC (91 BLUE RAVINE ROAD in FOLSOM, CA)
STATE MASTER (California - Hazardous Waste Tracking) - HAZARDOU WASTE PROGRAM HAZARDOUS WASTE BIENNIAL REPORTER (Resource Conservation and Recovery Act (tracking hazardous waste)) Large Quantity Generators, more that 1000 kg of hazardous waste/month (Resource Conservation and Recovery Act (tracking hazardous waste)) - notification Alternative names: J&W SCIENTIFIC INCORPORATED
FOLSOM CITY OF (48 NATOMA ST in FOLSOM, CA)
STATE MASTER (California - Hazardous Waste Tracking) - HAZARDOU WASTE PROGRAM National Pollutant Discharge Elimination System NON-MAJOR (Tracking pollutant discharge elimination systems) - permit Small Quantity Generators, between 100 kg and 1000 kg of hazardous waste/month (Resource Conservation and Recovery Act (tracking hazardous waste)) Business SIC classification: SEWERAGE SYSTEMS Organizations: FOLSOM, CITY OF (CONTACT/OWNER)
Alternative names: CITY OF FOLSOM FIRE DEPT, FOLSOM SEWAGE COLLECTION SYS
INTEL CORPORATION (1900 PRAIRIE CITY ROAD in FOLSOM, CA)
STATE MASTER (California - Hazardous Waste Tracking) - HAZARDOU WASTE PROGRAM CRITERIA AND HAZARDOUS AIR POLLUTANT INVENTORY (Inventory of air pollution sources) Small Quantity Generators, between 100 kg and 1000 kg of hazardous waste/month (Resource Conservation and Recovery Act (tracking hazardous waste)) Business SIC classification: SEMICONDUCTORS AND RELATED DEVICES Business NAICS classification: SEMICONDUCTOR AND RELATED DEVICE MANUFACTURING.; SEMICONDUCTOR AND RELATED DEVICE MANUFACTURING.
FOLSOM COLLISION CENTER (300 PLAZA DR in FOLSOM, CA)
STATE MASTER (California - Hazardous Waste Tracking) - HAZARDOU WASTE PROGRAM Small Quantity Generators, between 100 kg and 1000 kg of hazardous waste/month (Resource Conservation and Recovery Act (tracking hazardous waste)) Business NAICS classification: AUTOMOTIVE BODY, PAINT, AND INTERIOR REPAIR AND MAINTENANCE. Organizations: DARRYL FONTANA (CONTACT/OPERATOR)
, CHUCK PETERSON (CONTACT/OWNER)
MERCY HOSPITAL OF FOLSOM (1650 CREEKSIDE DR in FOLSOM, CA)
STATE MASTER (California - Hazardous Waste Tracking) - HAZARDOU WASTE PROGRAM CRITERIA AND HAZARDOUS AIR POLLUTANT INVENTORY (Inventory of air pollution sources) Small Quantity Generators, between 100 kg and 1000 kg of hazardous waste/month (Resource Conservation and Recovery Act (tracking hazardous waste)) - notification Business SIC and NAICS classification: GENERAL MEDICAL AND SURGICAL HOSPITALS Organizations: MERCY HEALTHCARE SACRAMENTO (CONTACT/OWNER)
EQUILON ENTERPRISES (301 E BIDWELL in FOLSOM, CA) . Federal Facility
STATE MASTER (California - Hazardous Waste Tracking) - HAZARDOU WASTE PROGRAM Small Quantity Generators, between 100 kg and 1000 kg of hazardous waste/month (Resource Conservation and Recovery Act (tracking hazardous waste)) - notification Organizations: EQUILON ENTERPRISES, LLC (CONTACT/OWNER)
Alternative names: SHELL OIL CO
L3 COMMUNICATIONS NARDA MICROWAVE WEST (107 WOODMERE RD in FOLSOM, CA)
STATE MASTER (California - Hazardous Waste Tracking) - HAZARDOU WASTE PROGRAM Small Quantity Generators, between 100 kg and 1000 kg of hazardous waste/month (Resource Conservation and Recovery Act (tracking hazardous waste)) - notification Organizations: SAL RUBINO (CONTACT/OWNER)
Alternative names: L3 COMMUNICATIONS NARDA WEST
FOLSOM CLEANERS (316 E BIDWELL in FOLSOM, CA)
STATE MASTER (California - Hazardous Waste Tracking) - HAZARDOU WASTE PROGRAM Small Quantity Generators, between 100 kg and 1000 kg of hazardous waste/month (Resource Conservation and Recovery Act (tracking hazardous waste))
FOLSOM LAKE USED CAR OUTLET (1 AUTO PLAZA DR in FOLSOM, CA)
STATE MASTER (California - Hazardous Waste Tracking) - HAZARDOU WASTE PROGRAM Small Quantity Generators, between 100 kg and 1000 kg of hazardous waste/month (Resource Conservation and Recovery Act (tracking hazardous waste)) - notification Organizations: MR CHUCK PETERSON (CONTACT/OWNER)
FOLSOM CHEVROLET GEO (12655 AUTO MALL CIR in FOLSOM, CA)
STATE MASTER (California - Hazardous Waste Tracking) - HAZARDOU WASTE PROGRAM Small Quantity Generators, between 100 kg and 1000 kg of hazardous waste/month (Resource Conservation and Recovery Act (tracking hazardous waste)) - notification Organizations: FOLSOM CHEVROLET INC (CONTACT/OWNER)
Alternative names: FOLSOM CHEVROLET/GEO INC DBA FOLSOM CHEV
CHEVRON STATION NO 209655 (1890 PRAIRIE CITY RD in FOLSOM, CA)
STATE MASTER (California - Hazardous Waste Tracking) - HAZARDOU WASTE PROGRAM Small Quantity Generators, between 100 kg and 1000 kg of hazardous waste/month (Resource Conservation and Recovery Act (tracking hazardous waste)) - notification Organizations: CHEVRON PRODUCTS CO (CONTACT/OWNER)
Housing units lacking complete plumbing facilities: 0.2% Housing units lacking complete kitchen facilities: 0.6%
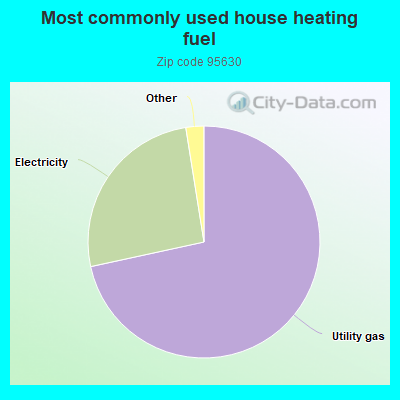
71.6%Utility gas
25.9%Electricity
0.8%Solar energy
0.7%No fuel used
0.6%Bottled, tank, or LP gas
Population in 1990: 38,587. Population change in the 1990s: +13,262 (+34.4%).
Place of birth for U.S.-born residents:
This state: 44,509
Northeast: 3,986
Midwest: 4,121
South: 3,354
West: 4,116
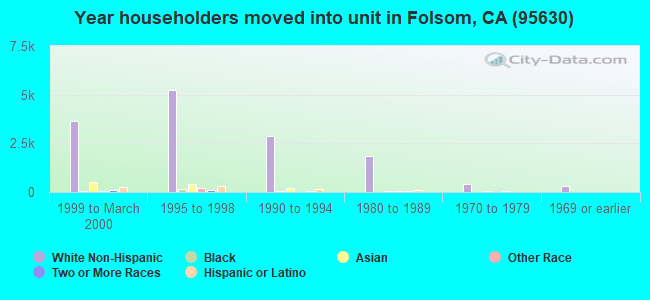
40% of the 95630 zip code residents lived in the same house 5 years ago. Out of people who lived in different houses, 46% lived in this county. Out of people who lived in different counties, 50% lived in California.
86% of the 95630 zip code residents lived in the same house 1 year ago. Out of people who lived in different houses, 46% moved from this county. Out of people who lived in different houses, 35% moved from different county within same state. Out of people who lived in different houses, 13% moved from different state. Out of people who lived in different houses, 6% moved from abroad.
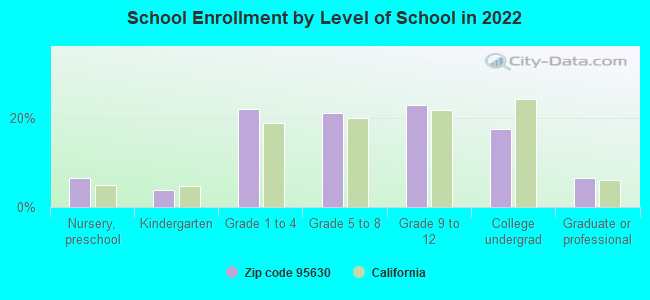
Private vs. public school enrollment:
Students in private schools in grades 1 to 8 (elementary and middle school): 687
Here:
7.9%
California:
10.5%
Students in private schools in grades 9 to 12 (high school): 171
Here:
3.7%
California:
8.5%
Students in private undergraduate colleges: 410
Here:
11.7%
California:
15.9%
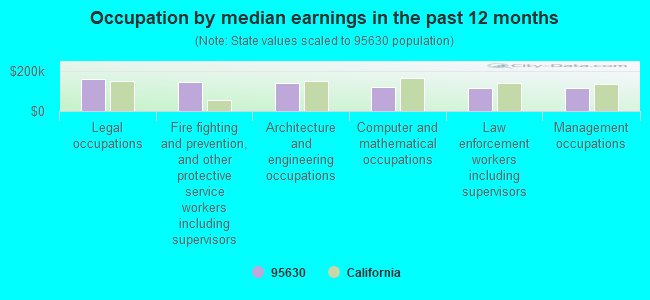
Occupation by median earnings in the past 12 months ($)
157,623Legal occupations
143,930Fire fighting and prevention, and other protective service workers including supervisors
138,112Architecture and engineering occupations
120,434Computer and mathematical occupations
115,361Law enforcement workers including supervisors
114,664Management occupations
Companies with biggest federal contracts located in this zip code (FOLSOM, CA):
JMR CONSTRUCTION CORP (90 BLUE RAVINE ROAD, SUITE; small business) : $22,638,061 in 118 contractsfrom 2000 to 2006
Contracts for Maintenance, Repair or Alteration of Real Property -- Other Administrative Facilities and Service Buildings, Construction of Structures and Facilities -- Other Non-Building Facilities, Maintenance, Repair or Alteration of Real Property -- Office Buildings, Construction of Structures and Facilities -- Office Buildings, and moreby Air Force, Navy, Public Buildings Service Signed by year:2000: $52,162; 2001: $389,994; 2002: $3,026,653; 2003: $3,168,654; 2004: $10,516,322; 2005: $2,548,174; 2006: $2,936,102.
Biggest contracts:
$3,671,366 with Air Force for Maintenance, Repair or Alteration of Real Property -- Other Administrative Facilities and Service Buildings. Taking place in NV. Signed on 2004-09-30. Completion date: 2005-07-27.
$2,351,146, same as above.Signed on 2004-09-28. Completion date: 2005-07-27.
$2,050,690 with Navy for Construction of Structures and Facilities -- Other Non-Building Facilities. Signed on 2004-08-02. Completion date: 2005-07-03.
$1,523,689 with Public Buildings Service for Maintenance, Repair or Alteration of Real Property -- Office Buildings. Signed on 2003-05-15. Completion date: 2003-08-15.
WILSON COMPOSITE TECHNOLOGIES, (1004 RIVER ROCK DRIVE, SUI; small business) : $6,193,663 in 22 contractsfrom 2001 to 2006
Contracts for Defense Missile and Space Systems -- Management and Support (R&D), Defense Missile and Space Systems -- Applied Research and Exploratory Development (R&D), Defense Missile and Space Systems -- Advanced Development (R&D), Defense Missile and Space Systems -- Basic Research (R&D), and moreby Air Force, Federal Technology Service, Missile Defense Agency, Department of Defense, and others Signed by year:2000: $0; 2001: $673,953; 2002: $1,959,462; 2003: $3,248,802; 2004: $211,470; 2005: $0; 2006: $99,976.
Biggest contracts:
$1,174,240 with Air Force for Defense Missile and Space Systems -- Management and Support (R&D). Signed on 2002-06-18. Completion date: 2004-07-30.
$1,125,000 with Air Force for Defense Missile and Space Systems -- Applied Research and Exploratory Development (R&D). Signed on 2003-06-03. Completion date: 2005-05-15.
$497,590 with Air Force for Defense Missile and Space Systems -- Advanced Development (R&D). Signed on 2003-02-24. Completion date: 2004-04-30.
$414,970, same as above.Signed on 2003-09-29. Completion date: 2004-04-30.
EM-ASSIST/AEEC (90 BLUE RAVINE RD; small business) : $5,485,496 in 27 contractsfrom 2003 to 2006
Contracts for Other Architect and Engineering Services by Air Force Signed by year:2000: $0; 2001: $0; 2002: $0; 2003: $423,105; 2004: $740,481; 2005: $1,422,977; 2006: $2,898,933.
Biggest contracts:
$999,506 with Air Force for Other Architect and Engineering Services. Taking place in UT. Signed on 2006-03-21. Completion date: 2007-05-31.
$699,283, same as above.Signed on 2005-03-23. Completion date: 2006-04-28.
$688,690, same as above.Signed on 2006-02-09. Completion date: 2007-05-31.
$423,105, same as above.Signed on 2003-09-25. Completion date: 2004-09-30.
VISIONARY INTEGRATION PROFESSI (160 BLUE RAVINE ROAD, SUIT; small business) : $4,762,687 in 28 contractsfrom 2002 to 2006
Contracts for Other Professional Services, ADP Systems Development Services, Logistics Support Services, Other Management Support Services, and moreby Transportation Security Administration, EDUCATION, Department of, Department of Defense, U.S. Special Operations Command, and others Signed by year:2000: $0; 2001: $0; 2002: $77,654; 2003: $335,971; 2004: $1,729,546; 2005: $1,100,559; 2006: $1,518,957.
Biggest contracts:
$1,115,919 with Transportation Security Administration for Other Professional Services. Taking place in VA. Signed on 2006-01-06. Effective on 2006-01-09. Completion date: 2007-01-08.
$660,802 with EDUCATION, Department of for ADP Systems Development Services. Taking place in DC. Signed on 2004-04-28. Effective on 2004-04-30. Completion date: 2009-04-29.
$608,813 with EDUCATION, Department of for ADP Systems Development Services. Taking place in VA. Signed on 2004-04-27. Completion date: 2004-09-30.
$606,034 with EDUCATION, Department of for ADP Systems Development Services. Taking place in DC. Signed on 2005-05-06. Completion date: 2006-05-16.
L-3 COMMUNICATIONS CORPORATION (107 WOODMERE RD) : $4,480,138 in 70 contractsfrom 1999 to 2006
Contracts for Filters and Networks, Miscellaneous Communication Equipment, Oscillators and Piezoelectric Crystals, Amplifiers, and moreby Navy, Defense Logistics Agency, Air Force, Army, and others Signed by year:2000: $1,050,100; 2001: $391,973; 2002: $505,095; 2003: $149,789; 2004: $969,627; 2005: $878,835; 2006: $417,519.
Biggest contracts:
$492,560 with Navy for Filters and Networks. Signed on 2000-02-24. Completion date: 2001-05-24.
$472,160, same as above.Signed on 2005-08-09. Completion date: 2006-03-31.
$320,784, same as above.Signed on 2002-06-12. Completion date: 2003-02-12.
$268,590, same as above.Signed on 2004-11-19. Completion date: 2005-11-19.
INFINITE TECHNOLOGIES INC (7930 FOLSOM AUBURN ROAD; small business) : $3,264,933 in 10 contractsfrom 2003 to 2006
Contracts for ADP Systems Development Services, Other Professional Services, ADP Facility Operation and Maintenance Services by Air Force Signed by year:2000: $0; 2001: $0; 2002: $0; 2003: $90,129; 2004: $403,274; 2005: $2,540,469; 2006: $231,061.
Biggest contracts:
$2,278,328 with Air Force for ADP Systems Development Services. Signed on 2005-09-16. Completion date: 2006-09-15.
$216,508 with Air Force for Other Professional Services. Taking place in UT. Signed on 2006-05-23. Completion date: 2007-06-04.
$210,210, same as above.Signed on 2005-06-01. Completion date: 2005-06-03.
$204,078 with Air Force for ADP Facility Operation and Maintenance Services. Taking place in UT. Signed on 2004-06-03. Completion date: 2005-06-04.
AIRTOUCH CELLULAR (255 PARKSHORE DR) : $1,673,858 in 14 contractsfrom 1999 to 2001
Contracts for Telephone and/or Communications Services (includes Telegraph, Telex, and Cablevision Services), Telephone and Telegraph Equipment, ADP Telecommunications and Transmission Services by Army, U.S. Army Corps of Engineers - civil program financing only Signed by year:2000: $722,998; 2001: $59,305; 2002: $0; 2003: $0; 2004: $0; 2005: $0; 2006: $0.
Biggest contracts:
$699,983 with Army for Telephone and/or Communications Services (includes Telegraph, Telex, and Cablevision Services). Taking place in KY. Signed on 1999-10-25. Completion date: 2000-12-30.
$589,614, same as above.Signed on 2000-07-26. Completion date: 2000-11-30.
$142,440 with Army for Telephone and/or Communications Services (includes Telegraph, Telex, and Cablevision Services). Taking place in GA. Signed on 1999-12-27. Completion date: 2000-09-29.
$124,656 with Army for Telephone and/or Communications Services (includes Telegraph, Telex, and Cablevision Services). Taking place in KY. Signed on 2000-04-13. Completion date: 2000-12-30.
BURLESON/GAIA (1625 CREEKSIDE DR STE 202; small business) : $1,014,574 in 13 contractsfrom 2003 to 2005
Contracts for Hazardous Substance Analysis, Other Environmental Services, Studies, and Analytical Support, Hazardous Substance Removal, Cleanup, and Disposal Services and Operational Support by Army, U.S. Army Corps of Engineers - civil program financing only Signed by year:2000: $0; 2001: $0; 2002: $0; 2003: $216,717; 2004: $252,900; 2005: $544,957; 2006: $0.
Biggest contracts:
$216,717 with Army for Hazardous Substance Analysis. Taking place in NV. Signed on 2003-08-19. Completion date: 2004-08-13.
$154,596 with Army for Other Environmental Services, Studies, and Analytical Support. Taking place in NV. Signed on 2005-04-01. Completion date: 2005-09-26.
$153,801 with Army for Hazardous Substance Removal, Cleanup, and Disposal Services and Operational Support. Signed on 2005-08-31. Completion date: 2006-08-30.
$100,000, same as above.Signed on 2004-09-30. Completion date: 2005-09-30.
STANFIELD SYSTEMS INCORPORATED (718 SUTTER STREET SUITE 10; small business) : $932,351 in 4 contractsfrom 2004 to 2006
$375,000 with Air Force for Other Defense -- Applied Research and Exploratory Development (R&D). Signed on 2005-07-13. Completion date: 2007-07-11.
$360,415, same as above.Signed on 2006-04-19. Completion date: 2007-07-11.
$99,621, same as above.Signed on 2004-04-29. Completion date: 2005-04-28.
$97,315 with Department of Veterans Affairs for Miscellaneous Items. Taking place in DC. Signed on 2005-10-10. Completion date: 2006-09-30.
WASTE CONNECTIONS INC (35 IRON POINT CIR STE 200; small business) : $541,001 in 45 contractsfrom 2000 to 2006
Contracts for Trash/Garbage Collection Services - Including Portable Sanitation Services, Waste Treatment and Storage, Landscaping/Groundskeeping Services by Department of Veterans Affairs, National Park Service, Public Buildings Service, Bureau of Prisoners/Federal Prison System, and others Signed by year:2000: $32,000; 2001: $70,996; 2002: $101,927; 2003: $75,106; 2004: $85,541; 2005: $148,682; 2006: $26,749.
Biggest contracts:
$47,558 with Department of Veterans Affairs for Trash/Garbage Collection Services - Including Portable Sanitation Services. Taking place in CO. Signed on 2005-04-06. Effective on 2005-04-01. Completion date: 2006-02-28.
$38,000 with National Park Service for Trash/Garbage Collection Services - Including Portable Sanitation Services. Signed on 2002-01-15. Completion date: 2001-12-15.
$36,838, same as above.Signed on 2003-02-15. Completion date: 2001-12-15.
$34,840, same as above.Signed on 2005-10-01. Completion date: 2006-09-30.
Top industries in this zip code by the number of employees in 2005:
2005 - 2018 National Fire Incident Reporting System (NFIRS) incidents
According to the data from the years 2005 - 2018 the average number of fires per year is 29. The highest number of reported fires - 157 took place in 2005, and the least - 0 in 2006. The data has a declining trend.
When looking into fire subcategories, the most incidents belonged to: Outside Fires (44.3%), and Structure Fires (30.9%).
Fire incident types reported to NFIRS in Zip Code 95630


 Nearest zip codes: 95762, 95662, 95746, 95742, 95628, 95661.


 According to the data from the years 2005 - 2018 the average number of fires per year is 29. The highest number of reported fires - 157 took place in 2005, and the least - 0 in 2006. The data has a declining trend.
 When looking into fire subcategories, the most incidents belonged to: Outside Fires (44.3%), and Structure Fires (30.9%).