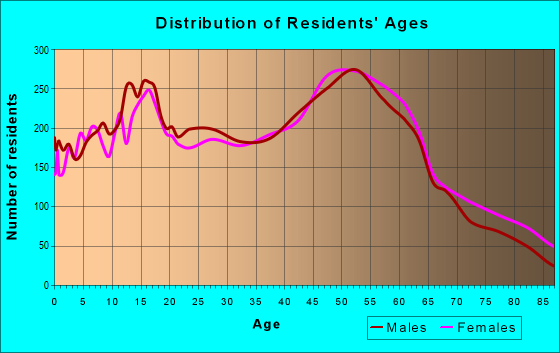
Estimated zip code population in 2022: 32,166 Zip code population in 2010: 31,558 Zip code population in 2000: 32,035
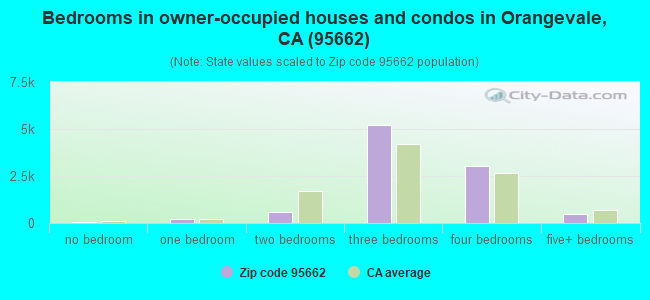
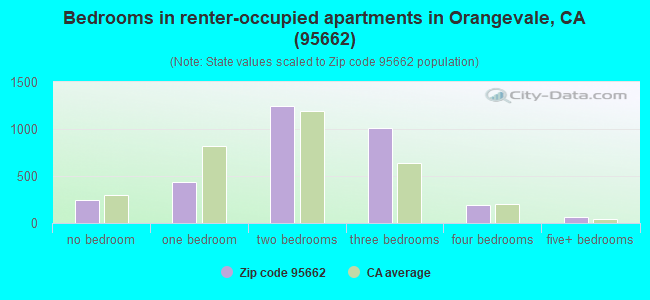
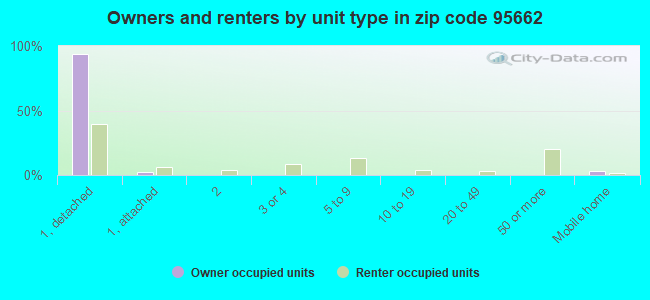
Houses and condos: 13,408 Renter-occupied apartments: 3,192
% of renters here:
25%
State:
44%
March 2022 cost of living index in zip code 95662: 101.5 (near average, U.S. average is 100)
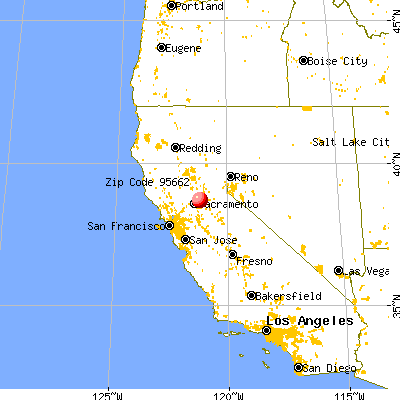
Land area: 10.9 sq. mi. Water area: 0.1 sq. mi.
Population density: 2,959 people per square mile
(average).
OSM Map
General Map
Google Map
MSN Map
OSM Map
General Map
Google Map
MSN Map
OSM Map
General Map
Google Map
MSN Map
OSM Map
General Map
Google Map
MSN Map
Please wait while loading the map...
Real estate property taxes paid for housing units in 2022:
This zip code:
0.7% ($3,470)
California:
0.7% ($4,831)
Median real estate property taxes paid for housing units with mortgages in 2022: $3,783 (0.7%) Median real estate property taxes paid for housing units with no mortgage in 2022: $2,891 (0.6%)
Averages for the 2020 tax year for zip code 95662, filed in 2021:
Average Adjusted Gross Income (AGI) in 2020: $78,211 (Individual Income Tax Returns)
Here:
$78,211
State:
$95,910
Salary/wage: $67,543 (reported on 75.9% of returns)
Here:
$67,543
State:
$77,331
(% of AGI for various income ranges: 1158.7% for AGIs below $25k, 3734.7% for AGIs $25k-50k, 6832.7% for AGIs $50k-75k, 9758.3% for AGIs $75k-100k, 19029.6% for AGIs $100k-200k, 65903.7% for AGIs over 200k)
Taxable interest for individuals: $980 (reported on 47.1% of returns)
This zip code:
$980
California:
$2,294
(% of AGI for various income ranges: 18.6% for AGIs below $25k, 23.1% for AGIs $25k-50k, 48.3% for AGIs $50k-75k, 73.8% for AGIs $75k-100k, 123.7% for AGIs $100k-200k, 1040.4% for AGIs over 200k)
Ordinary dividends: $5,296 (reported on 20.4% of returns)
Here:
$5,296
State:
$10,949
(% of AGI for various income ranges: 29.9% for AGIs below $25k, 45.1% for AGIs $25k-50k, 97.3% for AGIs $50k-75k, 131.9% for AGIs $75k-100k, 263.6% for AGIs $100k-200k, 3085.9% for AGIs over 200k)
Net capital gain/loss in AGI: +$17,381 (reported on 19.3% of returns)
Here:
+$17,381
State:
+$49,306
(% of AGI for various income ranges: 6.7% for AGIs below $25k, 39.1% for AGIs $25k-50k, 84.6% for AGIs $50k-75k, 137.0% for AGIs $75k-100k, 460.6% for AGIs $100k-200k, 15861.5% for AGIs over 200k)
Profit/loss from business: +$16,014 (reported on 16.6% of returns)
Here:
+$16,014
State:
+$15,671
(% of AGI for various income ranges: 131.3% for AGIs below $25k, 283.1% for AGIs $25k-50k, 434.9% for AGIs $50k-75k, 497.4% for AGIs $75k-100k, 622.6% for AGIs $100k-200k, 3777.8% for AGIs over 200k)
Taxable individual retirement arrangement distribution: $18,362 (reported on 10.1% of returns)
95662:
$18,362
California:
$23,505
(% of AGI for various income ranges: 62.8% for AGIs below $25k, 135.7% for AGIs $25k-50k, 228.0% for AGIs $50k-75k, 333.2% for AGIs $75k-100k, 693.5% for AGIs $100k-200k, 2304.8% for AGIs over 200k)
Self-employed (Keogh) retirement plans: $17,767 (reported on 0.6% of returns)
95662:
$17,767
California:
$30,163
(% of AGI for various income ranges: 20.9% for AGIs $50k-75k, 27.3% for AGIs $100k-200k, 303.0% for AGIs over 200k)
Total itemized deductions: $34,127 (reported on 16.2% of returns)
Here:
$34,127
State:
$39,517
(% of AGI for various income ranges: 118.9% for AGIs below $25k, 233.1% for AGIs $25k-50k, 678.2% for AGIs $50k-75k, 1039.4% for AGIs $75k-100k, 1729.6% for AGIs $100k-200k, 11097.8% for AGIs over 200k)
Charity contributions: $8,569 (reported on 13.1% of returns)
Here:
$8,569
State:
$12,598
(% of AGI for various income ranges: 6.2% for AGIs below $25k, 18.6% for AGIs $25k-50k, 69.0% for AGIs $50k-75k, 117.3% for AGIs $75k-100k, 304.4% for AGIs $100k-200k, 3743.7% for AGIs over 200k)
Taxes paid: $8,315 (reported on 16.2% of returns)
95662:
$8,315
State:
$8,807
(% of AGI for various income ranges: 19.9% for AGIs below $25k, 41.6% for AGIs $25k-50k, 174.4% for AGIs $50k-75k, 325.9% for AGIs $75k-100k, 547.9% for AGIs $100k-200k, 1776.3% for AGIs over 200k)
Earned income credit: $1,755 (reported on 9.5% of returns)
Here:
$1,755
State:
$2,074
(% of AGI for various income ranges: 62.7% for AGIs below $25k, 44.2% for AGIs $25k-50k, 0.7% for AGIs $50k-75k)
Percentage of individuals using paid preparers for their 2020 taxes: 92.8%
Here:
93%
State:
92%
(% for various income ranges: 90.6% for AGIs below $25k, 93.5% for AGIs $25k-50k, 93.5% for AGIs $50k-75k, 92.6% for AGIs $75k-100k, 94.0% for AGIs $100k-200k, 94.5% for AGIs over 200k)
Averages for the 2012 tax year for zip code 95662, filed in 2013:
Average Adjusted Gross Income (AGI) in 2012: $61,609 (Individual Income Tax Returns)
Here:
$61,609
State:
$72,726
Salary/wage: $53,386 (reported on 79.1% of returns)
Here:
$53,386
State:
$59,079
(% of AGI for various income ranges: 65.9% for AGIs below $25k, 71.0% for AGIs $25k-50k, 71.8% for AGIs $50k-75k, 72.1% for AGIs $75k-100k, 75.5% for AGIs $100k-200k, 45.9% for AGIs over 200k)
Taxable interest for individuals: $944 (reported on 46.4% of returns)
This zip code:
$944
California:
$2,146
(% of AGI for various income ranges: 1.2% for AGIs below $25k, 0.7% for AGIs $25k-50k, 0.6% for AGIs $50k-75k, 0.6% for AGIs $75k-100k, 0.5% for AGIs $100k-200k, 1.3% for AGIs over 200k)
Ordinary dividends: $4,459 (reported on 19.9% of returns)
Here:
$4,459
State:
$9,308
(% of AGI for various income ranges: 1.7% for AGIs below $25k, 0.9% for AGIs $25k-50k, 0.8% for AGIs $50k-75k, 0.6% for AGIs $75k-100k, 0.9% for AGIs $100k-200k, 4.3% for AGIs over 200k)
Net capital gain/loss in AGI: +$6,541 (reported on 16.4% of returns)
Here:
+$6,541
State:
+$30,460
(% of AGI for various income ranges: 0.1% for AGIs $25k-50k, 0.3% for AGIs $50k-75k, 0.3% for AGIs $75k-100k, 1.0% for AGIs $100k-200k, 8.5% for AGIs over 200k)
Profit/loss from business: +$14,638 (reported on 17.0% of returns)
Here:
+$14,638
State:
+$17,064
(% of AGI for various income ranges: 10.9% for AGIs below $25k, 6.3% for AGIs $25k-50k, 3.0% for AGIs $50k-75k, 2.5% for AGIs $75k-100k, 3.1% for AGIs $100k-200k, 3.7% for AGIs over 200k)
Taxable individual retirement arrangement distribution: $13,834 (reported on 10.3% of returns)
95662:
$13,834
California:
$19,557
(% of AGI for various income ranges: 3.1% for AGIs below $25k, 2.6% for AGIs $25k-50k, 2.1% for AGIs $50k-75k, 2.5% for AGIs $75k-100k, 2.2% for AGIs $100k-200k, 2.0% for AGIs over 200k)
Self-employment retirement plans: $15,611 (reported on 0.6% of returns)
95662:
$15,611
California:
$24,530
(% of AGI for various income ranges: 0.2% for AGIs $50k-75k, 0.1% for AGIs $100k-200k, 0.5% for AGIs over 200k)
Total itemized deductions: $23,790 (24% of AGI, reported on 42.1% of returns)
Here:
$23,790
State:
$34,004
Here:
23.6% of AGI
State:
22.7% of AGI
(% of AGI for various income ranges: 15.1% for AGIs below $25k, 13.2% for AGIs $25k-50k, 15.5% for AGIs $50k-75k, 17.5% for AGIs $75k-100k, 18.2% for AGIs $100k-200k, 14.8% for AGIs over 200k)
Charity contributions: $3,178 (reported on 35.4% of returns)
Here:
$3,178
State:
$4,659
(% of AGI for various income ranges: 0.9% for AGIs below $25k, 1.1% for AGIs $25k-50k, 1.5% for AGIs $50k-75k, 2.0% for AGIs $75k-100k, 2.3% for AGIs $100k-200k, 1.9% for AGIs over 200k)
Taxes paid: $8,235 (reported on 42.0% of returns)
95662:
$8,235
State:
$14,448
(% of AGI for various income ranges: 3.1% for AGIs below $25k, 2.8% for AGIs $25k-50k, 4.1% for AGIs $50k-75k, 5.3% for AGIs $75k-100k, 7.0% for AGIs $100k-200k, 8.1% for AGIs over 200k)
Earned income credit: $1,848 (reported on 13.3% of returns)
Here:
$1,848
State:
$2,286
(% of AGI for various income ranges: 4.2% for AGIs below $25k, 0.9% for AGIs $25k-50k)
Percentage of individuals using paid preparers for their 2012 taxes: 50.8%
Here:
51%
State:
64%
(% for various income ranges: 44.2% for AGIs below $25k, 48.8% for AGIs $25k-50k, 52.9% for AGIs $50k-75k, 55.9% for AGIs $75k-100k, 58.9% for AGIs $100k-200k, 73.5% for AGIs over 200k)
Averages for the 2004 tax year for zip code 95662, filed in 2005:
Average Adjusted Gross Income (AGI) in 2004: $51,520 (Individual Income Tax Returns)
Here:
$51,520
State:
$58,600
Salary/wage: $46,787 (reported on 82.3% of returns)
Here:
$46,787
State:
$49,455
(% of AGI for various income ranges: 150.0% for AGIs below $10k, 69.3% for AGIs $10k-25k, 76.1% for AGIs $25k-50k, 78.7% for AGIs $50k-75k, 81.3% for AGIs $75k-100k, 67.9% for AGIs over 100k)
Taxable interest for individuals: $1,231 (reported on 54.2% of returns)
This zip code:
$1,231
California:
$2,365
(% of AGI for various income ranges: 7.6% for AGIs below $10k, 2.0% for AGIs $10k-25k, 1.3% for AGIs $25k-50k, 0.9% for AGIs $50k-75k, 0.9% for AGIs $75k-100k, 1.4% for AGIs over 100k)
Taxable dividends: $1,850 (reported on 24.5% of returns)
Here:
$1,850
State:
$4,746
(% of AGI for various income ranges: 4.3% for AGIs below $10k, 1.2% for AGIs $10k-25k, 0.7% for AGIs $25k-50k, 0.6% for AGIs $50k-75k, 0.5% for AGIs $75k-100k, 1.2% for AGIs over 100k)
Net capital gain/loss: +$10,436 (reported on 19.6% of returns)
Here:
+$10,436
State:
+$23,418
(% of AGI for various income ranges: -2.6% for AGIs below $10k, 0.7% for AGIs $10k-25k, 0.4% for AGIs $25k-50k, 0.5% for AGIs $50k-75k, 1.0% for AGIs $75k-100k, 9.7% for AGIs over 100k)
Profit/loss from business: +$16,724 (reported on 18.0% of returns)
Here:
+$16,724
State:
+$16,826
(% of AGI for various income ranges: 1.0% for AGIs below $10k, 9.8% for AGIs $10k-25k, 5.2% for AGIs $25k-50k, 5.1% for AGIs $50k-75k, 4.3% for AGIs $75k-100k, 6.6% for AGIs over 100k)
IRA payment deduction: $3,062 (reported on 2.9% of returns)
95662:
$3,062
California:
$3,192
(% of AGI for various income ranges: 0.7% for AGIs below $10k, 0.2% for AGIs $10k-25k, 0.3% for AGIs $25k-50k, 0.2% for AGIs $50k-75k, 0.1% for AGIs $75k-100k, 0.1% for AGIs over 100k)
Self-employed pension: $13,069 (reported on 1.5% of returns)
Here:
$13,069
California:
$17,688
(% of AGI for various income ranges: 0.2% for AGIs $10k-25k, 0.1% for AGIs $25k-50k, 0.2% for AGIs $50k-75k, 0.2% for AGIs $75k-100k, 0.7% for AGIs over 100k)
Total itemized deductions: $21,791 (27% of AGI, reported on 46.3% of returns)
Here:
$21,791
State:
$28,113
Here:
26.7% of AGI
State:
25.3% of AGI
(% of AGI for various income ranges: 37.6% for AGIs below $10k, 15.8% for AGIs $10k-25k, 17.4% for AGIs $25k-50k, 20.8% for AGIs $50k-75k, 21.4% for AGIs $75k-100k, 19.3% for AGIs over 100k)
Charity contributions deductions: $2,772 (3% of AGI, reported on 41.4% of returns)
Here:
$2,772
State:
$3,923
Here:
3.3% of AGI
State:
3.3% of AGI
(% of AGI for various income ranges: 1.8% for AGIs below $10k, 1.3% for AGIs $10k-25k, 1.7% for AGIs $25k-50k, 2.3% for AGIs $50k-75k, 2.4% for AGIs $75k-100k, 2.6% for AGIs over 100k)
Total tax: $6,939 (reported on 82.0% of returns)
95662:
$6,939
State:
$10,761
(% of AGI for various income ranges: 6.2% for AGIs below $10k, 5.3% for AGIs $10k-25k, 7.2% for AGIs $25k-50k, 8.9% for AGIs $50k-75k, 9.9% for AGIs $75k-100k, 15.8% for AGIs over 100k)
Earned income credit: $1,498 (reported on 9.7% of returns)
Here:
$1,498
State:
$1,763
Percentage of individuals using paid preparers for their 2004 taxes: 55.0%
Here:
55%
State:
66%
(% for various income ranges: 43.6% for AGIs below $10k, 52.2% for AGIs $10k-25k, 55.0% for AGIs $25k-50k, 58.7% for AGIs $50k-75k, 59.0% for AGIs $75k-100k, 66.9% for AGIs over 100k)
Likely homosexual households (counted as self-reported same-sex unmarried-partner households)
Lesbian couples: 0.4% of all households
Gay men: 0.0% of all households
Household received Food Stamps/SNAP in the past 12 months: 669 Household did not receive Food Stamps/SNAP in the past 12 months: 11,878
Women who had a birth in the past 12 months: 247 (197 now married, 49 unmarried) Women who did not have a birth in the past 12 months: 6,400 (2,620 now married, 3,776 unmarried)
Housing units in zip code 95662 with a mortgage: 6,272 (510 second mortgage, 12 home equity loan, 472 both second mortgage and home equity loan) Houses without a mortgage: 90
Median monthly owner costs for units with a mortgage: $2,219 Median monthly owner costs for units without a mortgage: $673
Residents with income below the poverty level in 2022:
This zip code:
9.1%
Whole state:
12.2%
Residents with income below 50% of the poverty level in 2022:
This zip code:
3.6%
Whole state:
6.2%
Median number of rooms in houses and condos:
Here:
6.2
State:
6.0
Median number of rooms in apartments:
Here:
4.4
State:
3.9
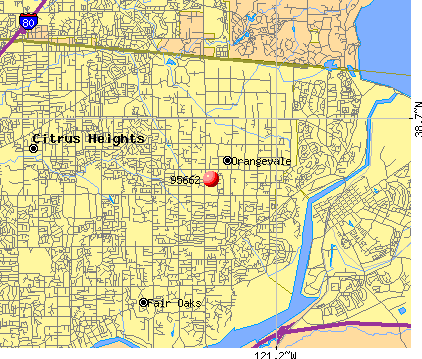
Notable locations in this zip code not listed on our city pages
Notable locations in zip code 95662: Orangevale Community Center (A), Sacramento Metropolitan Fire District Station 33 (B), Sacramento Metropolitan Fire District Station 29 (C), Sacramento Metropolitan Fire District Station 22 (D), Orangevale Neighborhood Library (E). Display/hide their locations on the map
Shopping Centers: Village Shopping Center (1), Orange Tree Plaza Shopping Center (2), Cable Park Shopping Center (3). Display/hide their locations on the map
Churches in zip code 95662 include: Bible Truth Center (A), Church of Chri (B), Church of Christ (C), Church of Hazel Avenue (D), Church of Religious Science (E), Divine Savior Catholic Church (F), Family Christian Center (G), First Baptist Church of Orangevale (H), First United Methodist Church of Orangevale (I). Display/hide their locations on the map
Parks in zip code 95662 include: Almond Park (1), Indian Stone Corral Park (2), Orangevale Community Park (3), Orangevale Park (4), Pecan Park (5), Sundance Park (6), Community Center Park (7), Palisades Park (8), Snipes-Pershing Park (9). Display/hide their locations on the map
3,897 married couples with children.
1,965 single-parent households (692 men, 1,273 women).
88.8% of residents of 95662 zip code speak English at home.
5.1% of residents speak Spanish at home (84% very well, 9% well, 6% not well).
3.8% of residents speak other Indo-European language at home (71% very well, 15% well, 11% not well, 4% not at all).
2.0% of residents speak Asian or Pacific Island language at home (56% very well, 20% well, 24% not well).
0.1% of residents speak other language at home (100% very well).
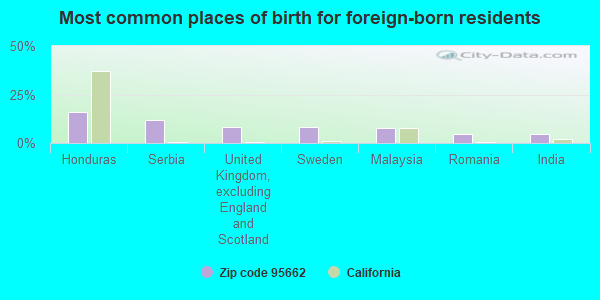
Foreign born population: 2,439 (7.6%) (61.1% of them are naturalized citizens)
This zip code:
7.6%
Whole state:
26.7%
16%Honduras
12%Serbia
8%United Kingdom, excluding England and Scotland
8%Sweden
8%Malaysia
5%Romania
4%India
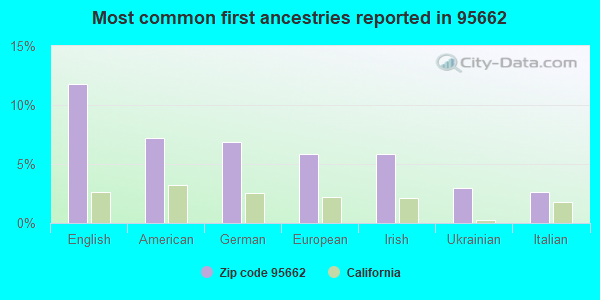
12%English
7%American
7%German
6%European
6%Irish
3%Ukrainian
3%Italian
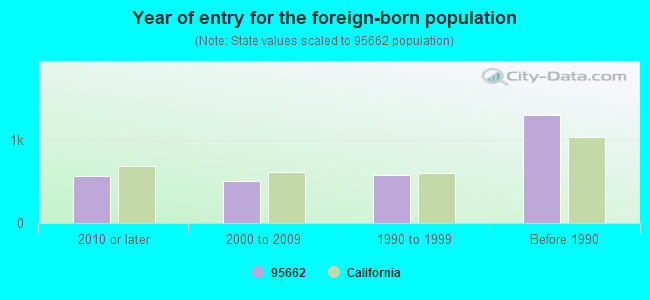
Year of entry for the foreign-born population
5652010 or later
5022000 to 2009
5811990 to 1999
1,302Before 1990
Facilities with environmental interests located in this zip code:
JIFFY LUBE #385 (9286 GREENBACK LN in ORANGEVALE, CA)
STATE MASTER (California - Hazardous Waste Tracking) - HAZARDOU WASTE PROGRAM Small Quantity Generators, between 100 kg and 1000 kg of hazardous waste/month (Resource Conservation and Recovery Act (tracking hazardous waste)) - notification USED OIL PROGRAM (Resource Conservation and Recovery Act (tracking hazardous waste)) STATE MASTER (California - Used Oil Recycling System ) - USED OIL RECYCLING, USED OIL PROGRAM Business NAICS classification: ALL OTHER AUTOMOTIVE REPAIR AND MAINTENANCE. Organizations: PENNZOIL CO (CONTACT/OWNER)
Alternative names: JIFFY LUBE INTERNATIONAL 385
ANDREW CARNEGIE MIDDLE SCHOOL (5820 ILLINOIS AVE in ORANGEVALE, CA)
(Geographic Names Information System) (National Center for Education Statistics) - STATE ID-6034409 Organizations: SAN JUAN UNIFIED (SCHOOL DISTRICT)
Alternative names: CARNEGIE (ANDREW) MIDDLE
GOLDEN STATE COLLISION CTRS INC (9439 GREENBACK LN in ORANGEVALE, CA)
STATE MASTER (California - Hazardous Waste Tracking) - HAZARDOU WASTE PROGRAM Small Quantity Generators, between 100 kg and 1000 kg of hazardous waste/month (Resource Conservation and Recovery Act (tracking hazardous waste)) - notification Organizations: FINKELSTEIN GOLDEN STATE AUTO BODY ANDPN (CONTACT/OWNER)
LA VISTA CENTER (5834 ALMOND AVE. in ORANGEVALE, CA)
(Geographic Names Information System) (National Center for Education Statistics) - STATE ID-3430394 Organizations: SAN JUAN UNIFIED (SCHOOL DISTRICT)
LONGS DRUG STORE NO 487 (8861 GREENBACK LN in ORANGEVALE, CA)
STATE MASTER (California - Hazardous Waste Tracking) - HAZARDOU WASTE PROGRAM Small Quantity Generators, between 100 kg and 1000 kg of hazardous waste/month (Resource Conservation and Recovery Act (tracking hazardous waste)) - notification Organizations: LONGS DRUG STORES CAL (CONTACT/OWNER)
Alternative names: LONGS DRUG STORE #487
GREEN OAKS FUNDAMENTAL (ELEM.) (7145 FILBERT AVE. in ORANGEVALE, CA)
(National Center for Education Statistics) - STATE ID-6034581 Organizations: SAN JUAN UNIFIED (SCHOOL DISTRICT)
CASA ROBLE FUNDAMENTAL HIGH (9151 OAK AVE. in ORANGEVALE, CA)
(National Center for Education Statistics) - STATE ID-3431111 Organizations: SAN JUAN UNIFIED (SCHOOL DISTRICT)
EATON ENVIRONMENTAL (9421 ORANGEVALE AVE STE 3 in ORANGEVALE, CA)
TRANSPORTER (Resource Conservation and Recovery Act (tracking hazardous waste)) - notification Organizations: GLENN K EATON (CONTACT/OWNER)
GERMAN AUTO (9421 ORANGEVALE AVE in ORANGEVALE, CA)
Small Quantity Generators, between 100 kg and 1000 kg of hazardous waste/month (Resource Conservation and Recovery Act (tracking hazardous waste)) - notification Organizations: JON MACNEIL (CONTACT/OWNER)
LOUIS W ALVES (9198 GREENBACK LN ST 202 in ORANGEVALE, CA)
COMPLIANCE ACTIVITY (Tracking inspections of insecticide, fungicide, and rodenticide, and toxic substances)
FRICOT CITY / CALIFORNIA CONSERVATION CORP (FRICOT CITY ROAD in ORANGEVALE, CA)
CRITERIA AND HAZARDOUS AIR POLLUTANT INVENTORY (Inventory of air pollution sources) Business SIC classification: REFUSE SYSTEMS Business NAICS classification: SOLID WASTE LANDFILL.
KAPLAN FOUNDATION (7150 SANTA JUANITA AVE in ORANGEVALE, CA)
COMPLIANCE ACTIVITY (Tracking inspections of insecticide, fungicide, and rodenticide, and toxic substances)
Housing units lacking complete plumbing facilities: 0.2% Housing units lacking complete kitchen facilities: 2.0%
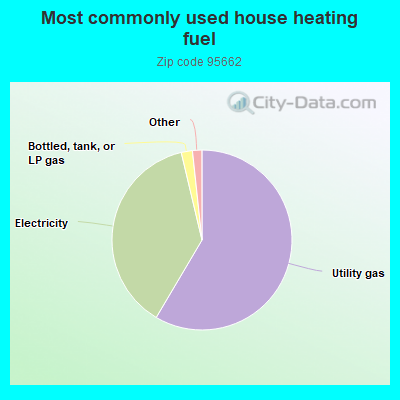
58.5%Utility gas
37.8%Electricity
2.0%Bottled, tank, or LP gas
0.8%Solar energy
0.7%Wood
Population in 1990: 31,361. Population change in the 1990s: +674 (+2.1%).
Place of birth for U.S.-born residents:
This state: 23,212
Northeast: 903
Midwest: 1,937
South: 1,099
West: 1,938
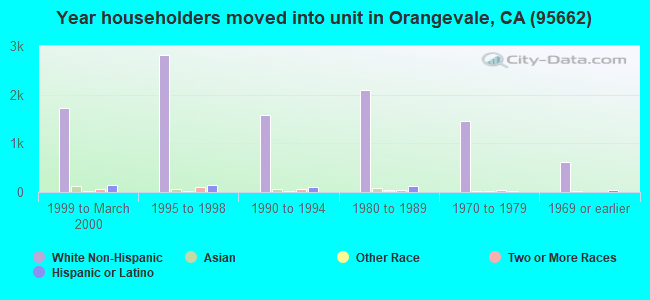
55% of the 95662 zip code residents lived in the same house 5 years ago. Out of people who lived in different houses, 66% lived in this county. Out of people who lived in different counties, 50% lived in California.
89% of the 95662 zip code residents lived in the same house 1 year ago. Out of people who lived in different houses, 57% moved from this county. Out of people who lived in different houses, 32% moved from different county within same state. Out of people who lived in different houses, 6% moved from different state. Out of people who lived in different houses, 3% moved from abroad.
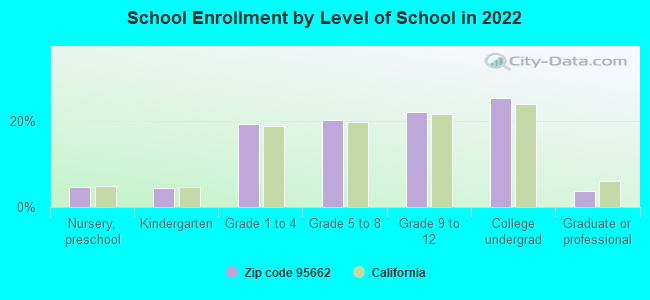
Private vs. public school enrollment:
Students in private schools in grades 1 to 8 (elementary and middle school): 308
Here:
10.5%
California:
10.5%
Students in private schools in grades 9 to 12 (high school): 168
Here:
10.2%
California:
8.5%
Students in private undergraduate colleges: 124
Here:
6.6%
California:
15.9%
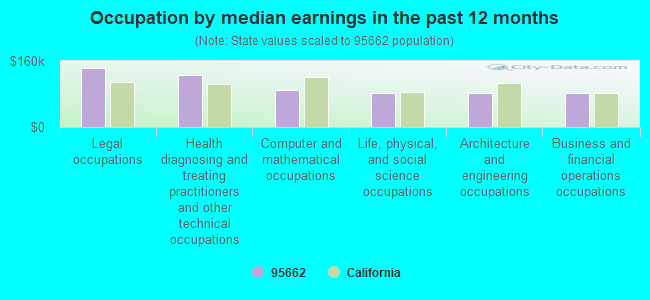
Occupation by median earnings in the past 12 months ($)
142,766Legal occupations
125,506Health diagnosing and treating practitioners and other technical occupations
89,672Computer and mathematical occupations
82,931Life, physical, and social science occupations
82,489Architecture and engineering occupations
81,920Business and financial operations occupations
Companies with federal contracts located in this zip code (ORANGEVALE, CA):
CALIFORNIA FAMILY HEALTH INC (8680 GREENBACK LN STE 220) : $115,450 in 26 contractsfrom 2003 to 2006
Contracts for Other Housekeeping Services by U.S. Army Corps of Engineers - civil program financing only, Army Signed by year:2000: $0; 2001: $0; 2002: $0; 2003: $46,500; 2004: $47,650; 2005: $20,750; 2006: $550.
Biggest contracts:
$23,400 with U.S. Army Corps of Engineers - civil program financing only for Other Housekeeping Services. Signed on 2004-11-23. Completion date: 2005-10-31.
$23,400 with Army for Other Housekeeping Services. Signed on 2004-11-23. Completion date: 2005-10-31.
$22,950, same as above.Signed on 2003-11-04. Completion date: 2004-10-31.
$22,950 with U.S. Army Corps of Engineers - civil program financing only for Other Housekeeping Services. Signed on 2003-11-04. Completion date: 2004-10-31.
COMPUTER DEDUCTION INC (8680 GREENBACK LN STE 210; small business) : $59,981 in 7 contractsfrom 2004 to 2005
Contracts for Miscellaneous Items, Safety and Rescue Equipment, Non-Food Items For Resale by Navy Signed by year:2000: $0; 2001: $0; 2002: $0; 2003: $0; 2004: $39,898; 2005: $20,083; 2006: $0.
Biggest contracts:
$28,311 with Navy for Miscellaneous Items. Signed on 2004-09-22. Completion date: 2004-10-01.
$7,316, same as above.Signed on 2004-10-28. Completion date: 2004-11-19.
$7,305, same as above.Signed on 2005-03-31. Completion date: 2005-04-22.
$6,078 with Navy for Safety and Rescue Equipment. Signed on 2005-07-29. Completion date: 2005-08-05.
DA VINCI TOOLS INC (8212 FIREWOOD CT; small business) : $33,005 in 3 contractsin 2004
$30,000 with Navy for Vocational/Technical. Signed on 2004-03-18. Completion date: 2004-03-19.
$2,000, same as above.Signed on 2004-07-28. Completion date: 2004-03-19.
$1,005 with Navy for Communication Training Devices. Signed on 2004-08-19. Completion date: 2004-08-24.
MALLORY, RICHARD E (9184 SHAWMUTT COURT; small business) : $15,810 in 2 contractsin 2003
$15,180 with Army for Other Professional Services. Taking place in AK. Signed on 2003-01-13. Completion date: 2003-03-14.
$630, same as above.Signed on 2003-01-22. Completion date: 2003-03-14.
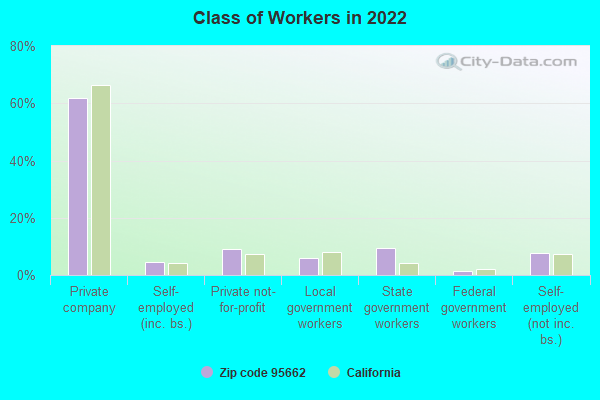
Top industries in this zip code by the number of employees in 2005:
Administrative and Support and Waste Management and Remediation Services: Professional Employer Organizations (250-499 employees: 1 establishment, 1-4 employees: 1 establishment)
Construction: New Single-Family Housing Construction (except Operative Builders) (100-249: 1, 50-99: 1, 10-19: 3, 5-9: 5, 1-4: 13)
2005 - 2018 National Fire Incident Reporting System (NFIRS) incidents
According to the data from the years 2005 - 2018 the average number of fire incidents per year is 43. The highest number of fire incidents - 60 took place in 2010, and the least - 12 in 2007. The data has a dropping trend.
When looking into fire subcategories, the most incidents belonged to: Outside Fires (53.6%), and Structure Fires (26.7%).
Fire incident types reported to NFIRS in Zip Code 95662


 Nearest zip codes: 95628, 95610, 95661, 95746, 95630, 95621.


 According to the data from the years 2005 - 2018 the average number of fire incidents per year is 43. The highest number of fire incidents - 60 took place in 2010, and the least - 12 in 2007. The data has a dropping trend.
 When looking into fire subcategories, the most incidents belonged to: Outside Fires (53.6%), and Structure Fires (26.7%).