Estimated zip code population in 2022: 45,835 Zip code population in 2010: 44,147 Zip code population in 2000: 43,716
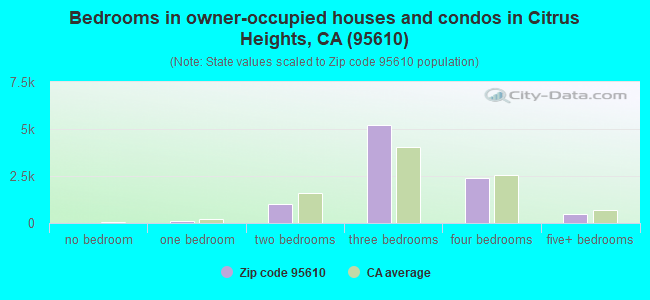
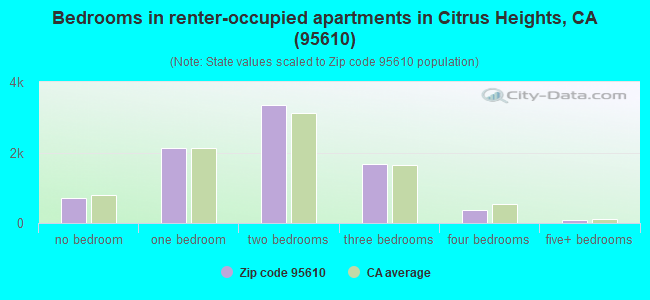
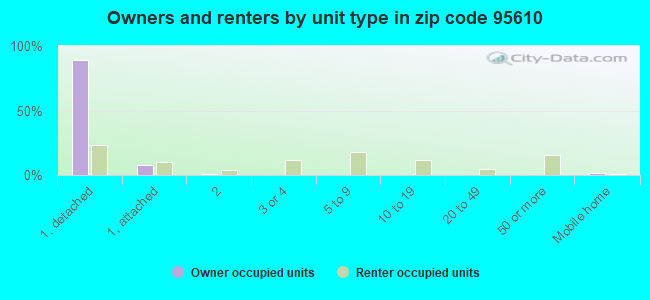
Houses and condos: 18,176 Renter-occupied apartments: 8,330
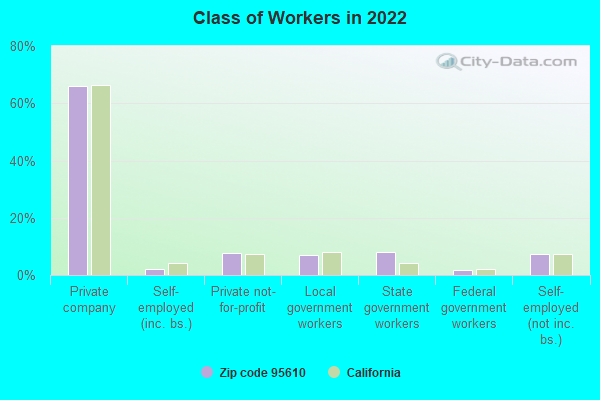
% of renters here:
48%
State:
44%
March 2022 cost of living index in zip code 95610: 102.2 (near average, U.S. average is 100)
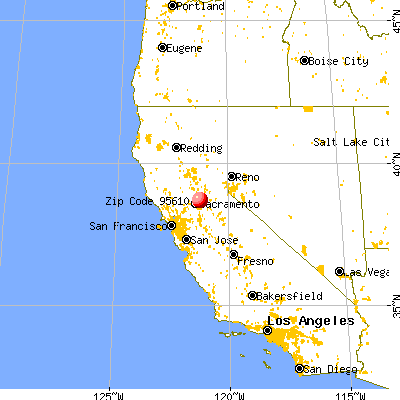
Land area: 7.8 sq. mi. Water area: 0.0 sq. mi.
Population density: 5,854 people per square mile
(average).
OSM Map
General Map
Google Map
MSN Map
OSM Map
General Map
Google Map
MSN Map
OSM Map
General Map
Google Map
MSN Map
OSM Map
General Map
Google Map
MSN Map
Please wait while loading the map...
Real estate property taxes paid for housing units in 2022:
This zip code:
0.7% ($3,177)
California:
0.7% ($4,831)
Median real estate property taxes paid for housing units with mortgages in 2022: $3,458 (0.7%) Median real estate property taxes paid for housing units with no mortgage in 2022: $2,748 (0.6%)
Averages for the 2020 tax year for zip code 95610, filed in 2021:
Average Adjusted Gross Income (AGI) in 2020: $56,856 (Individual Income Tax Returns)
Here:
$56,856
State:
$95,910
Salary/wage: $51,493 (reported on 80.2% of returns)
Here:
$51,493
State:
$77,331
(% of AGI for various income ranges: 1215.1% for AGIs below $25k, 3811.1% for AGIs $25k-50k, 7002.9% for AGIs $50k-75k, 9959.4% for AGIs $75k-100k, 19123.6% for AGIs $100k-200k, 62936.9% for AGIs over 200k)
Taxable interest for individuals: $525 (reported on 33.3% of returns)
This zip code:
$525
California:
$2,294
(% of AGI for various income ranges: 13.1% for AGIs below $25k, 15.0% for AGIs $25k-50k, 21.3% for AGIs $50k-75k, 50.8% for AGIs $75k-100k, 62.4% for AGIs $100k-200k, 310.0% for AGIs over 200k)
Ordinary dividends: $2,902 (reported on 12.8% of returns)
Here:
$2,902
State:
$10,949
(% of AGI for various income ranges: 16.8% for AGIs below $25k, 23.7% for AGIs $25k-50k, 54.0% for AGIs $50k-75k, 95.6% for AGIs $75k-100k, 158.2% for AGIs $100k-200k, 987.7% for AGIs over 200k)
Net capital gain/loss in AGI: +$7,721 (reported on 12.4% of returns)
Here:
+$7,721
State:
+$49,306
(% of AGI for various income ranges: 6.9% for AGIs below $25k, 15.3% for AGIs $25k-50k, 50.0% for AGIs $50k-75k, 106.8% for AGIs $75k-100k, 336.3% for AGIs $100k-200k, 9536.9% for AGIs over 200k)
Profit/loss from business: +$11,622 (reported on 15.8% of returns)
Here:
+$11,622
State:
+$15,671
(% of AGI for various income ranges: 144.5% for AGIs below $25k, 208.5% for AGIs $25k-50k, 289.6% for AGIs $50k-75k, 341.2% for AGIs $75k-100k, 531.5% for AGIs $100k-200k, 3696.2% for AGIs over 200k)
Taxable individual retirement arrangement distribution: $15,787 (reported on 6.9% of returns)
95610:
$15,787
California:
$23,505
(% of AGI for various income ranges: 47.9% for AGIs below $25k, 78.8% for AGIs $25k-50k, 157.8% for AGIs $50k-75k, 267.2% for AGIs $75k-100k, 519.6% for AGIs $100k-200k, 2010.8% for AGIs over 200k)
Self-employed (Keogh) retirement plans: $13,657 (reported on 0.3% of returns)
95610:
$13,657
California:
$30,163
(% of AGI for various income ranges: 11.3% for AGIs $50k-75k, 43.3% for AGIs $100k-200k)
Total itemized deductions: $26,744 (reported on 10.1% of returns)
Here:
$26,744
State:
$39,517
(% of AGI for various income ranges: 61.0% for AGIs below $25k, 129.2% for AGIs $25k-50k, 400.1% for AGIs $50k-75k, 760.1% for AGIs $75k-100k, 1414.2% for AGIs $100k-200k, 6710.8% for AGIs over 200k)
Charity contributions: $5,528 (reported on 7.8% of returns)
Here:
$5,528
State:
$12,598
(% of AGI for various income ranges: 3.5% for AGIs below $25k, 15.5% for AGIs $25k-50k, 47.2% for AGIs $50k-75k, 97.5% for AGIs $75k-100k, 255.0% for AGIs $100k-200k, 1716.9% for AGIs over 200k)
Taxes paid: $7,600 (reported on 10.1% of returns)
95610:
$7,600
State:
$8,807
(% of AGI for various income ranges: 10.6% for AGIs below $25k, 27.9% for AGIs $25k-50k, 110.4% for AGIs $50k-75k, 247.9% for AGIs $75k-100k, 465.5% for AGIs $100k-200k, 1396.9% for AGIs over 200k)
Earned income credit: $2,027 (reported on 13.9% of returns)
Here:
$2,027
State:
$2,074
(% of AGI for various income ranges: 78.9% for AGIs below $25k, 58.5% for AGIs $25k-50k, 1.1% for AGIs $50k-75k)
Percentage of individuals using paid preparers for their 2020 taxes: 93.4%
Here:
93%
State:
92%
(% for various income ranges: 92.5% for AGIs below $25k, 94.1% for AGIs $25k-50k, 94.3% for AGIs $50k-75k, 93.5% for AGIs $75k-100k, 92.7% for AGIs $100k-200k, 93.3% for AGIs over 200k)
Averages for the 2012 tax year for zip code 95610, filed in 2013:
Average Adjusted Gross Income (AGI) in 2012: $44,425 (Individual Income Tax Returns)
Here:
$44,425
State:
$72,726
Salary/wage: $40,381 (reported on 81.7% of returns)
Here:
$40,381
State:
$59,079
(% of AGI for various income ranges: 72.5% for AGIs below $25k, 77.8% for AGIs $25k-50k, 74.7% for AGIs $50k-75k, 73.8% for AGIs $75k-100k, 75.3% for AGIs $100k-200k, 55.3% for AGIs over 200k)
Taxable interest for individuals: $622 (reported on 33.8% of returns)
This zip code:
$622
California:
$2,146
(% of AGI for various income ranges: 0.7% for AGIs below $25k, 0.5% for AGIs $25k-50k, 0.5% for AGIs $50k-75k, 0.4% for AGIs $75k-100k, 0.3% for AGIs $100k-200k, 0.8% for AGIs over 200k)
Ordinary dividends: $2,338 (reported on 13.3% of returns)
Here:
$2,338
State:
$9,308
(% of AGI for various income ranges: 0.8% for AGIs below $25k, 0.5% for AGIs $25k-50k, 0.7% for AGIs $50k-75k, 0.7% for AGIs $75k-100k, 0.7% for AGIs $100k-200k, 1.6% for AGIs over 200k)
Net capital gain/loss in AGI: +$1,843 (reported on 10.6% of returns)
Here:
+$1,843
State:
+$30,460
(% of AGI for various income ranges: 0.1% for AGIs $50k-75k, 0.2% for AGIs $75k-100k, 0.8% for AGIs $100k-200k, 5.2% for AGIs over 200k)
Profit/loss from business: +$11,472 (reported on 15.1% of returns)
Here:
+$11,472
State:
+$17,064
(% of AGI for various income ranges: 9.6% for AGIs below $25k, 4.7% for AGIs $25k-50k, 3.0% for AGIs $50k-75k, 1.7% for AGIs $75k-100k, 2.2% for AGIs $100k-200k, 6.2% for AGIs over 200k)
Taxable individual retirement arrangement distribution: $12,702 (reported on 8.1% of returns)
95610:
$12,702
California:
$19,557
(% of AGI for various income ranges: 2.1% for AGIs below $25k, 1.7% for AGIs $25k-50k, 2.2% for AGIs $50k-75k, 2.6% for AGIs $75k-100k, 3.4% for AGIs $100k-200k)
Self-employment retirement plans: $11,371 (reported on 0.4% of returns)
95610:
$11,371
California:
$24,530
Total itemized deductions: $19,961 (26% of AGI, reported on 30.0% of returns)
Here:
$19,961
State:
$34,004
Here:
25.7% of AGI
State:
22.7% of AGI
(% of AGI for various income ranges: 9.2% for AGIs below $25k, 9.9% for AGIs $25k-50k, 13.8% for AGIs $50k-75k, 15.5% for AGIs $75k-100k, 16.6% for AGIs $100k-200k, 16.3% for AGIs over 200k)
Charity contributions: $2,693 (reported on 24.6% of returns)
Here:
$2,693
State:
$4,659
(% of AGI for various income ranges: 0.7% for AGIs below $25k, 1.0% for AGIs $25k-50k, 1.7% for AGIs $50k-75k, 1.9% for AGIs $75k-100k, 2.0% for AGIs $100k-200k, 1.5% for AGIs over 200k)
Taxes paid: $5,949 (reported on 29.8% of returns)
95610:
$5,949
State:
$14,448
(% of AGI for various income ranges: 1.4% for AGIs below $25k, 2.0% for AGIs $25k-50k, 3.6% for AGIs $50k-75k, 4.7% for AGIs $75k-100k, 6.2% for AGIs $100k-200k, 7.6% for AGIs over 200k)
Earned income credit: $2,117 (reported on 18.9% of returns)
Here:
$2,117
State:
$2,286
(% of AGI for various income ranges: 5.7% for AGIs below $25k, 1.0% for AGIs $25k-50k)
Percentage of individuals using paid preparers for their 2012 taxes: 51.4%
Here:
51%
State:
64%
(% for various income ranges: 49.3% for AGIs below $25k, 51.0% for AGIs $25k-50k, 52.6% for AGIs $50k-75k, 53.8% for AGIs $75k-100k, 57.1% for AGIs $100k-200k, 69.2% for AGIs over 200k)
Averages for the 2004 tax year for zip code 95610, filed in 2005:
Average Adjusted Gross Income (AGI) in 2004: $41,487 (Individual Income Tax Returns)
Here:
$41,487
State:
$58,600
Salary/wage: $38,475 (reported on 84.8% of returns)
Here:
$38,475
State:
$49,455
(% of AGI for various income ranges: 96.3% for AGIs below $10k, 75.7% for AGIs $10k-25k, 81.6% for AGIs $25k-50k, 79.9% for AGIs $50k-75k, 83.1% for AGIs $75k-100k, 70.4% for AGIs over 100k)
Taxable interest for individuals: $820 (reported on 44.0% of returns)
This zip code:
$820
California:
$2,365
(% of AGI for various income ranges: 3.5% for AGIs below $10k, 1.4% for AGIs $10k-25k, 0.8% for AGIs $25k-50k, 0.7% for AGIs $50k-75k, 0.7% for AGIs $75k-100k, 0.9% for AGIs over 100k)
Taxable dividends: $1,453 (reported on 18.3% of returns)
Here:
$1,453
State:
$4,746
(% of AGI for various income ranges: 3.0% for AGIs below $10k, 0.8% for AGIs $10k-25k, 0.5% for AGIs $25k-50k, 0.7% for AGIs $50k-75k, 0.4% for AGIs $75k-100k, 0.6% for AGIs over 100k)
Net capital gain/loss: +$6,620 (reported on 14.0% of returns)
Here:
+$6,620
State:
+$23,418
(% of AGI for various income ranges: -1.8% for AGIs below $10k, -0.4% for AGIs $10k-25k, 0.2% for AGIs $25k-50k, 0.6% for AGIs $50k-75k, 0.7% for AGIs $75k-100k, 9.3% for AGIs over 100k)
Profit/loss from business: +$12,307 (reported on 14.9% of returns)
Here:
+$12,307
State:
+$16,826
(% of AGI for various income ranges: 7.8% for AGIs below $10k, 6.8% for AGIs $10k-25k, 4.0% for AGIs $25k-50k, 3.2% for AGIs $50k-75k, 3.1% for AGIs $75k-100k, 5.9% for AGIs over 100k)
IRA payment deduction: $2,907 (reported on 2.3% of returns)
95610:
$2,907
California:
$3,192
(% of AGI for various income ranges: 0.2% for AGIs $10k-25k, 0.2% for AGIs $25k-50k, 0.2% for AGIs $50k-75k, 0.2% for AGIs $75k-100k, 0.1% for AGIs over 100k)
Self-employed pension: $11,035 (reported on 0.8% of returns)
Here:
$11,035
California:
$17,688
(% of AGI for various income ranges: 0.1% for AGIs $25k-50k, 0.1% for AGIs $50k-75k, 0.2% for AGIs $75k-100k, 0.5% for AGIs over 100k)
Total itemized deductions: $19,188 (28% of AGI, reported on 37.2% of returns)
Here:
$19,188
State:
$28,113
Here:
28.0% of AGI
State:
25.3% of AGI
(% of AGI for various income ranges: 15.9% for AGIs below $10k, 10.5% for AGIs $10k-25k, 14.2% for AGIs $25k-50k, 20.0% for AGIs $50k-75k, 21.0% for AGIs $75k-100k, 17.9% for AGIs over 100k)
Charity contributions deductions: $2,452 (3% of AGI, reported on 32.6% of returns)
Here:
$2,452
State:
$3,923
Here:
3.5% of AGI
State:
3.3% of AGI
(% of AGI for various income ranges: 0.7% for AGIs below $10k, 0.9% for AGIs $10k-25k, 1.5% for AGIs $25k-50k, 2.2% for AGIs $50k-75k, 2.4% for AGIs $75k-100k, 2.3% for AGIs over 100k)
Total tax: $4,970 (reported on 79.0% of returns)
95610:
$4,970
State:
$10,761
(% of AGI for various income ranges: 3.1% for AGIs below $10k, 4.7% for AGIs $10k-25k, 7.3% for AGIs $25k-50k, 8.9% for AGIs $50k-75k, 10.0% for AGIs $75k-100k, 14.9% for AGIs over 100k)
Earned income credit: $1,605 (reported on 13.1% of returns)
Here:
$1,605
State:
$1,763
Percentage of individuals using paid preparers for their 2004 taxes: 54.4%
Here:
54%
State:
66%
(% for various income ranges: 46.0% for AGIs below $10k, 53.5% for AGIs $10k-25k, 54.0% for AGIs $25k-50k, 58.5% for AGIs $50k-75k, 59.4% for AGIs $75k-100k, 63.9% for AGIs over 100k)
Likely homosexual households (counted as self-reported same-sex unmarried-partner households)
Lesbian couples: 0.4% of all households
Gay men: 0.1% of all households
Household received Food Stamps/SNAP in the past 12 months: 2,704 Household did not receive Food Stamps/SNAP in the past 12 months: 14,922
Women who had a birth in the past 12 months: 585 (417 now married, 168 unmarried) Women who did not have a birth in the past 12 months: 10,282 (4,412 now married, 5,856 unmarried)
Housing units in zip code 95610 with a mortgage: 6,470 (410 second mortgage, 22 home equity loan, 318 both second mortgage and home equity loan) Houses without a mortgage: 14
Median monthly owner costs for units with a mortgage: $2,036 Median monthly owner costs for units without a mortgage: $666
Residents with income below the poverty level in 2022:
This zip code:
10.3%
Whole state:
12.2%
Residents with income below 50% of the poverty level in 2022:
This zip code:
5.5%
Whole state:
6.2%
Median number of rooms in houses and condos:
Here:
6.1
State:
6.0
Median number of rooms in apartments:
Here:
4.0
State:
3.9
Notable locations in this zip code not listed on our city pages
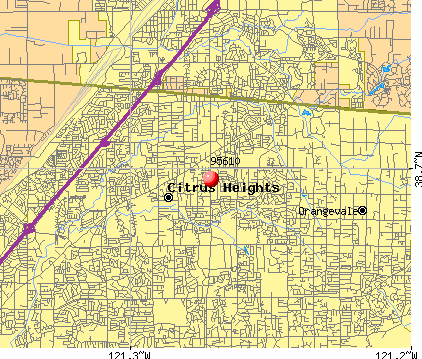
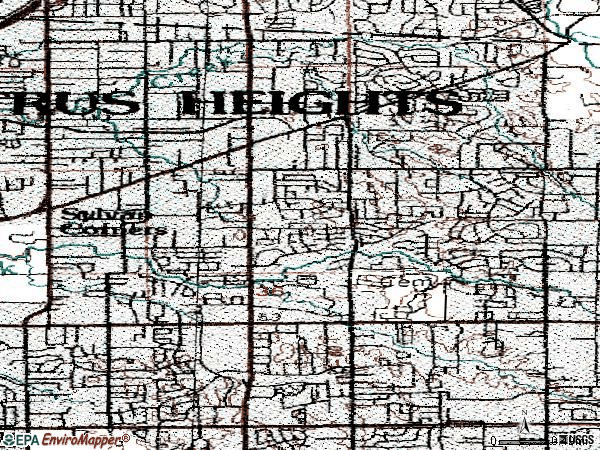
Notable locations in zip code 95610: Sunrise Golf Course (A), Sylvan Corners (B), Birdcage Center (C), Sacramento Metropolitan Fire District Station 28 (D), Sacramento Metropolitan Fire District Station 21 (E). Display/hide their locations on the map
Shopping Centers: Sunrise Village Shopping Center (1), Sunrise Festival Shopping Center (2), Sunrise Mall (3), Madison-Sunrise Shopping Center (4), Cascade Plaza Shopping Center (5), Woodmore Oaks Shopping Center (6), Sunrise Plaza Shopping Center (7), Copperwood Square Shopping Center (8), Ancil Hoffman Shopping Center (9). Display/hide their locations on the map
Churches in zip code 95610 include: Sunrise Unity Church (A), Church of Christ (B), Citrus Heights United Methodist Church (C), Sun Oak Baptist Church (D). Display/hide their locations on the map
Parks in zip code 95610 include: San Juan Park (1), C-Bar-C Park (2), McDonald Field (3), Sunrise Oaks Park (4), Northwoods Park (5), Tempo Park (6), Madera Park (7). Display/hide their locations on the map
6,053 married couples with children.
1,799 single-parent households (520 men, 1,279 women).
79.0% of residents of 95610 zip code speak English at home.
9.2% of residents speak Spanish at home (62% very well, 20% well, 14% not well, 3% not at all).
9.2% of residents speak other Indo-European language at home (47% very well, 25% well, 21% not well, 7% not at all).
2.1% of residents speak Asian or Pacific Island language at home (38% very well, 37% well, 22% not well, 2% not at all).
0.3% of residents speak other language at home (39% very well, 37% well, 18% not well, 6% not at all).
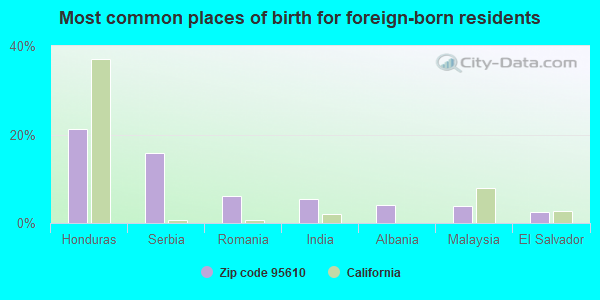
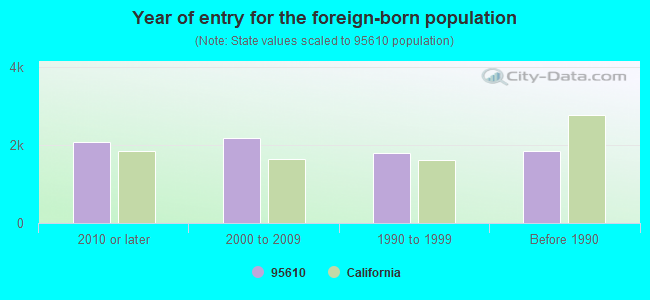
Foreign born population: 7,036 (15.4%) (56.4% of them are naturalized citizens)
Major facilities with environmental interests located in this zip code:
MIRACLE AUTO PAINTING (5933 AUBURN BLVD in CITRUS HEIGHTS, CA)
STATE MASTER (California - Hazardous Waste Tracking) - HAZARDOU WASTE PROGRAM CRITERIA AND HAZARDOUS AIR POLLUTANT INVENTORY (Inventory of air pollution sources) Small Quantity Generators, between 100 kg and 1000 kg of hazardous waste/month (Resource Conservation and Recovery Act (tracking hazardous waste)) - notification Business SIC classification: TOP, BODY, AND UPHOLSTERY REPAIR SHOPS AND PAINT SHOPS Business NAICS classification: GENERAL AUTOMOTIVE REPAIR. Organizations: BONINE ENTERPRISES (CONTACT/OWNER)
Alternative names: BONINE ENT DBA MIRACLE AUTO PAINTING
EQUILON ENTERPRISES (7349 MADISON AVE in CITRUS HEIGHTS, CA) . Federal Facility
STATE MASTER (California - Hazardous Waste Tracking) - HAZARDOU WASTE PROGRAM Small Quantity Generators, between 100 kg and 1000 kg of hazardous waste/month (Resource Conservation and Recovery Act (tracking hazardous waste)) - notification Organizations: EQUILON ENTERPRISES, LLC (CONTACT/OWNER)
Alternative names: SHELL OIL CO
KNIESELS AUTO BODY (7633 SUNRISE BLVD in CITRUS HEIGHTS, CA)
STATE MASTER (California - Hazardous Waste Tracking) - HAZARDOU WASTE PROGRAM Small Quantity Generators, between 100 kg and 1000 kg of hazardous waste/month (Resource Conservation and Recovery Act (tracking hazardous waste))
CHEVRON STATION 91812 (7551 SUNRISE BLVD in CITRUS HEIGHTS, CA)
STATE MASTER (California - Hazardous Waste Tracking) - HAZARDOU WASTE PROGRAM Small Quantity Generators, between 100 kg and 1000 kg of hazardous waste/month (Resource Conservation and Recovery Act (tracking hazardous waste)) - notification Organizations: CHEVRON PRODUCTS CO (CONTACT/OWNER)
CHEVRON STATION 92174 (7700 AUBURN BLVD in CITRUS HEIGHTS, CA)
STATE MASTER (California - Hazardous Waste Tracking) - HAZARDOU WASTE PROGRAM Small Quantity Generators, between 100 kg and 1000 kg of hazardous waste/month (Resource Conservation and Recovery Act (tracking hazardous waste)) - notification Organizations: CHEVRON PRODUCTS CO (CONTACT/OWNER)
GOLDEN VALLEY CHARTER (7833 HIGHLAND AVE. in CITRUS HEIGHTS, CA)
(National Center for Education Statistics) - STATE ID-6117311 Organizations: TWIN RIDGES ELEMENTARY (SCHOOL DISTRICT)
KINGSWOOD ELEMENTARY (5700 PRIMROSE DR. in CITRUS HEIGHTS, CA)
(National Center for Education Statistics) - STATE ID-6034656 Organizations: SAN JUAN UNIFIED (SCHOOL DISTRICT)
MARIPOSA AVENUE ELEMENTARY (7940 MARIPOSA AVE. in CITRUS HEIGHTS, CA)
(National Center for Education Statistics) - STATE ID-6034714 Organizations: SAN JUAN UNIFIED (SCHOOL DISTRICT)
MINIT LUBE 1589 (7548 GREENBACK LN in CITRUS HEIGHTS, CA)
(Resource Conservation and Recovery Act (tracking hazardous waste)) Organizations: QUAKER STATE MINIT LUBE INC (CONTACT/OWNER)
GRAND OAKS SUNSHINE CLEANERS (8104 AUBURN BLVD in CITRUS HEIGHTS, CA)
CRITERIA AND HAZARDOUS AIR POLLUTANT INVENTORY (Inventory of air pollution sources) Small Quantity Generators, between 100 kg and 1000 kg of hazardous waste/month (Resource Conservation and Recovery Act (tracking hazardous waste)) - notification Business SIC classification: DRYCLEANING PLANTS, EXCEPT RUG CLEANING Organizations: SOONI BURNS (CONTACT/OWNER)
Alternative names: GRAND OAKS SUNSHINE CNTR
IRENES FOOTHILL CLEANERS (7036 SYLVAN RD in CITRUS HEIGHTS, CA)
CRITERIA AND HAZARDOUS AIR POLLUTANT INVENTORY (Inventory of air pollution sources) Small Quantity Generators, between 100 kg and 1000 kg of hazardous waste/month (Resource Conservation and Recovery Act (tracking hazardous waste)) Business SIC classification: DRYCLEANING PLANTS, EXCEPT RUG CLEANING Organizations: BILL DECATUR (CONTACT/OWNER)
CHRIS LIN & COMPANY (8033 GREENBACK LANE in CITRUS HEIGHTS, CA)
CRITERIA AND HAZARDOUS AIR POLLUTANT INVENTORY (Inventory of air pollution sources) Small Quantity Generators, between 100 kg and 1000 kg of hazardous waste/month (Resource Conservation and Recovery Act (tracking hazardous waste)) - notification Business SIC classification: DRYCLEANING PLANTS, EXCEPT RUG CLEANING Organizations: INTER CAL REAL ESTATE CORP (CONTACT/OWNER)
Alternative names: SUPERIOR CLEANERS
KARL KULLMANN VW RENGIR (7441 AUBURN BLVD in CITRUS HEIGHTS, CA)
Small Quantity Generators, between 100 kg and 1000 kg of hazardous waste/month (Resource Conservation and Recovery Act (tracking hazardous waste)) - notification
Housing units lacking complete plumbing facilities: 1.0% Housing units lacking complete kitchen facilities: 1.6%
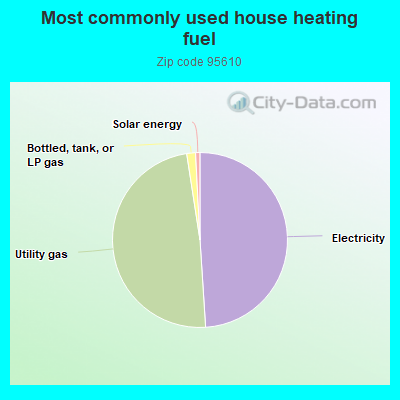
48.5%Electricity
48.1%Utility gas
1.6%Bottled, tank, or LP gas
0.8%Solar energy
Population in 1990: 41,476. Population change in the 1990s: +2,240 (+5.4%).
Place of birth for U.S.-born residents:
This state: 30,593
Northeast: 1,232
Midwest: 2,277
South: 1,633
West: 2,253
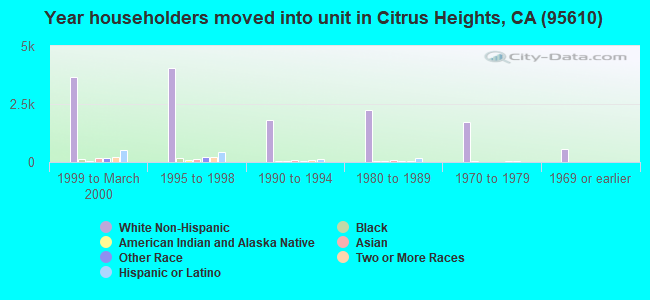
48% of the 95610 zip code residents lived in the same house 5 years ago. Out of people who lived in different houses, 60% lived in this county. Out of people who lived in different counties, 50% lived in California.
88% of the 95610 zip code residents lived in the same house 1 year ago. Out of people who lived in different houses, 57% moved from this county. Out of people who lived in different houses, 32% moved from different county within same state. Out of people who lived in different houses, 4% moved from different state. Out of people who lived in different houses, 5% moved from abroad.
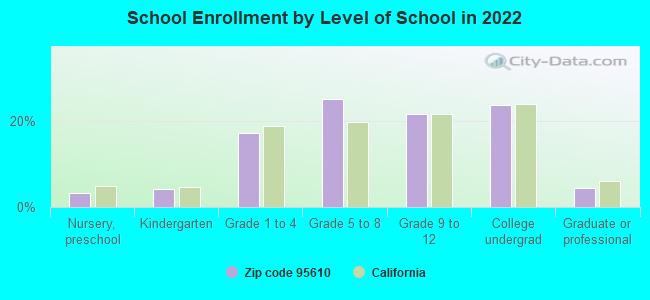
Private vs. public school enrollment:
Students in private schools in grades 1 to 8 (elementary and middle school): 579
Here:
13.7%
California:
10.5%
Students in private schools in grades 9 to 12 (high school): 162
Here:
7.5%
California:
8.5%
Students in private undergraduate colleges: 195
Here:
8.4%
California:
15.9%
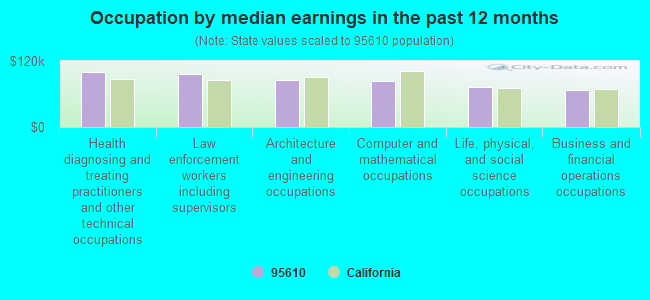
Occupation by median earnings in the past 12 months ($)
99,824Health diagnosing and treating practitioners and other technical occupations
96,152Law enforcement workers including supervisors
85,230Architecture and engineering occupations
83,655Computer and mathematical occupations
72,621Life, physical, and social science occupations
66,617Business and financial operations occupations
Companies with federal contracts located in this zip code (CITRUS HEIGHTS, CA):
CTS (7628 GLEN TREE DRIVE; small business) : $483,190 in 8 contractsfrom 2002 to 2006
Contracts for Other ADP and Telecommunications Services (includes data storage on tapes, compact disks, etc.), Programming Services, Maintenance, Repair and Rebuilding of Equipment -- Miscellaneous by Air Force Signed by year:2000: $0; 2001: $0; 2002: $70,750; 2003: $94,548; 2004: $98,688; 2005: $103,008; 2006: $116,196.
Biggest contracts:
$109,296 with Air Force for Other ADP and Telecommunications Services (includes data storage on tapes, compact disks, etc.). Taking place in UT. Signed on 2006-01-01. Completion date: 2006-01-01.
$98,688, same as above.Signed on 2004-02-18. Completion date: 2007-12-31.
$94,548 with Air Force for Programming Services. Signed on 2003-01-01. Completion date: 2007-12-31.
$77,256 with Air Force for Other ADP and Telecommunications Services (includes data storage on tapes, compact disks, etc.). Taking place in UT. Signed on 2005-03-23. Completion date: 2005-12-31.
J R ROBERTS CORP (7745 GREENBACK LANE, SUITE) : $255,323 in 8 contractsin 2000
Contracts for Construction of Structures and Facilities -- Miscellaneous Buildings by Army Signed by year:2000: $255,323; 2001: $0; 2002: $0; 2003: $0; 2004: $0; 2005: $0; 2006: $0.
Biggest contracts:
$60,478 with Army for Construction of Structures and Facilities -- Miscellaneous Buildings. Signed on 2000-04-25. Completion date: 2000-01-24.
$50,828, same as above.Signed on 2000-06-05. Completion date: 2000-02-07.
$36,659, same as above.Signed on 2000-05-01. Completion date: 2000-01-24.
$28,650, same as above.Signed on 2000-04-12. Completion date: 2000-10-03.
COMPUTERS-BY-CHARLIE, INC (5612 CELINE DR; small business)
$50,000 with Navy for Office Information System Equipment. Signed on 2004-05-21. Completion date: 2004-06-07.
JAMES MCGAUGHY (7762 TWIN OAKS AVE; small business)
$8,970 with Air Force for Maintenance, Repair and Rebuilding of Equipment -- Recreational and Athletic Equipment. Signed on 2006-02-23. Completion date: 2006-10-20.
Top industries in this zip code by the number of employees in 2005:
2005 - 2018 National Fire Incident Reporting System (NFIRS) incidents
According to the data from the years 2005 - 2018 the average number of fires per year is 168. The highest number of fire incidents - 271 took place in 2016, and the least - 39 in 2007. The data has an increasing trend.
When looking into fire subcategories, the most incidents belonged to: Outside Fires (52.6%), and Structure Fires (20.9%).
Fire incident types reported to NFIRS in Zip Code 95610


 Nearest zip codes: 95621, 95628, 95661, 95662, 95678, 95842.


 According to the data from the years 2005 - 2018 the average number of fires per year is 168. The highest number of fire incidents - 271 took place in 2016, and the least - 39 in 2007. The data has an increasing trend.
 When looking into fire subcategories, the most incidents belonged to: Outside Fires (52.6%), and Structure Fires (20.9%).