Citrus Heights, California Submit your own pictures of this city and show them to the world
OSM Map
General Map
Google Map
MSN Map
OSM Map
General Map
Google Map
MSN Map
OSM Map
General Map
Google Map
MSN Map
OSM Map
General Map
Google Map
MSN Map
Please wait while loading the map...
Population in 2022: 86,433 (100% urban, 0% rural). Population change since 2000: +1.6%Males: 43,479 Females: 42,954
March 2022 cost of living index in Citrus Heights: 102.7 (near average, U.S. average is 100) Percentage of residents living in poverty in 2022: 10.5%for White Non-Hispanic residents , 21.7% for Black residents , 13.8% for Hispanic or Latino residents , 30.7% for American Indian residents , 3.0% for Native Hawaiian and other Pacific Islander residents , 14.5% for other race residents , 12.0% for two or more races residents )
Profiles of local businesses
Business Search - 14 Million verified businesses
Data:
Median household income ($)
Median household income (% change since 2000)
Household income diversity
Ratio of average income to average house value (%)
Ratio of average income to average rent
Median household income ($) - White
Median household income ($) - Black or African American
Median household income ($) - Asian
Median household income ($) - Hispanic or Latino
Median household income ($) - American Indian and Alaska Native
Median household income ($) - Multirace
Median household income ($) - Other Race
Median household income for houses/condos with a mortgage ($)
Median household income for apartments without a mortgage ($)
Races - White alone (%)
Races - White alone (% change since 2000)
Races - Black alone (%)
Races - Black alone (% change since 2000)
Races - American Indian alone (%)
Races - American Indian alone (% change since 2000)
Races - Asian alone (%)
Races - Asian alone (% change since 2000)
Races - Hispanic (%)
Races - Hispanic (% change since 2000)
Races - Native Hawaiian and Other Pacific Islander alone (%)
Races - Native Hawaiian and Other Pacific Islander alone (% change since 2000)
Races - Two or more races (%)
Races - Two or more races (% change since 2000)
Races - Other race alone (%)
Races - Other race alone (% change since 2000)
Racial diversity
Unemployment (%)
Unemployment (% change since 2000)
Unemployment (%) - White
Unemployment (%) - Black or African American
Unemployment (%) - Asian
Unemployment (%) - Hispanic or Latino
Unemployment (%) - American Indian and Alaska Native
Unemployment (%) - Multirace
Unemployment (%) - Other Race
Population density (people per square mile)
Population - Males (%)
Population - Females (%)
Population - Males (%) - White
Population - Males (%) - Black or African American
Population - Males (%) - Asian
Population - Males (%) - Hispanic or Latino
Population - Males (%) - American Indian and Alaska Native
Population - Males (%) - Multirace
Population - Males (%) - Other Race
Population - Females (%) - White
Population - Females (%) - Black or African American
Population - Females (%) - Asian
Population - Females (%) - Hispanic or Latino
Population - Females (%) - American Indian and Alaska Native
Population - Females (%) - Multirace
Population - Females (%) - Other Race
Coronavirus confirmed cases (Apr 27, 2024)
Deaths caused by coronavirus (Apr 27, 2024)
Coronavirus confirmed cases (per 100k population) (Apr 27, 2024)
Deaths caused by coronavirus (per 100k population) (Apr 27, 2024)
Daily increase in number of cases (Apr 27, 2024)
Weekly increase in number of cases (Apr 27, 2024)
Cases doubled (in days) (Apr 27, 2024)
Hospitalized patients (Apr 18, 2022)
Negative test results (Apr 18, 2022)
Total test results (Apr 18, 2022)
COVID Vaccine doses distributed (per 100k population) (Sep 19, 2023)
COVID Vaccine doses administered (per 100k population) (Sep 19, 2023)
COVID Vaccine doses distributed (Sep 19, 2023)
COVID Vaccine doses administered (Sep 19, 2023)
Likely homosexual households (%)
Likely homosexual households (% change since 2000)
Likely homosexual households - Lesbian couples (%)
Likely homosexual households - Lesbian couples (% change since 2000)
Likely homosexual households - Gay men (%)
Likely homosexual households - Gay men (% change since 2000)
Cost of living index
Median gross rent ($)
Median contract rent ($)
Median monthly housing costs ($)
Median house or condo value ($)
Median house or condo value ($ change since 2000)
Mean house or condo value by units in structure - 1, detached ($)
Mean house or condo value by units in structure - 1, attached ($)
Mean house or condo value by units in structure - 2 ($)
Mean house or condo value by units in structure by units in structure - 3 or 4 ($)
Mean house or condo value by units in structure - 5 or more ($)
Mean house or condo value by units in structure - Boat, RV, van, etc. ($)
Mean house or condo value by units in structure - Mobile home ($)
Median house or condo value ($) - White
Median house or condo value ($) - Black or African American
Median house or condo value ($) - Asian
Median house or condo value ($) - Hispanic or Latino
Median house or condo value ($) - American Indian and Alaska Native
Median house or condo value ($) - Multirace
Median house or condo value ($) - Other Race
Median resident age
Resident age diversity
Median resident age - Males
Median resident age - Females
Median resident age - White
Median resident age - Black or African American
Median resident age - Asian
Median resident age - Hispanic or Latino
Median resident age - American Indian and Alaska Native
Median resident age - Multirace
Median resident age - Other Race
Median resident age - Males - White
Median resident age - Males - Black or African American
Median resident age - Males - Asian
Median resident age - Males - Hispanic or Latino
Median resident age - Males - American Indian and Alaska Native
Median resident age - Males - Multirace
Median resident age - Males - Other Race
Median resident age - Females - White
Median resident age - Females - Black or African American
Median resident age - Females - Asian
Median resident age - Females - Hispanic or Latino
Median resident age - Females - American Indian and Alaska Native
Median resident age - Females - Multirace
Median resident age - Females - Other Race
Commute - mean travel time to work (minutes)
Travel time to work - Less than 5 minutes (%)
Travel time to work - Less than 5 minutes (% change since 2000)
Travel time to work - 5 to 9 minutes (%)
Travel time to work - 5 to 9 minutes (% change since 2000)
Travel time to work - 10 to 19 minutes (%)
Travel time to work - 10 to 19 minutes (% change since 2000)
Travel time to work - 20 to 29 minutes (%)
Travel time to work - 20 to 29 minutes (% change since 2000)
Travel time to work - 30 to 39 minutes (%)
Travel time to work - 30 to 39 minutes (% change since 2000)
Travel time to work - 40 to 59 minutes (%)
Travel time to work - 40 to 59 minutes (% change since 2000)
Travel time to work - 60 to 89 minutes (%)
Travel time to work - 60 to 89 minutes (% change since 2000)
Travel time to work - 90 or more minutes (%)
Travel time to work - 90 or more minutes (% change since 2000)
Marital status - Never married (%)
Marital status - Now married (%)
Marital status - Separated (%)
Marital status - Widowed (%)
Marital status - Divorced (%)
Median family income ($)
Median family income (% change since 2000)
Median non-family income ($)
Median non-family income (% change since 2000)
Median per capita income ($)
Median per capita income (% change since 2000)
Median family income ($) - White
Median family income ($) - Black or African American
Median family income ($) - Asian
Median family income ($) - Hispanic or Latino
Median family income ($) - American Indian and Alaska Native
Median family income ($) - Multirace
Median family income ($) - Other Race
Median year house/condo built
Median year apartment built
Year house built - Built 2005 or later (%)
Year house built - Built 2000 to 2004 (%)
Year house built - Built 1990 to 1999 (%)
Year house built - Built 1980 to 1989 (%)
Year house built - Built 1970 to 1979 (%)
Year house built - Built 1960 to 1969 (%)
Year house built - Built 1950 to 1959 (%)
Year house built - Built 1940 to 1949 (%)
Year house built - Built 1939 or earlier (%)
Average household size
Household density (households per square mile)
Average household size - White
Average household size - Black or African American
Average household size - Asian
Average household size - Hispanic or Latino
Average household size - American Indian and Alaska Native
Average household size - Multirace
Average household size - Other Race
Occupied housing units (%)
Vacant housing units (%)
Owner occupied housing units (%)
Renter occupied housing units (%)
Vacancy status - For rent (%)
Vacancy status - For sale only (%)
Vacancy status - Rented or sold, not occupied (%)
Vacancy status - For seasonal, recreational, or occasional use (%)
Vacancy status - For migrant workers (%)
Vacancy status - Other vacant (%)
Residents with income below the poverty level (%)
Residents with income below 50% of the poverty level (%)
Children below poverty level (%)
Poor families by family type - Married-couple family (%)
Poor families by family type - Male, no wife present (%)
Poor families by family type - Female, no husband present (%)
Poverty status for native-born residents (%)
Poverty status for foreign-born residents (%)
Poverty among high school graduates not in families (%)
Poverty among people who did not graduate high school not in families (%)
Residents with income below the poverty level (%) - White
Residents with income below the poverty level (%) - Black or African American
Residents with income below the poverty level (%) - Asian
Residents with income below the poverty level (%) - Hispanic or Latino
Residents with income below the poverty level (%) - American Indian and Alaska Native
Residents with income below the poverty level (%) - Multirace
Residents with income below the poverty level (%) - Other Race
Air pollution - Air Quality Index (AQI)
Air pollution - CO
Air pollution - NO2
Air pollution - SO2
Air pollution - Ozone
Air pollution - PM10
Air pollution - PM25
Air pollution - Pb
Crime - Murders per 100,000 population
Crime - Rapes per 100,000 population
Crime - Robberies per 100,000 population
Crime - Assaults per 100,000 population
Crime - Burglaries per 100,000 population
Crime - Thefts per 100,000 population
Crime - Auto thefts per 100,000 population
Crime - Arson per 100,000 population
Crime - City-data.com crime index
Crime - Violent crime index
Crime - Property crime index
Crime - Murders per 100,000 population (5 year average)
Crime - Rapes per 100,000 population (5 year average)
Crime - Robberies per 100,000 population (5 year average)
Crime - Assaults per 100,000 population (5 year average)
Crime - Burglaries per 100,000 population (5 year average)
Crime - Thefts per 100,000 population (5 year average)
Crime - Auto thefts per 100,000 population (5 year average)
Crime - Arson per 100,000 population (5 year average)
Crime - City-data.com crime index (5 year average)
Crime - Violent crime index (5 year average)
Crime - Property crime index (5 year average)
1996 Presidential Elections Results (%) - Democratic Party (Clinton)
1996 Presidential Elections Results (%) - Republican Party (Dole)
1996 Presidential Elections Results (%) - Other
2000 Presidential Elections Results (%) - Democratic Party (Gore)
2000 Presidential Elections Results (%) - Republican Party (Bush)
2000 Presidential Elections Results (%) - Other
2004 Presidential Elections Results (%) - Democratic Party (Kerry)
2004 Presidential Elections Results (%) - Republican Party (Bush)
2004 Presidential Elections Results (%) - Other
2008 Presidential Elections Results (%) - Democratic Party (Obama)
2008 Presidential Elections Results (%) - Republican Party (McCain)
2008 Presidential Elections Results (%) - Other
2012 Presidential Elections Results (%) - Democratic Party (Obama)
2012 Presidential Elections Results (%) - Republican Party (Romney)
2012 Presidential Elections Results (%) - Other
2016 Presidential Elections Results (%) - Democratic Party (Clinton)
2016 Presidential Elections Results (%) - Republican Party (Trump)
2016 Presidential Elections Results (%) - Other
2020 Presidential Elections Results (%) - Democratic Party (Biden)
2020 Presidential Elections Results (%) - Republican Party (Trump)
2020 Presidential Elections Results (%) - Other
Ancestries Reported - Arab (%)
Ancestries Reported - Czech (%)
Ancestries Reported - Danish (%)
Ancestries Reported - Dutch (%)
Ancestries Reported - English (%)
Ancestries Reported - French (%)
Ancestries Reported - French Canadian (%)
Ancestries Reported - German (%)
Ancestries Reported - Greek (%)
Ancestries Reported - Hungarian (%)
Ancestries Reported - Irish (%)
Ancestries Reported - Italian (%)
Ancestries Reported - Lithuanian (%)
Ancestries Reported - Norwegian (%)
Ancestries Reported - Polish (%)
Ancestries Reported - Portuguese (%)
Ancestries Reported - Russian (%)
Ancestries Reported - Scotch-Irish (%)
Ancestries Reported - Scottish (%)
Ancestries Reported - Slovak (%)
Ancestries Reported - Subsaharan African (%)
Ancestries Reported - Swedish (%)
Ancestries Reported - Swiss (%)
Ancestries Reported - Ukrainian (%)
Ancestries Reported - United States (%)
Ancestries Reported - Welsh (%)
Ancestries Reported - West Indian (%)
Ancestries Reported - Other (%)
Educational Attainment - No schooling completed (%)
Educational Attainment - Less than high school (%)
Educational Attainment - High school or equivalent (%)
Educational Attainment - Less than 1 year of college (%)
Educational Attainment - 1 or more years of college (%)
Educational Attainment - Associate degree (%)
Educational Attainment - Bachelor's degree (%)
Educational Attainment - Master's degree (%)
Educational Attainment - Professional school degree (%)
Educational Attainment - Doctorate degree (%)
School Enrollment - Nursery, preschool (%)
School Enrollment - Kindergarten (%)
School Enrollment - Grade 1 to 4 (%)
School Enrollment - Grade 5 to 8 (%)
School Enrollment - Grade 9 to 12 (%)
School Enrollment - College undergrad (%)
School Enrollment - Graduate or professional (%)
School Enrollment - Not enrolled in school (%)
School enrollment - Public schools (%)
School enrollment - Private schools (%)
School enrollment - Not enrolled (%)
Median number of rooms in houses and condos
Median number of rooms in apartments
Housing units lacking complete plumbing facilities (%)
Housing units lacking complete kitchen facilities (%)
Density of houses
Urban houses (%)
Rural houses (%)
Households with people 60 years and over (%)
Households with people 65 years and over (%)
Households with people 75 years and over (%)
Households with one or more nonrelatives (%)
Households with no nonrelatives (%)
Population in households (%)
Family households (%)
Nonfamily households (%)
Population in families (%)
Family households with own children (%)
Median number of bedrooms in owner occupied houses
Mean number of bedrooms in owner occupied houses
Median number of bedrooms in renter occupied houses
Mean number of bedrooms in renter occupied houses
Median number of vehichles in owner occupied houses
Mean number of vehichles in owner occupied houses
Median number of vehichles in renter occupied houses
Mean number of vehichles in renter occupied houses
Mortgage status - with mortgage (%)
Mortgage status - with second mortgage (%)
Mortgage status - with home equity loan (%)
Mortgage status - with both second mortgage and home equity loan (%)
Mortgage status - without a mortgage (%)
Average family size
Average family size - White
Average family size - Black or African American
Average family size - Asian
Average family size - Hispanic or Latino
Average family size - American Indian and Alaska Native
Average family size - Multirace
Average family size - Other Race
Geographical mobility - Same house 1 year ago (%)
Geographical mobility - Moved within same county (%)
Geographical mobility - Moved from different county within same state (%)
Geographical mobility - Moved from different state (%)
Geographical mobility - Moved from abroad (%)
Place of birth - Born in state of residence (%)
Place of birth - Born in other state (%)
Place of birth - Native, outside of US (%)
Place of birth - Foreign born (%)
Housing units in structures - 1, detached (%)
Housing units in structures - 1, attached (%)
Housing units in structures - 2 (%)
Housing units in structures - 3 or 4 (%)
Housing units in structures - 5 to 9 (%)
Housing units in structures - 10 to 19 (%)
Housing units in structures - 20 to 49 (%)
Housing units in structures - 50 or more (%)
Housing units in structures - Mobile home (%)
Housing units in structures - Boat, RV, van, etc. (%)
House/condo owner moved in on average (years ago)
Renter moved in on average (years ago)
Year householder moved into unit - Moved in 1999 to March 2000 (%)
Year householder moved into unit - Moved in 1995 to 1998 (%)
Year householder moved into unit - Moved in 1990 to 1994 (%)
Year householder moved into unit - Moved in 1980 to 1989 (%)
Year householder moved into unit - Moved in 1970 to 1979 (%)
Year householder moved into unit - Moved in 1969 or earlier (%)
Means of transportation to work - Drove car alone (%)
Means of transportation to work - Carpooled (%)
Means of transportation to work - Public transportation (%)
Means of transportation to work - Bus or trolley bus (%)
Means of transportation to work - Streetcar or trolley car (%)
Means of transportation to work - Subway or elevated (%)
Means of transportation to work - Railroad (%)
Means of transportation to work - Ferryboat (%)
Means of transportation to work - Taxicab (%)
Means of transportation to work - Motorcycle (%)
Means of transportation to work - Bicycle (%)
Means of transportation to work - Walked (%)
Means of transportation to work - Other means (%)
Working at home (%)
Industry diversity
Most Common Industries - Agriculture, forestry, fishing and hunting, and mining (%)
Most Common Industries - Agriculture, forestry, fishing and hunting (%)
Most Common Industries - Mining, quarrying, and oil and gas extraction (%)
Most Common Industries - Construction (%)
Most Common Industries - Manufacturing (%)
Most Common Industries - Wholesale trade (%)
Most Common Industries - Retail trade (%)
Most Common Industries - Transportation and warehousing, and utilities (%)
Most Common Industries - Transportation and warehousing (%)
Most Common Industries - Utilities (%)
Most Common Industries - Information (%)
Most Common Industries - Finance and insurance, and real estate and rental and leasing (%)
Most Common Industries - Finance and insurance (%)
Most Common Industries - Real estate and rental and leasing (%)
Most Common Industries - Professional, scientific, and management, and administrative and waste management services (%)
Most Common Industries - Professional, scientific, and technical services (%)
Most Common Industries - Management of companies and enterprises (%)
Most Common Industries - Administrative and support and waste management services (%)
Most Common Industries - Educational services, and health care and social assistance (%)
Most Common Industries - Educational services (%)
Most Common Industries - Health care and social assistance (%)
Most Common Industries - Arts, entertainment, and recreation, and accommodation and food services (%)
Most Common Industries - Arts, entertainment, and recreation (%)
Most Common Industries - Accommodation and food services (%)
Most Common Industries - Other services, except public administration (%)
Most Common Industries - Public administration (%)
Occupation diversity
Most Common Occupations - Management, business, science, and arts occupations (%)
Most Common Occupations - Management, business, and financial occupations (%)
Most Common Occupations - Management occupations (%)
Most Common Occupations - Business and financial operations occupations (%)
Most Common Occupations - Computer, engineering, and science occupations (%)
Most Common Occupations - Computer and mathematical occupations (%)
Most Common Occupations - Architecture and engineering occupations (%)
Most Common Occupations - Life, physical, and social science occupations (%)
Most Common Occupations - Education, legal, community service, arts, and media occupations (%)
Most Common Occupations - Community and social service occupations (%)
Most Common Occupations - Legal occupations (%)
Most Common Occupations - Education, training, and library occupations (%)
Most Common Occupations - Arts, design, entertainment, sports, and media occupations (%)
Most Common Occupations - Healthcare practitioners and technical occupations (%)
Most Common Occupations - Health diagnosing and treating practitioners and other technical occupations (%)
Most Common Occupations - Health technologists and technicians (%)
Most Common Occupations - Service occupations (%)
Most Common Occupations - Healthcare support occupations (%)
Most Common Occupations - Protective service occupations (%)
Most Common Occupations - Fire fighting and prevention, and other protective service workers including supervisors (%)
Most Common Occupations - Law enforcement workers including supervisors (%)
Most Common Occupations - Food preparation and serving related occupations (%)
Most Common Occupations - Building and grounds cleaning and maintenance occupations (%)
Most Common Occupations - Personal care and service occupations (%)
Most Common Occupations - Sales and office occupations (%)
Most Common Occupations - Sales and related occupations (%)
Most Common Occupations - Office and administrative support occupations (%)
Most Common Occupations - Natural resources, construction, and maintenance occupations (%)
Most Common Occupations - Farming, fishing, and forestry occupations (%)
Most Common Occupations - Construction and extraction occupations (%)
Most Common Occupations - Installation, maintenance, and repair occupations (%)
Most Common Occupations - Production, transportation, and material moving occupations (%)
Most Common Occupations - Production occupations (%)
Most Common Occupations - Transportation occupations (%)
Most Common Occupations - Material moving occupations (%)
People in Group quarters - Institutionalized population (%)
People in Group quarters - Correctional institutions (%)
People in Group quarters - Federal prisons and detention centers (%)
People in Group quarters - Halfway houses (%)
People in Group quarters - Local jails and other confinement facilities (including police lockups) (%)
People in Group quarters - Military disciplinary barracks (%)
People in Group quarters - State prisons (%)
People in Group quarters - Other types of correctional institutions (%)
People in Group quarters - Nursing homes (%)
People in Group quarters - Hospitals/wards, hospices, and schools for the handicapped (%)
People in Group quarters - Hospitals/wards and hospices for chronically ill (%)
People in Group quarters - Hospices or homes for chronically ill (%)
People in Group quarters - Military hospitals or wards for chronically ill (%)
People in Group quarters - Other hospitals or wards for chronically ill (%)
People in Group quarters - Hospitals or wards for drug/alcohol abuse (%)
People in Group quarters - Mental (Psychiatric) hospitals or wards (%)
People in Group quarters - Schools, hospitals, or wards for the mentally retarded (%)
People in Group quarters - Schools, hospitals, or wards for the physically handicapped (%)
People in Group quarters - Institutions for the deaf (%)
People in Group quarters - Institutions for the blind (%)
People in Group quarters - Orthopedic wards and institutions for the physically handicapped (%)
People in Group quarters - Wards in general hospitals for patients who have no usual home elsewhere (%)
People in Group quarters - Wards in military hospitals for patients who have no usual home elsewhere (%)
People in Group quarters - Juvenile institutions (%)
People in Group quarters - Long-term care (%)
People in Group quarters - Homes for abused, dependent, and neglected children (%)
People in Group quarters - Residential treatment centers for emotionally disturbed children (%)
People in Group quarters - Training schools for juvenile delinquents (%)
People in Group quarters - Short-term care, detention or diagnostic centers for delinquent children (%)
People in Group quarters - Type of juvenile institution unknown (%)
People in Group quarters - Noninstitutionalized population (%)
People in Group quarters - College dormitories (includes college quarters off campus) (%)
People in Group quarters - Military quarters (%)
People in Group quarters - On base (%)
People in Group quarters - Barracks, unaccompanied personnel housing (UPH), (Enlisted/Officer), ;and similar group living quarters for military personnel (%)
People in Group quarters - Transient quarters for temporary residents (%)
People in Group quarters - Military ships (%)
People in Group quarters - Group homes (%)
People in Group quarters - Homes or halfway houses for drug/alcohol abuse (%)
People in Group quarters - Homes for the mentally ill (%)
People in Group quarters - Homes for the mentally retarded (%)
People in Group quarters - Homes for the physically handicapped (%)
People in Group quarters - Other group homes (%)
People in Group quarters - Religious group quarters (%)
People in Group quarters - Dormitories (%)
People in Group quarters - Agriculture workers' dormitories on farms (%)
People in Group quarters - Job Corps and vocational training facilities (%)
People in Group quarters - Other workers' dormitories (%)
People in Group quarters - Crews of maritime vessels (%)
People in Group quarters - Other nonhousehold living situations (%)
People in Group quarters - Other noninstitutional group quarters (%)
Residents speaking English at home (%)
Residents speaking English at home - Born in the United States (%)
Residents speaking English at home - Native, born elsewhere (%)
Residents speaking English at home - Foreign born (%)
Residents speaking Spanish at home (%)
Residents speaking Spanish at home - Born in the United States (%)
Residents speaking Spanish at home - Native, born elsewhere (%)
Residents speaking Spanish at home - Foreign born (%)
Residents speaking other language at home (%)
Residents speaking other language at home - Born in the United States (%)
Residents speaking other language at home - Native, born elsewhere (%)
Residents speaking other language at home - Foreign born (%)
Class of Workers - Employee of private company (%)
Class of Workers - Self-employed in own incorporated business (%)
Class of Workers - Private not-for-profit wage and salary workers (%)
Class of Workers - Local government workers (%)
Class of Workers - State government workers (%)
Class of Workers - Federal government workers (%)
Class of Workers - Self-employed workers in own not incorporated business and Unpaid family workers (%)
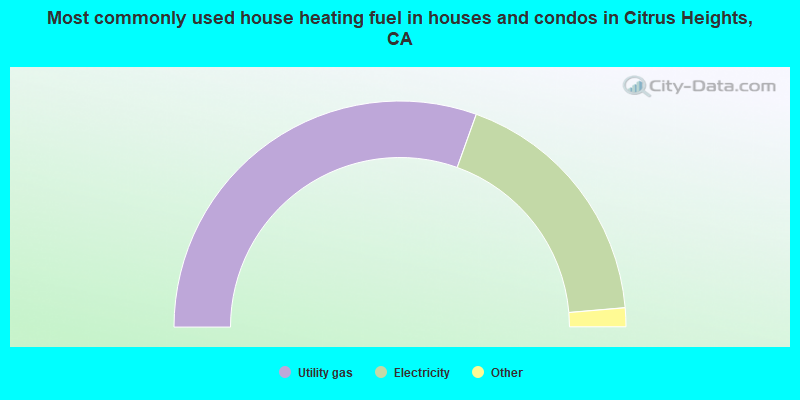
House heating fuel used in houses and condos - Utility gas (%)
House heating fuel used in houses and condos - Bottled, tank, or LP gas (%)
House heating fuel used in houses and condos - Electricity (%)
House heating fuel used in houses and condos - Fuel oil, kerosene, etc. (%)
House heating fuel used in houses and condos - Coal or coke (%)
House heating fuel used in houses and condos - Wood (%)
House heating fuel used in houses and condos - Solar energy (%)
House heating fuel used in houses and condos - Other fuel (%)
House heating fuel used in houses and condos - No fuel used (%)
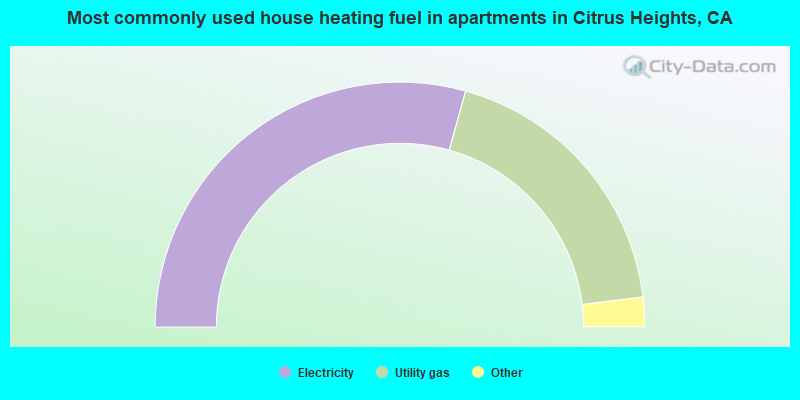
House heating fuel used in apartments - Utility gas (%)
House heating fuel used in apartments - Bottled, tank, or LP gas (%)
House heating fuel used in apartments - Electricity (%)
House heating fuel used in apartments - Fuel oil, kerosene, etc. (%)
House heating fuel used in apartments - Coal or coke (%)
House heating fuel used in apartments - Wood (%)
House heating fuel used in apartments - Solar energy (%)
House heating fuel used in apartments - Other fuel (%)
House heating fuel used in apartments - No fuel used (%)
Armed forces status - In Armed Forces (%)
Armed forces status - Civilian (%)
Armed forces status - Civilian - Veteran (%)
Armed forces status - Civilian - Nonveteran (%)
Fatal accidents locations in years 2005-2021
Fatal accidents locations in 2005
Fatal accidents locations in 2006
Fatal accidents locations in 2007
Fatal accidents locations in 2008
Fatal accidents locations in 2009
Fatal accidents locations in 2010
Fatal accidents locations in 2011
Fatal accidents locations in 2012
Fatal accidents locations in 2013
Fatal accidents locations in 2014
Fatal accidents locations in 2015
Fatal accidents locations in 2016
Fatal accidents locations in 2017
Fatal accidents locations in 2018
Fatal accidents locations in 2019
Fatal accidents locations in 2020
Fatal accidents locations in 2021
Alcohol use - People drinking some alcohol every month (%)
Alcohol use - People not drinking at all (%)
Alcohol use - Average days/month drinking alcohol
Alcohol use - Average drinks/week
Alcohol use - Average days/year people drink much
Audiometry - Average condition of hearing (%)
Audiometry - People that can hear a whisper from across a quiet room (%)
Audiometry - People that can hear normal voice from across a quiet room (%)
Audiometry - Ears ringing, roaring, buzzing (%)
Audiometry - Had a job exposure to loud noise (%)
Audiometry - Had off-work exposure to loud noise (%)
Blood Pressure & Cholesterol - Has high blood pressure (%)
Blood Pressure & Cholesterol - Checking blood pressure at home (%)
Blood Pressure & Cholesterol - Frequently checking blood cholesterol (%)
Blood Pressure & Cholesterol - Has high cholesterol level (%)
Consumer Behavior - Money monthly spent on food at supermarket/grocery store
Consumer Behavior - Money monthly spent on food at other stores
Consumer Behavior - Money monthly spent on eating out
Consumer Behavior - Money monthly spent on carryout/delivered foods
Consumer Behavior - Income spent on food at supermarket/grocery store (%)
Consumer Behavior - Income spent on food at other stores (%)
Consumer Behavior - Income spent on eating out (%)
Consumer Behavior - Income spent on carryout/delivered foods (%)
Current Health Status - General health condition (%)
Current Health Status - Blood donors (%)
Current Health Status - Has blood ever tested for HIV virus (%)
Current Health Status - Left-handed people (%)
Dermatology - People using sunscreen (%)
Diabetes - Diabetics (%)
Diabetes - Had a blood test for high blood sugar (%)
Diabetes - People taking insulin (%)
Diet Behavior & Nutrition - Diet health (%)
Diet Behavior & Nutrition - Milk product consumption (# of products/month)
Diet Behavior & Nutrition - Meals not home prepared (#/week)
Diet Behavior & Nutrition - Meals from fast food or pizza place (#/week)
Diet Behavior & Nutrition - Ready-to-eat foods (#/month)
Diet Behavior & Nutrition - Frozen meals/pizza (#/month)
Drug Use - People that ever used marijuana or hashish (%)
Drug Use - Ever used hard drugs (%)
Drug Use - Ever used any form of cocaine (%)
Drug Use - Ever used heroin (%)
Drug Use - Ever used methamphetamine (%)
Health Insurance - People covered by health insurance (%)
Kidney Conditions-Urology - Avg. # of times urinating at night
Medical Conditions - People with asthma (%)
Medical Conditions - People with anemia (%)
Medical Conditions - People with psoriasis (%)
Medical Conditions - People with overweight (%)
Medical Conditions - Elderly people having difficulties in thinking or remembering (%)
Medical Conditions - People who ever received blood transfusion (%)
Medical Conditions - People having trouble seeing even with glass/contacts (%)
Medical Conditions - People with arthritis (%)
Medical Conditions - People with gout (%)
Medical Conditions - People with congestive heart failure (%)
Medical Conditions - People with coronary heart disease (%)
Medical Conditions - People with angina pectoris (%)
Medical Conditions - People who ever had heart attack (%)
Medical Conditions - People who ever had stroke (%)
Medical Conditions - People with emphysema (%)
Medical Conditions - People with thyroid problem (%)
Medical Conditions - People with chronic bronchitis (%)
Medical Conditions - People with any liver condition (%)
Medical Conditions - People who ever had cancer or malignancy (%)
Mental Health - People who have little interest in doing things (%)
Mental Health - People feeling down, depressed, or hopeless (%)
Mental Health - People who have trouble sleeping or sleeping too much (%)
Mental Health - People feeling tired or having little energy (%)
Mental Health - People with poor appetite or overeating (%)
Mental Health - People feeling bad about themself (%)
Mental Health - People who have trouble concentrating on things (%)
Mental Health - People moving or speaking slowly or too fast (%)
Mental Health - People having thoughts they would be better off dead (%)
Oral Health - Average years since last visit a dentist
Oral Health - People embarrassed because of mouth (%)
Oral Health - People with gum disease (%)
Oral Health - General health of teeth and gums (%)
Oral Health - Average days a week using dental floss/device
Oral Health - Average days a week using mouthwash for dental problem
Oral Health - Average number of teeth
Pesticide Use - Households using pesticides to control insects (%)
Pesticide Use - Households using pesticides to kill weeds (%)
Physical Activity - People doing vigorous-intensity work activities (%)
Physical Activity - People doing moderate-intensity work activities (%)
Physical Activity - People walking or bicycling (%)
Physical Activity - People doing vigorous-intensity recreational activities (%)
Physical Activity - People doing moderate-intensity recreational activities (%)
Physical Activity - Average hours a day doing sedentary activities
Physical Activity - Average hours a day watching TV or videos
Physical Activity - Average hours a day using computer
Physical Functioning - People having limitations keeping them from working (%)
Physical Functioning - People limited in amount of work they can do (%)
Physical Functioning - People that need special equipment to walk (%)
Physical Functioning - People experiencing confusion/memory problems (%)
Physical Functioning - People requiring special healthcare equipment (%)
Prescription Medications - Average number of prescription medicines taking
Preventive Aspirin Use - Adults 40+ taking low-dose aspirin (%)
Reproductive Health - Vaginal deliveries (%)
Reproductive Health - Cesarean deliveries (%)
Reproductive Health - Deliveries resulted in a live birth (%)
Reproductive Health - Pregnancies resulted in a delivery (%)
Reproductive Health - Women breastfeeding newborns (%)
Reproductive Health - Women that had a hysterectomy (%)
Reproductive Health - Women that had both ovaries removed (%)
Reproductive Health - Women that have ever taken birth control pills (%)
Reproductive Health - Women taking birth control pills (%)
Reproductive Health - Women that have ever used Depo-Provera or injectables (%)
Reproductive Health - Women that have ever used female hormones (%)
Sexual Behavior - People 18+ that ever had sex (vaginal, anal, or oral) (%)
Sexual Behavior - Males 18+ that ever had vaginal sex with a woman (%)
Sexual Behavior - Males 18+ that ever performed oral sex on a woman (%)
Sexual Behavior - Males 18+ that ever had anal sex with a woman (%)
Sexual Behavior - Males 18+ that ever had any sex with a man (%)
Sexual Behavior - Females 18+ that ever had vaginal sex with a man (%)
Sexual Behavior - Females 18+ that ever performed oral sex on a man (%)
Sexual Behavior - Females 18+ that ever had anal sex with a man (%)
Sexual Behavior - Females 18+ that ever had any kind of sex with a woman (%)
Sexual Behavior - Average age people first had sex
Sexual Behavior - Average number of female sex partners in lifetime (males 18+)
Sexual Behavior - Average number of female vaginal sex partners in lifetime (males 18+)
Sexual Behavior - Average age people first performed oral sex on a woman (18+)
Sexual Behavior - Average number of woman performed oral sex on in lifetime (18+)
Sexual Behavior - Average number of male sex partners in lifetime (males 18+)
Sexual Behavior - Average number of male anal sex partners in lifetime (males 18+)
Sexual Behavior - Average age people first performed oral sex on a man (18+)
Sexual Behavior - Average number of male oral sex partners in lifetime (18+)
Sexual Behavior - People using protection when performing oral sex (%)
Sexual Behavior - Average number of times people have vaginal or anal sex a year
Sexual Behavior - People having sex without condom (%)
Sexual Behavior - Average number of male sex partners in lifetime (females 18+)
Sexual Behavior - Average number of male vaginal sex partners in lifetime (females 18+)
Sexual Behavior - Average number of female sex partners in lifetime (females 18+)
Sexual Behavior - Circumcised males 18+ (%)
Sleep Disorders - Average hours sleeping at night
Sleep Disorders - People that has trouble sleeping (%)
Smoking-Cigarette Use - People smoking cigarettes (%)
Taste & Smell - People 40+ having problems with smell (%)
Taste & Smell - People 40+ having problems with taste (%)
Taste & Smell - People 40+ that ever had wisdom teeth removed (%)
Taste & Smell - People 40+ that ever had tonsils teeth removed (%)
Taste & Smell - People 40+ that ever had a loss of consciousness because of a head injury (%)
Taste & Smell - People 40+ that ever had a broken nose or other serious injury to face or skull (%)
Taste & Smell - People 40+ that ever had two or more sinus infections (%)
Weight - Average height (inches)
Weight - Average weight (pounds)
Weight - Average BMI
Weight - People that are obese (%)
Weight - People that ever were obese (%)
Weight - People trying to lose weight (%)
55,511 64.2% White alone 18,422 21.3% Hispanic 3,896 4.5% Two or more races 3,697 4.3% Asian alone 3,467 4.0% Black alone 634 0.7% Other race alone 483 0.6% Native Hawaiian and Other 330 0.4% American Indian alone
The City-Data.com crime index weighs serious crimes and violent crimes more heavily. Higher means more crime, U.S. average is 246.1. It adjusts for the number of visitors and daily workers commuting into cities.
- means the value is smaller than the state average.
- means the value is about the same as the state average.
- means the value is bigger than the state average.
- means the value is much bigger than the state average.
Crime rate in Citrus Heights detailed stats: murders, rapes, robberies, assaults, burglaries, thefts, arson Officers per 1,000 residents here:
0.84California average:
2.30
Latest news from Citrus Heights, CA collected exclusively by city-data.com from local newspapers, TV, and radio stations
Ancestries: English (8.0%), German (6.7%), Irish (6.1%), Ukrainian (5.0%), American (4.2%), Russian (3.6%).
Current Local Time:
Land area: 14.3 square miles.
Population density: 6,024 people per square mile (high).
13,169 residents are foreign born (5.7% Europe , 4.4% Latin America , 4.2% Asia ).
This city:
15.1%California:
26.5%
Median real estate property taxes paid for housing units with mortgages in 2022: $2,898 (0.6%)Median real estate property taxes paid for housing units with no mortgage in 2022: $2,018 (0.6%)
Nearest city with pop. 200,000+: Sacramento, CA
Nearest city with pop. 1,000,000+: Los Angeles, CA
Nearest cities:
Latitude: 38.69 N, Longitude: 121.29 W
Daytime population change due to commuting: -19,577 (-22.6%)Workers who live and work in this city: 10,784 (25.5%)
Single-family new house construction building permits:
2022: 118 buildings , average cost: $232,6002021: 215 buildings , average cost: $263,2002020: 22 buildings , average cost: $205,0002019: 15 buildings , average cost: $231,9002018: 20 buildings , average cost: $225,7002017: 18 buildings , average cost: $239,0002016: 15 buildings , average cost: $236,1002015: 21 buildings , average cost: $235,4002014: 18 buildings , average cost: $235,4002013: 21 buildings , average cost: $235,3002012: 17 buildings , average cost: $243,3002011: 16 buildings , average cost: $246,4002010: 17 buildings , average cost: $251,7002009: 16 buildings , average cost: $230,5002008: 20 buildings , average cost: $230,5002007: 42 buildings , average cost: $230,6002006: 58 buildings , average cost: $230,2002005: 40 buildings , average cost: $230,6002004: 144 buildings , average cost: $193,7002003: 27 buildings , average cost: $146,9002002: 21 buildings , average cost: $147,7002001: 51 buildings , average cost: $188,9002000: 165 buildings , average cost: $181,8001999: 90 buildings , average cost: $169,5001998: 175 buildings , average cost: $102,4001997: 14 buildings , average cost: $116,100Unemployment in December 2023: Population change in the 1990s: +2,614 (+3.2%).
Most common occupations in Citrus Heights, CA (%)
Both Males Females
Cooks and food preparation workers (7.2%)
Other management occupations, except farmers and farm managers (5.1%)
Building and grounds cleaning and maintenance occupations (4.6%)
Other office and administrative support workers, including supervisors (3.9%)
Retail sales workers, except cashiers (3.7%)
Material recording, scheduling, dispatching, and distributing workers (2.9%)
Computer specialists (2.6%)
Cooks and food preparation workers (7.4%)
Building and grounds cleaning and maintenance occupations (6.8%)
Other management occupations, except farmers and farm managers (5.8%)
Vehicle and mobile equipment mechanics, installers, and repairers (4.5%)
Driver/sales workers and truck drivers (4.2%)
Electrical equipment mechanics and other installation, maintenance, and repair workers, including supervisors (3.7%)
Construction laborers (3.2%)
Other office and administrative support workers, including supervisors (7.2%)
Cooks and food preparation workers (7.0%)
Other management occupations, except farmers and farm managers (4.4%)
Retail sales workers, except cashiers (4.3%)
Information and record clerks, except customer service representatives (4.0%)
Waiters and waitresses (3.5%)
Supervisors and other personal care and service workers, except child care workers (3.4%)
Earthquake activity:
Citrus Heights-area historical earthquake activity is significantly above California state average. It is 7627% greater than the overall U.S. average. On 4/18/1906 at 13:12:21, a magnitude 7.9 (7.9 UK, Class: Major, Intensity: VIII - XII) earthquake occurred 104.4 miles away from the city center, causing $524,000,000 total damage On 10/18/1989 at 00:04:15, a magnitude 7.1 (6.5 MB, 7.1 MS, 6.9 MW, 7.0 ML) earthquake occurred 112.7 miles away from Citrus Heights center, causing 62 deaths ( 62 shaking deaths) and 3757 injuries, causing $1,305,032,704 total damage On 10/3/1915 at 06:52:48, a magnitude 7.6 (7.6 UK) earthquake occurred 237.5 miles away from the city center On 7/21/1952 at 11:52:14, a magnitude 7.7 (7.7 UK) earthquake occurred 285.2 miles away from Citrus Heights center, causing $50,000,000 total damage On 12/21/1932 at 06:10:09, a magnitude 7.2 (7.2 UK) earthquake occurred 173.8 miles away from Citrus Heights center On 1/31/1922 at 13:17:28, a magnitude 7.6 (7.6 UK) earthquake occurred 265.8 miles away from Citrus Heights center Magnitude types: body-wave magnitude (MB), local magnitude (ML), surface-wave magnitude (MS), moment magnitude (MW) Natural disasters: The number of natural disasters in Sacramento County (18) is near the US average (15).Major Disasters (Presidential) Declared: 11Emergencies Declared: 3Floods: 13, Winter Storms: 6, Storms: 5, Mudslides: 4, Landslides: 3, Drought: 1, Earthquake: 1, Heavy Rain: 1, Hurricane: 1, Tornado: 1, Wind: 1, Other: 1 (Note: some incidents may be assigned to more than one category). Hospitals and medical centers in Citrus Heights: MANORCARE HEALTH SERVICES (CITRUS HEIGHTS) (7807 UPLANDS WAY)
SUNRISE COMMUNITY (7501 SUNRISE BLVD)
ANTELOPE DIALYSIS CENTER (6406 TUPELO DRIVE STE-A)
FIRST CALL HOME CARE (6929 SUNRISE BLVD, SUITE 180)
Amtrak stations near Citrus Heights: 4 miles: ROSEVILLE (201 PACIFIC ST.) Services: partially wheelchair accessible, public payphones, free short-term parking, free long-term parking, taxi stand, intercity bus service.
8 miles: ROCKLIN (ROCKLIN RD. & RAILROAD AVE.) - Bus Station Services: partially wheelchair accessible, free short-term parking.
8 miles: RANCHO CORDOVA (10369 FOLSOM BLVD.) - Bus Station Services: fully wheelchair accessible, free short-term parking, public transit connection.
College/University in Citrus Heights: Carrington College California-Citrus Heights Full-time enrollment: 486; Location: 7301 Greenback Lane, Ste A; Private, for-profit; Website: www.carrington.edu)
Colleges/universities with over 2000 students nearest to Citrus Heights:
American River College (about 5 miles; Sacramento, CA ; Full-time enrollment: 20,452)
Sierra College (about 8 miles; Rocklin, CA ; FT enrollment: 11,488)
Folsom Lake College (about 10 miles; Folsom, CA ; FT enrollment: 5,308)
California State University-Sacramento (about 12 miles; Sacramento, CA ; FT enrollment: 22,234)
Universal Technical Institute of Northern California Inc (about 14 miles; Sacramento, CA ; FT enrollment: 3,193)
University of Phoenix-Sacramento Valley Campus (about 14 miles; Sacramento, CA ; FT enrollment: 2,855)
Sacramento City College (about 16 miles; Sacramento, CA ; FT enrollment: 15,963)
Public high schools in Citrus Heights: MESA VERDE HIGH Students: 820, Location: 7501 CARRIAGE DR., Grades: 9-12)SAN JUAN HIGH Students: 451, Location: 7551 GREENBACK LN., Grades: 9-12)Private high schools in Citrus Heights: VALLEY OAK ACADEMY-ANTELOPE/MARIPOSA/MADISON Students: 22, Location: 7730 ANTELOPE RD, Grades: 5-12, Boys only )
HARVEST ACADEMY Students: 18, Location: 8127 AUBURN BLVD, Grades: 3-12)
Biggest public elementary/middle schools in Citrus Heights: SYLVAN MIDDLE Students: 557, Location: 7137 AUBURN BLVD., Grades: 6-8)SKYCREST ELEMENTARY Students: 491, Location: 5641 MARIPOSA AVE., Grades: KG-5)LICHEN K-8 Students: 489, Location: 8319 LICHEN DR., Grades: KG-8)WOODSIDE K-8 Students: 435, Location: 8248 VILLA OAK DR., Grades: KG-8)CARRIAGE DRIVE ELEMENTARY Students: 372, Location: 7519 CARRIAGE DR., Grades: KG-6)MARIPOSA AVENUE ELEMENTARY Students: 336, Location: 7940 MARIPOSA AVE., Grades: KG-5)ARLINGTON HEIGHTS ELEMENTARY Students: 310, Location: 6401 TRENTON WAY, Grades: KG-5)CITRUS HEIGHTS ELEMENTARY Students: 304, Location: 7085 AUBURN BLVD., Grades: KG-5)KINGSWOOD ELEMENTARY Students: 301, Location: 5700 PRIMROSE DR., Grades: KG-8)CAMBRIDGE HEIGHTS ELEMENTARY Students: 298, Location: 5555 FLEETWOOD DR., Grades: KG-5)Private elementary/middle schools in Citrus Heights: HOLY FAMILY CATHOLIC SCHOOL Students: 278, Location: 7817 OLD AUBURN RD, Grades: KG-8)
FAITH CHRISTIAN ACADEMY Students: 104, Location: 7737 HIGHLAND AVE, Grades: KG-8)
ST MARKS LUTHERAN SCHOOL Students: 89, Location: 7869 KINGSWOOD DR, Grades: PK-8)
See full list of schools located in Citrus Heights User-submitted facts and corrections:
Sunrise Tech Center-San Juan Unified School District adult education serving adults in vocational/job training, community interest, English as a Second Language, Diploma/GED preparation. 7322 Sunrise Blvd, CH 916.971.5049
Notable locations in Citrus Heights: (A) , Sylvan Corners (B) , Birdcage Center (C) , Rusch Home and Botanical Garden (D) , Foothill Golf Center (E) , Laymens Retreat House (F) , Sylvan Oaks Community Library (G) , Sacramento Metropolitan Fire District Station 28 (H) , Sacramento Metropolitan Fire District Station 27 (I) , Sacramento Metropolitan Fire District Station 23 (J) , Sacramento Metropolitan Fire District Station 21 (K) , Citrus Heights Police Station (L) , Citrus Heights City Hall (M) . Display/hide their locations on the map
Shopping Centers: (1) , Sunrise Festival Shopping Center (2) , Sunrise Mall (3) , Madison-Sunrise Shopping Center (4) , Cascade Plaza Shopping Center (5) , Woodmore Oaks Shopping Center (6) , Sunrise Plaza Shopping Center (7) , Copperwood Square Shopping Center (8) , Ancil Hoffman Shopping Center (9) . Display/hide their locations on the map
Churches in Citrus Heights include: (A) , Ascension Lutheran Church (B) , Sunrise Unity Church (C) , Church of Christ (D) , Citrus Heights United Methodist Church (E) , Messiah Lutheran Church (F) , Resurrection Life of Jesus Church (G) , Sun Oak Baptist Church (H) . Display/hide their locations on the map
Cemeteries: (1) , Sylvan Cemetery (2) . Display/hide their locations on the map
Creek: (A) . Display/hide its location on the map
Parks in Citrus Heights include: (1) , Rusch Park (2) , San Juan Park (3) , Westwood Park (4) , C-Bar-C Park (5) , Crosswoods Park (6) , McDonald Field (7) , Sunrise Oaks Park (8) , Brooktree Park (9) . Display/hide their locations on the map
Tourist attractions:
Birthplace of: Cheri Elliott - Champion female bicycle motocross racer, Mandisa - Musisian, Bo Cantrell - Martial artist.
Sacramento County has a predicted average indoor radon screening level less than 2 pCi/L (pico curies per liter) - Low Potential Drinking water stations with addresses in Citrus Heights and their reported violations in the past:
CITRUS HEIGHTS WATER DISTRICT (Population served: 66,500, Purch surface water):
Past monitoring violations:
Monitoring and Reporting (DBP) - Between APR-2007 and JUN-2007, Contaminant: Total Haloacetic Acids (HAA5). Follow-up actions: St Formal NOV issued (NOV-16-2007)
Monitoring and Reporting (DBP) - In APR-01-2007, Contaminant: DBP Stage 1. Follow-up actions: St Formal NOV issued (NOV-16-2007)
Monitoring and Reporting (DBP) - Between APR-2007 and JUN-2007, Contaminant: TTHM. Follow-up actions: St Formal NOV issued (NOV-16-2007)
Population served: 200, Groundwater):
Past health violations:
MCL, Monthly (TCR) - In JUN-2013, Contaminant: Coliform. Follow-up actions: St Violation/Reminder Notice (AUG-12-2009), St AO (w/o penalty) issued (JUL-30-2013)
MCL, Monthly (TCR) - In JUL-2009, Contaminant: Coliform. Follow-up actions: St Violation/Reminder Notice (AUG-12-2009)
MCL, Monthly (TCR) - In JUL-2009, Contaminant: Coliform. Follow-up actions: St Violation/Reminder Notice (AUG-12-2009)
MCL, Monthly (TCR) - In MAY-2007, Contaminant: Coliform
MCL, Monthly (TCR) - In JUL-2006, Contaminant: Coliform. Follow-up actions: St Violation/Reminder Notice (AUG-21-2006)
MCL, Monthly (TCR) - In JUL-2006, Contaminant: Coliform
Population served: 150, Groundwater):
Past health violations:
MCL, Monthly (TCR) - Between JUL-2010 and SEP-2010, Contaminant: Coliform. Follow-up actions: St Violation/Reminder Notice (AUG-02-2010), St Compliance achieved (AUG-08-2010)
Average household size: This city:
2.5 peopleCalifornia:
2.9 people
Percentage of family households: This city:
64.1%Whole state:
68.7%
Percentage of households with unmarried partners: This city:
8.9%Whole state:
7.2%
Likely homosexual households (counted as self-reported same-sex unmarried-partner households)
Lesbian couples: 0.5% of all households Gay men: 0.3% of all households
People in group quarters in Citrus Heights in 2010:
234 people in group homes intended for adults
131 people in nursing facilities/skilled-nursing facilities
51 people in workers' group living quarters and job corps centers
35 people in residential treatment centers for juveniles (non-correctional)
16 people in group homes for juveniles (non-correctional)
13 people in residential treatment centers for adults
6 people in other noninstitutional facilities
People in group quarters in Citrus Heights in 2000:
541 people in nursing homes
154 people in other noninstitutional group quarters
59 people in other nonhousehold living situations
36 people in residential treatment centers for emotionally disturbed children
33 people in homes or halfway houses for drug/alcohol abuse
17 people in homes for the mentally retarded
8 people in religious group quarters
6 people in other group homes
3 people in hospitals/wards and hospices for chronically ill
3 people in hospices or homes for chronically ill
Banks with most branches in Citrus Heights (2011 data):
Wells Fargo Bank, National Association: Auburn And Linden, Sacramento-Sunrise Branch, Citrus Heights Raley's Branch, Greenback & Shupe Branch. Info updated 2011/04/05: Bank assets: $1,161,490.0 mil, Deposits: $905,653.0 mil, headquarters in Sioux Falls, SD, positive income , 6395 total offices , Holding Company: Wells Fargo & Company
JPMorgan Chase Bank, National Association: Citrus Heights Branch at 7084 Auburn Boulevard, Suite 100, branch established on 2007/12/03; 5801 Sunrise Blvd Branch at 5801 Sunrise Blvd, branch established on 1988/12/27. Info updated 2011/11/10: Bank assets: $1,811,678.0 mil, Deposits: $1,190,738.0 mil, headquarters in Columbus, OH, positive income , International Specialization, 5577 total offices , Holding Company: Jpmorgan Chase & Co.
Bank of America, National Association: Sunrise Center Branch at 7850 Kingswood Drive, branch established on 1971/01/28; Citrus Heights Branch at 7965 Auburn Boulevard, branch established on 1961/09/08. Info updated 2009/11/18: Bank assets: $1,451,969.3 mil, Deposits: $1,077,176.8 mil, headquarters in Charlotte, NC, positive income , 5782 total offices , Holding Company: Bank Of America Corporation
El Dorado Savings Bank, F.S.B.: Citrus Heights Branch at 7895 Lichen Dr, branch established on 1956/01/01. Info updated 2011/07/21: Bank assets: $1,706.7 mil, Deposits: $1,536.5 mil, headquarters in Placerville, CA, positive income , Mortgage Lending Specialization, 35 total offices
Bank of the West: Citrus Heights Branch at 7381 Greenback Lane, branch established on 1921/01/01. Info updated 2009/11/16: Bank assets: $62,408.3 mil, Deposits: $43,995.2 mil, headquarters in San Francisco, CA, positive income , 647 total offices , Holding Company: Bnp Paribas
Citibank, National Association: 5610 Sunrise Blvd Branch at 5610 Sunrise Blvd, branch established on 1923/01/01. Info updated 2012/01/10: Bank assets: $1,288,658.0 mil, Deposits: $882,541.0 mil, headquarters in Sioux Falls, SD, positive income , International Specialization, 1048 total offices , Holding Company: Citigroup Inc.
Union Bank, National Association: Sunrise Branch at 5748 Sunrise Boulevard, branch established on 1980/06/09. Info updated 2011/09/01: Bank assets: $88,967.5 mil, Deposits: $65,286.4 mil, headquarters in San Francisco, CA, positive income , Commercial Lending Specialization, 403 total offices , Holding Company: Mitsubishi Ufj Financial Group, Inc.
River City Bank: Sunrise Branch at 5650 Sunrise Boulevard, branch established on 1976/10/19. Info updated 2006/11/03: Bank assets: $1,119.8 mil, Deposits: $900.1 mil, headquarters in Sacramento, CA, positive income , Commercial Lending Specialization, 15 total offices
U.S. Bank National Association: Sunrise Mall Branch at 6199 Sunrise Mall, branch established on 1972/04/19. Info updated 2012/01/30: Bank assets: $330,470.8 mil, Deposits: $236,091.5 mil, headquarters in Cincinnati, OH, positive income , 3121 total offices , Holding Company: U.S. Bancorp
For population 15 years and over in Citrus Heights:
Never married: 33.4%Now married: 43.7%Separated: 2.1%Widowed: 6.0%Divorced: 14.9% For population 25 years and over in Citrus Heights:
High school or higher: 89.8%Bachelor's degree or higher: 20.5%Graduate or professional degree: 5.0%Unemployed: 4.5%Mean travel time to work (commute): 23.7 minutes
Education Gini index (Inequality in education) Here:
10.7California average:
15.5
Religion statistics for Citrus Heights, CA (based on Sacramento County data)
Religion Adherents Congregations Catholic 229,725 45 Evangelical Protestant 157,621 493 Other 86,390 183 Mainline Protestant 33,989 105 Black Protestant 12,585 38 Orthodox 5,675 12 None 892,803 -
Source: Clifford Grammich, Kirk Hadaway, Richard Houseal, Dale E.Jones, Alexei Krindatch, Richie Stanley and Richard H.Taylor. 2012. 2010 U.S.Religion Census: Religious Congregations & Membership Study. Association of Statisticians of American Religious Bodies. Jones, Dale E., et al. 2002. Congregations and Membership in the United States 2000. Nashville, TN: Glenmary Research Center. Graphs represent county-level data
Food Environment Statistics: Number of grocery stores : 255Sacramento County :
1.85 / 10,000 pop.California :
2.14 / 10,000 pop.
Number of supercenters and club stores : 10Sacramento County :
0.07 / 10,000 pop.State :
0.04 / 10,000 pop.
Number of convenience stores (no gas) : 86Sacramento County :
0.62 / 10,000 pop.California :
0.62 / 10,000 pop.
Number of convenience stores (with gas) : 233Sacramento County :
1.69 / 10,000 pop.California :
1.49 / 10,000 pop.
Number of full-service restaurants : 922Sacramento County :
6.68 / 10,000 pop.California :
7.42 / 10,000 pop.
Adult diabetes rate : This county :
7.8%California :
7.3%
Adult obesity rate : This county :
25.0%California :
21.3%
Low-income preschool obesity rate : Sacramento County :
15.4%California :
17.9%
Health and Nutrition: Healthy diet rate : Citrus Heights:
49.6%California:
49.4%
Average overall health of teeth and gums : Citrus Heights:
47.0%California:
48.0%
Average BMI : Citrus Heights:
28.7California:
28.1
People feeling badly about themselves : Citrus Heights:
20.7%State:
20.2%
People not drinking alcohol at all : Here:
10.9%California:
11.2%
Average hours sleeping at night : This city:
6.8California:
6.8
Overweight people : This city:
34.0%California:
31.5%
General health condition : Average condition of hearing : This city:
79.2%State:
80.9%
More about Health and Nutrition of Citrus Heights, CA Residents
Local government employment and payroll (March 2022)
Function
Full-time employees
Monthly full-time payroll
Average yearly full-time wage
Part-time employees
Monthly part-time payroll
Police Protection - Officers
89 $874,862 $117,959 4 $7,400 Police - Other
39 $247,221 $76,068 10 $23,874 Streets and Highways
13 $108,119 $99,802 0 $0 Other and Unallocable
12 $83,942 $83,942 7 $14,171 Financial Administration
12 $105,579 $105,579 0 $0 Other Government Administration
12 $99,317 $99,317 0 $0 Housing and Community Development (Local)
8 $51,664 $77,496 0 $0
Totals for Government
185 $1,570,703 $101,883 21 $45,446
Citrus Heights government finances - Expenditure in 2017 (per resident):
Construction - Housing and Community Development: $5,518,000 ($63.84)
Regular Highways: $4,486,000 ($51.90)Central Staff Services: $929,000 ($10.75)Police Protection: $888,000 ($10.27)Protective Inspection and Regulation - Other: $510,000 ($5.90)Parks and Recreation: $32,000 ($0.37)Current Operations - Police Protection: $19,841,000 ($229.55)
Regular Highways: $8,960,000 ($103.66)Central Staff Services: $6,795,000 ($78.62)Transit Utilities: $3,400,000 ($39.34)Protective Inspection and Regulation - Other: $2,206,000 ($25.52)Financial Administration: $1,139,000 ($13.18)Housing and Community Development: $868,000 ($10.04)Solid Waste Management: $794,000 ($9.19)Parks and Recreation: $754,000 ($8.72)Health - Other: $504,000 ($5.83)General - Interest on Debt: $1,220,000 ($14.11)
Intergovernmental to Local - Other - Transit Utilities: $3,419,000 ($39.56)
Other - General - Other: $509,000 ($5.89)Other - Health - Other: $186,000 ($2.15)Other Capital Outlay - Housing and Community Development: $191,000 ($2.21)
Citrus Heights government finances - Revenue in 2017 (per resident):
Charges - Other: $5,822,000 ($67.36)
Solid Waste Management: $762,000 ($8.82)Regular Highways: $544,000 ($6.29)Housing and Community Development: $110,000 ($1.27)Federal Intergovernmental - Other: $1,322,000 ($15.30)
Housing and Community Development: $1,230,000 ($14.23)Miscellaneous - Interest Earnings: $1,504,000 ($17.40)
Fines and Forfeits: $1,258,000 ($14.55)General Revenue - Other: $834,000 ($9.65)Rents: $624,000 ($7.22)Sale of Property: $415,000 ($4.80)Donations From Private Sources: $63,000 ($0.73)Revenue - Transit Utilities: $29,000 ($0.34)
State Intergovernmental - Highways: $1,639,000 ($18.96)
Other: $1,443,000 ($16.70)General Local Government Support: $52,000 ($0.60)Tax - General Sales and Gross Receipts: $17,881,000 ($206.88)
Property: $12,572,000 ($145.45)Public Utilities Sales: $4,147,000 ($47.98)Other License: $898,000 ($10.39)Documentary and Stock Transfer: $304,000 ($3.52)Occupation and Business License - Other: $232,000 ($2.68)Other Selective Sales: $16,000 ($0.19)
Citrus Heights government finances - Debt in 2017 (per resident):
Long Term Debt - Beginning Outstanding - Unspecified Public Purpose: $30,500,000 ($352.87)
Outstanding Unspecified Public Purpose: $26,584,000 ($307.57)Retired Unspecified Public Purpose: $3,916,000 ($45.31)
Citrus Heights government finances - Cash and Securities in 2017 (per resident):
Bond Funds - Cash and Securities: $2,074,000 ($24.00)
Other Funds - Cash and Securities: $18,595,000 ($215.14)
5.68% of this county's 2021 resident taxpayers lived in other counties in 2020 ($67,729 average adjusted gross income )
Here:
5.68%California average:
5.19%
0.01% of residents moved from foreign countries ($150 average AGI )Sacramento County:
0.01%California average:
0.03%
Top counties from which taxpayers relocated into this county between 2020 and 2021:
6.10% of this county's 2020 resident taxpayers moved to other counties in 2021 ($74,281 average adjusted gross income )
Here:
6.10%California average:
6.14%
0.01% of residents moved to foreign countries ($109 average AGI )Sacramento County:
0.01%California average:
0.02%
Top counties to which taxpayers relocated from this county between 2020 and 2021:
Businesses in Citrus Heights, CA
Name Count Name Count
24 Hour Fitness 1 Lane Furniture 3 7-Eleven 4 Little Caesars Pizza 1 AT&T 3 Lowe's 1 Aeropostale 1 Macy's 1 American Eagle Outfitters 1 Marshalls 1 AutoZone 2 McDonald's 4 Barnes & Noble 1 Men's Wearhouse 1 Baskin-Robbins 3 Motherhood Maternity 1 Bath & Body Works 2 New Balance 1 Blockbuster 2 Nike 4 Buffalo Wild Wings 1 Old Navy 1 Burger King 3 Olive Garden 1 Burlington Coat Factory 1 Pac Sun 1 CVS 1 Panda Express 1 Carl\s Jr. 3 Panera Bread 1 Chipotle 1 Payless 2 Chuck E. Cheese's 1 Penske 1 Cinnabon 1 PetSmart 1 Circle K 1 Pier 1 Imports 1 Cold Stone Creamery 1 Pizza Hut 1 Costco 1 Popeyes 1 Curves 1 RadioShack 1 Dairy Queen 3 Red Lobster 1 Dennys 1 Red Robin 1 Domino's Pizza 1 Rite Aid 3 Dressbarn 1 SAS Shoes 2 El Pollo Loco 1 Safeway 1 Express 1 Sam's Club 1 Famous Footwear 1 Spencer Gifts 1 FedEx 6 Sprint Nextel 1 Firestone Complete Auto Care 1 Staples 1 Foot Locker 1 Starbucks 4 Fredericks Of Hollywood 1 Subway 7 GNC 2 T-Mobile 4 GameStop 2 Taco Bell 4 H&R Block 4 Target 1 HomeTown Buffet 1 Toys"R"Us 2 Honda 1 U-Haul 2 Hot Topic 1 UPS 7 Jamba Juice 1 Vans 4 Jones New York 2 Verizon Wireless 1 Journeys 1 Victoria's Secret 1 KFC 2 Vons 1 Kohl's 1 Walgreens 2 Kroger 1 Walmart 1 Lane Bryant 1 Wet Seal 1
Strongest AM radio stations in Citrus Heights:
KFIA (710 AM; 25 kW; CARMICHAEL, CA; Owner: VISTA BROADCASTING INC.)
KLIB (1110 AM; 10 kW; ROSEVILLE, CA; Owner: WAY BROADCASTING, INC.)
KFSG (1690 AM; 10 kW; ROSEVILLE, CA; Owner: WAY BROADCASTING, INC.)
KSTE (650 AM; 25 kW; RANCHO CORDOVA, CA; Owner: AMFM RADIO LICENSES, L.L.C.)
KFBK (1530 AM; 50 kW; SACRAMENTO, CA; Owner: AMFM RADIO LICENSES, L.L.C.)
KHTK (1140 AM; 50 kW; SACRAMENTO, CA; Owner: INFINITY RADIO SUBSIDIARY OPERATIONS INC.)
KSMH (1620 AM; 10 kW; WEST SACRAMENTO, CA; Owner: IHR EDUCATIONAL BROADCASTING)
KAHI (950 AM; 10 kW; AUBURN, CA; Owner: IHR EDUCATIONAL BROADCASTING)
KTKZ (1380 AM; 5 kW; SACRAMENTO, CA; Owner: VISTA BROADCASTING, INC.)
KIID (1470 AM; 5 kW; SACRAMENTO, CA; Owner: ABC, INC.)
KCTC (1320 AM; 5 kW; SACRAMENTO, CA; Owner: ENTERCOM SACRAMENTO LICENSE, LLC)
KCBC (770 AM; 50 kW; RIVERBANK, CA; Owner: KIERTRON, INC.)
KEBR (1210 AM; 5 kW; ROCKLIN, CA; Owner: FAMILY STATIONS, INC.)
Strongest FM radio stations in Citrus Heights:
KXOA (93.7 FM; ROSEVILLE, CA; Owner: INFINITY RADIO SUBSIDIARY OPERATIONS INC.)
K211DF (90.1 FM; FOOTHILL FARMS, CA; Owner: YOUR CHRISTIAN COMPANION NETWORK, INC.)
KXCL (103.9 FM; YUBA CITY, CA; Owner: HARLAN COMMUNICATIONS, INC.)
KSEG (96.9 FM; SACRAMENTO, CA; Owner: ENTERCOM SACRAMENTO LICENSE, LLC)
KXPR (90.9 FM; SACRAMENTO, CA; Owner: CALIFORNIA STATE UNIVERSITY)
KGBY (92.5 FM; SACRAMENTO, CA; Owner: AMFM RADIO LICENSES, L.L.C.)
KEDR (88.1 FM; SACRAMENTO, CA; Owner: FAMILY STATIONS, INC.)
KRXQ (98.5 FM; SACRAMENTO, CA; Owner: ENTERCOM SACRAMENTO LICENSE, LLC)
KNCI (105.1 FM; SACRAMENTO, CA; Owner: INFINITY RADIO SUBSIDIARY OPERATIONS INC.)
KDND (107.9 FM; SACRAMENTO, CA; Owner: ENTERCOM SACRAMENTO LICENSE, LLC)
K256AG (99.1 FM; CLARKSVILLE, CA; Owner: EDUCATIONAL MEDIA FOUNDATION)
KWOD (106.5 FM; SACRAMENTO, CA; Owner: ENTERCOM SACRAMENTO LICENSE, LLC)
KQEI-FM (89.3 FM; NORTH HIGHLANDS, CA; Owner: KQED, INC.)
KRCX-FM (99.9 FM; MARYSVILLE, CA; Owner: ENTRAVISION HOLDINGS, LLC)
KYMX (96.1 FM; SACRAMENTO, CA; Owner: INFINITY RADIO OPERATIONS INC.)
KZZO (100.5 FM; SACRAMENTO, CA; Owner: INFINITY RADIO OPERATIONS INC.)
KKSF-FM1 (103.7 FM; PLEASANTON, ETC., CA; Owner: AMFM RADIO LICENSES, L.L.C.)
KMJE (101.5 FM; GRIDLEY, CA; Owner: RESULTS RADIO LICENSEE, LLC)
KHYL (101.1 FM; AUBURN, CA; Owner: AMFM RADIO LICENSES, L.L.C.)
KCCL-FM (101.9 FM; SHINGLE SPRINGS, CA; Owner: ENTRAVISION HOLDINGS, LLC)
TV broadcast stations around Citrus Heights:
K22FR (Channel 22; SACRAMENTO, CA; Owner: NATIONAL MINORITY T.V., INC.)
KMMK-LP (Channel 14; SACRAMENTO, CA; Owner: CABALLERO TELEVISION TEXAS, L.L.C.)
K27EU (Channel 27; SACRAMENTO, CA; Owner: ABUNDANT LIFE BROADCASTING, INC.)
KEZT-CA (Channel 23; SACRAMENTO, CA; Owner: TELEFUTURA SACRAMENTO LLC)
KCSO-LP (Channel 33; SACRAMENTO, CA; Owner: SAINTE 51, L.P.)
K17EH (Channel 17; EUREKA, CA; Owner: MS COMMUNICATIONS, LLC)
K69FB (Channel 69; SACRAMENTO, CA; Owner: TRINITY BROADCASTING NETWORK)
KSAO-LP (Channel 49; SACRAMENTO, CA; Owner: GARY M. COCOLA FAMILY TRUST, GARY M. COCOLA TRUSTEE)
KBTV-LP (Channel 8; SACRAMENTO, CA; Owner: INCISOR COMMUNICATIONS, L.L.C.)
KSPX (Channel 29; SACRAMENTO, CA; Owner: PAXSON SACRAMENTO LICENSE, INC.)
KTXL (Channel 40; SACRAMENTO, CA; Owner: CHANNEL 40, INC.)
KMUM-CA (Channel 15; SACRAMENTO, CA; Owner: CABALLERO TELEVISION TEXAS, L.L.C.)
KQCA (Channel 58; STOCKTON, CA; Owner: KCRA HEARST-ARGYLE TELEVISION, INC.)
KCRA-TV (Channel 3; SACRAMENTO, CA; Owner: KCRA HEARST-ARGYLE TELEVISION, INC.)
KVIE (Channel 6; SACRAMENTO, CA; Owner: KVIE, INC.)
KOVR (Channel 13; STOCKTON, CA; Owner: SCI - SACRAMENTO LICENSEE, LLC)
KXTV (Channel 10; SACRAMENTO, CA; Owner: KXTV, INC.)
KMAX-TV (Channel 31; SACRAMENTO, CA; Owner: UPN STATIONS GROUP INC.)
KUVS (Channel 19; MODESTO, CA; Owner: KUVS LICENSE PARTNERSHIP, G.P.)
K27FX (Channel 27; EUREKA, CA; Owner: MS COMMUNICATIONS, LLC)
KRJR-LP (Channel 47; SACRAMENTO, CA; Owner: WORD OF GOD FELLOWSHIP, INC.)
K61DW (Channel 61; SACRAMENTO, CA; Owner: DR. W. R. PORTEE)
KGTN-LP (Channel 62; PLACERVILLE, CA; Owner: PRAISE THE LORD STUDIO CHAPEL)
KSTV-LP (Channel 60; SACRAMENTO, CA; Owner: GARY M. COCOLA FAMILY TRUST, GARY M. COCOLA TRUSTEE)
National Bridge Inventory (NBI) Statistics 41 Number of bridges243ft / 73.6m Total length $283,000 Total costs764,526 Total average daily traffic41,098 Total average daily truck traffic
New bridges - historical statistics
4 1920-1929 1 1950-1959 15 1960-1969 11 1970-1979 7 1980-1989 3 2000-2009
See full National Bridge Inventory statistics for Citrus Heights, CA
Home Mortgage Disclosure Act Aggregated Statistics For Year 2009(Based on 17 full and 5 partial tracts) A) FHA, FSA/RHS & VA B) Conventional C) Refinancings D) Home Improvement Loans E) Loans on Dwellings For 5+ Families F) Non-occupant Loans on G) Loans On Manufactured Number Average Value Number Average Value Number Average Value Number Average Value Number Average Value Number Average Value Number Average Value
LOANS ORIGINATED 547 $184,518 352 $132,069 876 $171,920 39 $106,535 3 $3,694,520 169 $121,516 12 $49,167 APPLICATIONS APPROVED, NOT ACCEPTED 52 $182,949 30 $136,166 107 $181,260 12 $73,063 0 $0 25 $132,646 3 $136,000 APPLICATIONS DENIED 99 $170,572 83 $133,498 355 $187,367 50 $59,409 1 $3,280,680 61 $98,170 15 $45,743 APPLICATIONS WITHDRAWN 77 $177,588 69 $129,706 278 $185,439 22 $116,266 0 $0 44 $116,139 0 $0 FILES CLOSED FOR INCOMPLETENESS 12 $213,775 14 $176,265 52 $199,730 1 $20,000 0 $0 8 $149,022 0 $0
Aggregated Statistics For Year 2008(Based on 17 full and 5 partial tracts) A) FHA, FSA/RHS & VA B) Conventional C) Refinancings D) Home Improvement Loans E) Loans on Dwellings For 5+ Families F) Non-occupant Loans on G) Loans On Manufactured Number Average Value Number Average Value Number Average Value Number Average Value Number Average Value Number Average Value Number Average Value
LOANS ORIGINATED 431 $201,207 533 $159,472 643 $173,844 128 $66,793 3 $4,841,667 248 $145,256 26 $71,342 APPLICATIONS APPROVED, NOT ACCEPTED 41 $216,219 104 $171,865 138 $207,038 26 $29,959 0 $0 48 $161,141 19 $79,431 APPLICATIONS DENIED 84 $202,164 167 $193,277 563 $225,445 141 $84,241 0 $0 93 $178,191 24 $68,790 APPLICATIONS WITHDRAWN 71 $198,950 101 $170,291 209 $214,788 29 $143,869 1 $187,380 53 $154,977 1 $233,000 FILES CLOSED FOR INCOMPLETENESS 10 $189,482 23 $205,650 54 $225,575 9 $92,480 0 $0 6 $226,722 0 $0
Aggregated Statistics For Year 2007(Based on 17 full and 5 partial tracts) A) FHA, FSA/RHS & VA B) Conventional C) Refinancings D) Home Improvement Loans E) Loans on Dwellings For 5+ Families F) Non-occupant Loans on G) Loans On Manufactured Number Average Value Number Average Value Number Average Value Number Average Value Number Average Value Number Average Value Number Average Value
LOANS ORIGINATED 44 $256,964 822 $206,440 1,642 $205,866 315 $107,675 9 $4,420,918 310 $199,556 28 $73,139 APPLICATIONS APPROVED, NOT ACCEPTED 2 $228,305 149 $191,814 378 $227,982 54 $95,412 0 $0 67 $225,525 10 $74,762 APPLICATIONS DENIED 4 $252,598 308 $221,113 1,428 $262,675 226 $114,998 1 $156,000 141 $241,413 29 $101,813 APPLICATIONS WITHDRAWN 5 $237,612 122 $201,574 579 $239,736 68 $140,062 0 $0 67 $201,380 2 $147,460 FILES CLOSED FOR INCOMPLETENESS 0 $0 38 $204,103 179 $266,407 18 $163,512 0 $0 23 $239,546 0 $0
Aggregated Statistics For Year 2006(Based on 17 full and 5 partial tracts) A) FHA, FSA/RHS & VA B) Conventional C) Refinancings D) Home Improvement Loans E) Loans on Dwellings For 5+ Families F) Non-occupant Loans on G) Loans On Manufactured Number Average Value Number Average Value Number Average Value Number Average Value Number Average Value Number Average Value Number Average Value
LOANS ORIGINATED 11 $279,605 1,425 $196,105 3,009 $213,684 533 $114,104 10 $7,046,918 435 $224,788 32 $82,536 APPLICATIONS APPROVED, NOT ACCEPTED 0 $0 268 $187,638 589 $227,747 86 $117,257 0 $0 95 $217,680 12 $89,918 APPLICATIONS DENIED 1 $413,790 474 $199,181 1,516 $239,037 300 $127,210 1 $539,000 160 $234,484 28 $112,515 APPLICATIONS WITHDRAWN 1 $413,840 272 $204,008 1,088 $239,959 111 $146,268 2 $173,500 94 $216,291 2 $67,500 FILES CLOSED FOR INCOMPLETENESS 2 $319,500 60 $209,150 259 $250,937 14 $137,651 0 $0 17 $253,830 1 $98,000
Aggregated Statistics For Year 2005(Based on 17 full and 5 partial tracts) A) FHA, FSA/RHS & VA B) Conventional C) Refinancings D) Home Improvement Loans E) Loans on Dwellings For 5+ Families F) Non-occupant Loans on G) Loans On Manufactured Number Average Value Number Average Value Number Average Value Number Average Value Number Average Value Number Average Value Number Average Value
LOANS ORIGINATED 16 $238,932 2,413 $211,425 4,439 $217,684 640 $129,354 10 $6,640,246 689 $227,335 39 $97,456 APPLICATIONS APPROVED, NOT ACCEPTED 1 $125,000 389 $204,146 594 $222,520 81 $135,621 0 $0 79 $225,009 17 $81,973 APPLICATIONS DENIED 3 $168,667 586 $212,510 1,518 $236,484 354 $121,513 0 $0 178 $247,613 41 $76,389 APPLICATIONS WITHDRAWN 3 $218,073 420 $213,274 1,367 $227,871 170 $168,477 0 $0 133 $230,372 9 $178,599 FILES CLOSED FOR INCOMPLETENESS 0 $0 96 $208,790 424 $229,671 21 $168,942 0 $0 23 $215,245 1 $224,000
Aggregated Statistics For Year 2004(Based on 17 full and 5 partial tracts) A) FHA, FSA/RHS & VA B) Conventional C) Refinancings D) Home Improvement Loans E) Loans on Dwellings For 5+ Families F) Non-occupant Loans on G) Loans On Manufactured Number Average Value Number Average Value Number Average Value Number Average Value Number Average Value Number Average Value Number Average Value
LOANS ORIGINATED 40 $215,248 2,567 $183,233 4,698 $182,541 565 $106,054 9 $4,108,320 716 $191,786 51 $57,236 APPLICATIONS APPROVED, NOT ACCEPTED 4 $187,750 319 $174,492 632 $185,772 85 $104,882 0 $0 80 $173,123 20 $75,120 APPLICATIONS DENIED 10 $234,390 589 $180,052 1,378 $190,195 302 $87,357 3 $780,000 164 $197,851 46 $74,671 APPLICATIONS WITHDRAWN 19 $175,466 350 $196,337 1,164 $192,634 135 $119,681 1 $848,000 98 $192,831 3 $194,763 FILES CLOSED FOR INCOMPLETENESS 2 $206,000 72 $196,222 477 $194,417 30 $78,507 0 $0 29 $177,726 1 $152,000
Aggregated Statistics For Year 2003(Based on 17 full and 5 partial tracts) A) FHA, FSA/RHS & VA B) Conventional C) Refinancings D) Home Improvement Loans E) Loans on Dwellings For 5+ Families F) Non-occupant Loans on Number Average Value Number Average Value Number Average Value Number Average Value Number Average Value Number Average Value
LOANS ORIGINATED 305 $190,202 1,871 $154,688 6,999 $147,055 319 $39,770 12 $4,141,727 787 $151,716 APPLICATIONS APPROVED, NOT ACCEPTED 22 $178,322 239 $159,237 861 $149,730 80 $48,118 0 $0 106 $165,799 APPLICATIONS DENIED 32 $185,082 349 $153,382 1,700 $156,381 253 $37,492 0 $0 166 $169,575 APPLICATIONS WITHDRAWN 46 $160,013 244 $155,461 1,519 $157,065 47 $48,045 2 $4,340,700 74 $159,941 FILES CLOSED FOR INCOMPLETENESS 9 $178,556 44 $180,793 227 $160,741 12 $34,506 0 $0 20 $162,406
Aggregated Statistics For Year 2002(Based on 5 full and 1 partial tracts) A) FHA, FSA/RHS & VA B) Conventional C) Refinancings D) Home Improvement Loans E) Loans on Dwellings For 5+ Families F) Non-occupant Loans on Number Average Value Number Average Value Number Average Value Number Average Value Number Average Value Number Average Value
LOANS ORIGINATED 195 $165,996 628 $140,682 2,239 $136,254 121 $42,183 2 $20,825,000 205 $128,872 APPLICATIONS APPROVED, NOT ACCEPTED 7 $159,597 50 $138,675 271 $132,248 30 $25,828 0 $0 15 $124,672 APPLICATIONS DENIED 19 $174,823 93 $157,055 495 $131,815 73 $34,968 0 $0 19 $135,972 APPLICATIONS WITHDRAWN 19 $139,748 78 $133,628 431 $134,877 32 $35,498 1 $1,509,000 24 $133,000 FILES CLOSED FOR INCOMPLETENESS 2 $115,500 23 $123,293 86 $144,175 2 $42,500 1 $1,525,000 8 $105,948
Aggregated Statistics For Year 2001(Based on 5 full and 1 partial tracts) A) FHA, FSA/RHS & VA B) Conventional C) Refinancings D) Home Improvement Loans E) Loans on Dwellings For 5+ Families F) Non-occupant Loans on Number Average Value Number Average Value Number Average Value Number Average Value Number Average Value Number Average Value
LOANS ORIGINATED 295 $144,092 599 $131,556 1,640 $122,184 72 $32,842 2 $1,854,890 148 $110,841 APPLICATIONS APPROVED, NOT ACCEPTED 18 $134,778 65 $109,978 193 $108,802 12 $26,932 0 $0 14 $96,173 APPLICATIONS DENIED 23 $143,452 101 $118,234 432 $109,632 47 $25,674 0 $0 25 $102,221 APPLICATIONS WITHDRAWN 16 $150,584 103 $128,081 448 $118,874 23 $21,289 0 $0 17 $95,196 FILES CLOSED FOR INCOMPLETENESS 7 $161,891 7 $130,963 90 $114,951 3 $38,333 0 $0 5 $111,600
Aggregated Statistics For Year 2000(Based on 5 full and 1 partial tracts) A) FHA, FSA/RHS & VA B) Conventional C) Refinancings D) Home Improvement Loans E) Loans on Dwellings For 5+ Families F) Non-occupant Loans on Number Average Value Number Average Value Number Average Value Number Average Value Number Average Value Number Average Value
LOANS ORIGINATED 359 $126,901 437 $105,432 304 $85,284 89 $30,938 0 $0 59 $98,191 APPLICATIONS APPROVED, NOT ACCEPTED 15 $106,571 46 $107,484 83 $98,223 44 $27,680 0 $0 2 $70,000 APPLICATIONS DENIED 30 $139,078 92 $95,793 247 $88,083 92 $24,108 2 $110,790 14 $85,539 APPLICATIONS WITHDRAWN 34 $136,772 77 $121,874 109 $74,564 13 $36,205 1 $142,000 6 $65,502 FILES CLOSED FOR INCOMPLETENESS 3 $154,000 12 $98,250 42 $102,784 4 $20,750 0 $0 3 $129,000
Aggregated Statistics For Year 1999(Based on 7 full and 8 partial tracts) A) FHA, FSA/RHS & VA B) Conventional C) Refinancings D) Home Improvement Loans E) Loans on Dwellings For 5+ Families F) Non-occupant Loans on Number Average Value Number Average Value Number Average Value Number Average Value Number Average Value Number Average Value
LOANS ORIGINATED 713 $117,326 851 $94,745 1,379 $93,547 205 $39,526 21 $1,365,899 241 $87,018 APPLICATIONS APPROVED, NOT ACCEPTED 30 $123,332 67 $103,165 302 $99,185 102 $22,145 2 $117,770 23 $87,748 APPLICATIONS DENIED 72 $118,345 184 $87,758 737 $80,386 191 $24,196 2 $382,860 62 $92,441 APPLICATIONS WITHDRAWN 60 $115,569 141 $99,430 462 $89,902 18 $32,300 3 $115,887 35 $83,168 FILES CLOSED FOR INCOMPLETENESS 2 $160,705 20 $95,481 174 $103,138 5 $29,162 2 $612,085 11 $80,762
Detailed mortgage data for all 22 tracts in Citrus Heights, CA
Private Mortgage Insurance Companies Aggregated Statistics For Year 2009(Based on 16 full and 5 partial tracts) A) Conventional B) Refinancings C) Non-occupant Loans on Number Average Value Number Average Value Number Average Value
LOANS ORIGINATED 49 $162,708 6 $202,217 2 $145,000 APPLICATIONS APPROVED, NOT ACCEPTED 18 $213,696 4 $189,270 2 $226,500 APPLICATIONS DENIED 8 $181,371 1 $310,570 0 $0 APPLICATIONS WITHDRAWN 0 $0 0 $0 0 $0 FILES CLOSED FOR INCOMPLETENESS 0 $0 0 $0 0 $0
Aggregated Statistics For Year 2008(Based on 17 full and 5 partial tracts) A) Conventional B) Refinancings C) Non-occupant Loans on Number Average Value Number Average Value Number Average Value
LOANS ORIGINATED 167 $210,861 49 $243,865 15 $174,653 APPLICATIONS APPROVED, NOT ACCEPTED 62 $252,699 46 $278,884 8 $219,882 APPLICATIONS DENIED 28 $239,131 5 $251,468 8 $243,799 APPLICATIONS WITHDRAWN 4 $290,192 3 $285,733 0 $0 FILES CLOSED FOR INCOMPLETENESS 4 $254,450 1 $256,000 2 $303,000
Aggregated Statistics For Year 2007(Based on 17 full and 5 partial tracts) A) Conventional B) Refinancings C) Non-occupant Loans on D) Loans On Manufactured Number Average Value Number Average Value Number Average Value Number Average Value
LOANS ORIGINATED 197 $273,293 110 $304,680 18 $250,859 0 $0 APPLICATIONS APPROVED, NOT ACCEPTED 15 $308,979 31 $302,352 1 $243,000 0 $0 APPLICATIONS DENIED 6 $299,883 7 $289,579 2 $267,850 1 $253,000 APPLICATIONS WITHDRAWN 7 $298,686 9 $280,777 1 $133,920 0 $0 FILES CLOSED FOR INCOMPLETENESS 1 $192,240 1 $427,190 0 $0 0 $0
Aggregated Statistics For Year 2006(Based on 16 full and 5 partial tracts) A) Conventional B) Refinancings C) Non-occupant Loans on Number Average Value Number Average Value Number Average Value
LOANS ORIGINATED 39 $310,397 60 $326,497 5 $269,022 APPLICATIONS APPROVED, NOT ACCEPTED 5 $357,170 12 $289,861 1 $233,850 APPLICATIONS DENIED 2 $353,225 2 $333,745 0 $0 APPLICATIONS WITHDRAWN 4 $337,000 7 $326,699 1 $270,000 FILES CLOSED FOR INCOMPLETENESS 1 $314,000 0 $0 0 $0
Aggregated Statistics For Year 2005(Based on 17 full and 5 partial tracts) A) Conventional B) Refinancings C) Non-occupant Loans on Number Average Value Number Average Value Number Average Value
LOANS ORIGINATED 82 $305,585 64 $291,453 13 $281,492 APPLICATIONS APPROVED, NOT ACCEPTED 13 $289,886 16 $267,450 1 $206,000 APPLICATIONS DENIED 1 $453,670 3 $267,847 1 $226,830 APPLICATIONS WITHDRAWN 4 $220,750 6 $270,803 3 $262,000 FILES CLOSED FOR INCOMPLETENESS 1 $356,640 1 $181,720 1 $181,720
Aggregated Statistics For Year 2004(Based on 17 full and 5 partial tracts) A) Conventional B) Refinancings C) Non-occupant Loans on Number Average Value Number Average Value Number Average Value
LOANS ORIGINATED 118 $255,015 113 $230,096 27 $236,144 APPLICATIONS APPROVED, NOT ACCEPTED 35 $236,125 58 $206,153 8 $231,476 APPLICATIONS DENIED 1 $131,000 3 $276,997 2 $231,000 APPLICATIONS WITHDRAWN 6 $210,772 14 $206,072 3 $169,123 FILES CLOSED FOR INCOMPLETENESS 0 $0 2 $187,500 0 $0
Aggregated Statistics For Year 2003(Based on 17 full and 5 partial tracts) A) Conventional B) Refinancings C) Non-occupant Loans on Number Average Value Number Average Value Number Average Value
LOANS ORIGINATED 268 $210,609 278 $188,832 42 $184,867 APPLICATIONS APPROVED, NOT ACCEPTED 46 $204,854 104 $185,397 12 $188,766 APPLICATIONS DENIED 2 $174,500 6 $223,995 1 $211,000 APPLICATIONS WITHDRAWN 7 $194,126 7 $185,163 3 $175,847 FILES CLOSED FOR INCOMPLETENESS 1 $132,840 2 $138,500 0 $0
Aggregated Statistics For Year 2002(Based on 5 full and 1 partial tracts) A) Conventional B) Refinancings C) Non-occupant Loans on Number Average Value Number Average Value Number Average Value
LOANS ORIGINATED 145 $180,579 143 $173,627 15 $166,799 APPLICATIONS APPROVED, NOT ACCEPTED 15 $172,807 39 $170,749 2 $162,500 APPLICATIONS DENIED 5 $196,000 5 $175,724 3 $131,333 APPLICATIONS WITHDRAWN 7 $161,029 15 $153,505 2 $130,000 FILES CLOSED FOR INCOMPLETENESS 0 $0 0 $0 0 $0
Aggregated Statistics For Year 2001(Based on 5 full and 1 partial tracts) A) Conventional B) Refinancings C) Non-occupant Loans on Number Average Value Number Average Value Number Average Value
LOANS ORIGINATED 158 $156,132 137 $153,919 15 $128,183 APPLICATIONS APPROVED, NOT ACCEPTED 15 $144,186 22 $167,082 4 $148,500 APPLICATIONS DENIED 3 $204,860 1 $248,860 1 $281,700 APPLICATIONS WITHDRAWN 4 $154,165 4 $136,070 0 $0 FILES CLOSED FOR INCOMPLETENESS 1 $84,660 1 $149,000 1 $84,660
Aggregated Statistics For Year 2000(Based on 5 full and 1 partial tracts) A) Conventional B) Refinancings C) Non-occupant Loans on Number Average Value Number Average Value Number Average Value
LOANS ORIGINATED 109 $133,321 30 $118,159 17 $114,528 APPLICATIONS APPROVED, NOT ACCEPTED 10 $138,000 9 $131,779 0 $0 APPLICATIONS DENIED 5 $134,132 1 $85,390 1 $84,660 APPLICATIONS WITHDRAWN 3 $168,667 0 $0 0 $0 FILES CLOSED FOR INCOMPLETENESS 1 $180,000 1 $155,000 0 $0
Aggregated Statistics For Year 1999(Based on 7 full and 8 partial tracts) A) Conventional B) Refinancings C) Non-occupant Loans on Number Average Value Number Average Value Number Average Value
LOANS ORIGINATED 222 $125,459 185 $123,273 23 $94,315 APPLICATIONS APPROVED, NOT ACCEPTED 21 $122,392 34 $121,467 5 $77,394 APPLICATIONS DENIED 13 $108,225 7 $97,749 3 $98,333 APPLICATIONS WITHDRAWN 6 $104,180 5 $107,376 1 $133,000 FILES CLOSED FOR INCOMPLETENESS 6 $102,590 5 $106,480 0 $0
Most common first names in Citrus Heights, CA among deceased individuals Name Count Lived (average)
John 359 74.2 years William 319 74.2 years Robert 305 70.6 years Mary 271 78.5 years James 245 71.1 years Charles 187 74.9 years Helen 175 79.9 years Dorothy 173 78.9 years George 152 77.0 years Richard 151 68.2 years
Most common last names in Citrus Heights, CA among deceased individuals Last name Count Lived (average)
Smith 117 73.8 years Johnson 99 75.1 years Miller 82 78.5 years Brown 74 72.8 years Williams 65 72.2 years Davis 59 73.4 years Jones 59 74.8 years Wilson 54 74.5 years Anderson 51 76.6 years Thomas 39 78.7 years
Citrus Heights compared to California state average:
Median house value below state average. Unemployed percentage significantly below state average. Hispanic race population percentage below state average. Median age above state average. Foreign-born population percentage below state average. Citrus Heights on our top lists :
#13 on the list of "Top 101 cities with the highest maximum monthly sunshine amount (population 50,000+)"
#30 on the list of "Top 101 cities with the largest sunshine amount differences during a year (population 50,000+)"
#35 on the list of "Top 101 cities with largest percentage of males in occupations: installation, maintenance, and repair occupations (population 50,000+)"
#43 on the list of "Top 101 cities that people commute from (largest negative percentage daily daytime population change due to commuting) (population 50,000+)"
#50 on the list of "Top 101 cities with largest percentage of females in industries: administrative and support and waste management services (population 50,000+)"
#51 on the list of "Top 101 cities with largest percentage of females in industries: finance and insurance (population 50,000+)"
#55 on the list of "Top 101 cities with largest percentage of females in occupations: office and administrative support occupations (population 50,000+)"
#56 on the list of "Top 101 cities with largest percentage of males in industries: retail trade (population 50,000+)"
#60 on the list of "Top 101 cities with the highest number of days clear of clouds (population 50,000+)"
#60 on the list of "Top 101 cities with the lowest number of days clear of clouds (population 50,000+)"
#62 on the list of "Top 101 cities with the most residents born in Ukraine (population 500+)"
#63 on the list of "Top 101 cities with largest percentage of females in occupations: material moving occupations (population 50,000+)"
#63 on the list of "Top 101 cities with the largest city-data.com crime index per police officer (population 50,000+)"
#64 on the list of "Top 101 cities with largest percentage of females in occupations: fire fighting and prevention workers including supervisors (population 50,000+)"
#64 on the list of "Top 101 cities with largest percentage of males in industries: arts, entertainment, and recreation (population 50,000+)"
#66 on the list of "Top 101 cities with largest percentage of males in occupations: building and grounds cleaning and maintenance occupations (population 50,000+)"
#67 on the list of "Top 101 cities with the lowest number of police officers per 1000 residents (population 50,000+)"
#68 on the list of "Top 101 cities with the largest differences between morning and afternoon humidity (population 50,000+)"
#68 on the list of "Top 101 cities with the largest humidity differences during a year (population 50,000+)"
#74 on the list of "Top 101 cities with largest percentage of females in industries: construction (population 50,000+)"
#71 (95610) on the list of "Top 101 zip codes with the largest percentage of Ukrainian first ancestries (pop 5,000+)"
#12 on the list of "Top 101 counties with the highest percentage of residents that drank alcohol in the past 30 days"
#18 on the list of "Top 101 counties with the highest ground withdrawal of fresh water for public supply"
#19 on the list of "Top 101 counties with the highest total withdrawal of fresh water for public supply"
#23 on the list of "Top 101 counties with the most Other adherents"
#25 on the list of "Top 101 counties with the most Other congregations (pop. 50,000+)"
Top Patent Applicants
Edward Milton Mcwhorter (13)
Ruxandra Vidu (10)
Jay William Sales (8)
Robert Milstrey (7)
Juha K. Salmela (7)
Ricardo Gonzalez (5)
David Cho (3)
Olivier Dapremont (3)
Cheryl Lynn Hoffman (3)
Glen Thomson (3)
Total of 121 patent applications in 2008-2024.
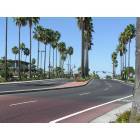
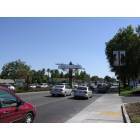


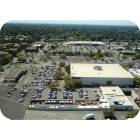
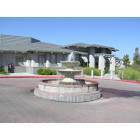
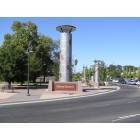
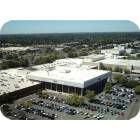
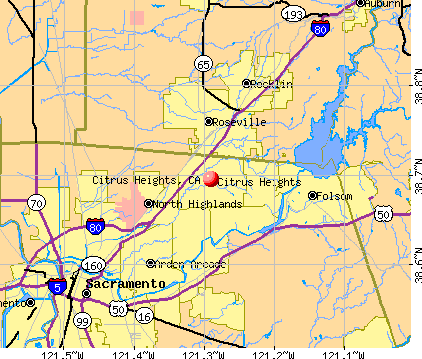


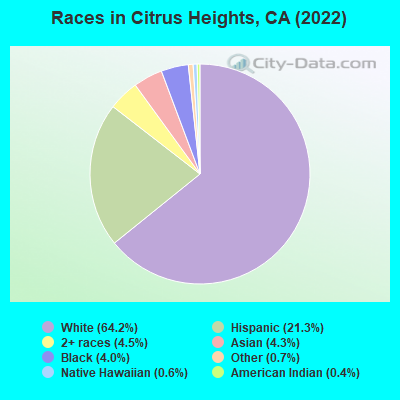
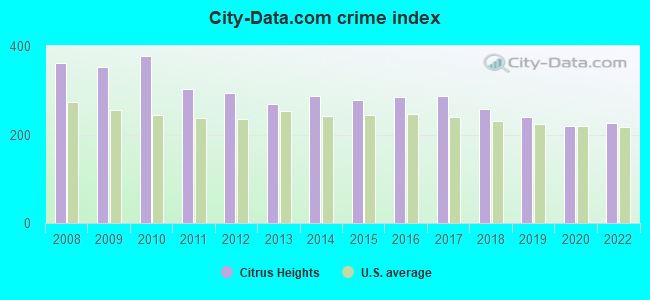
 Recent articles from our blog. Our writers, many of them Ph.D. graduates or candidates, create easy-to-read articles on a wide variety of topics.

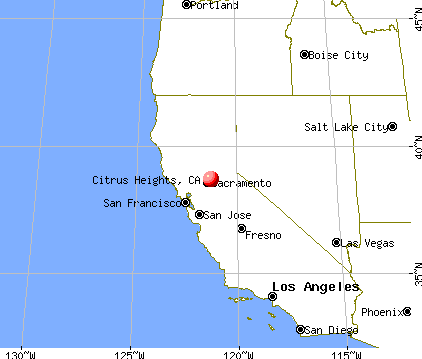
 (13.6 miles
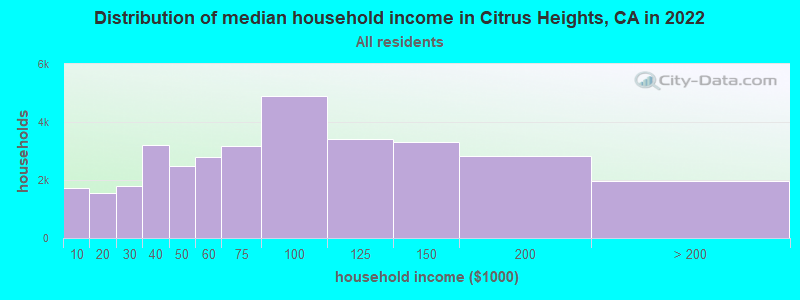
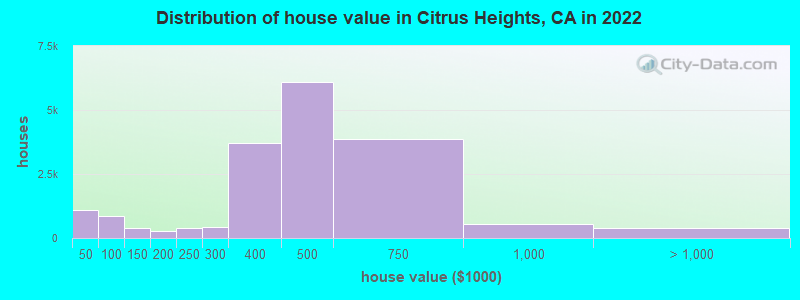
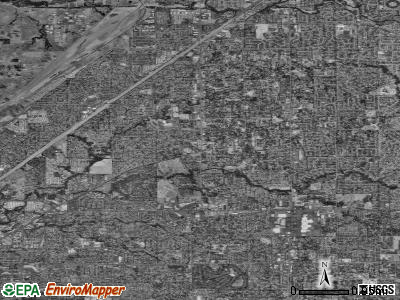
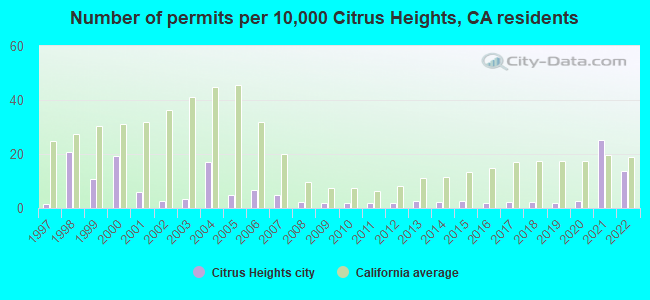
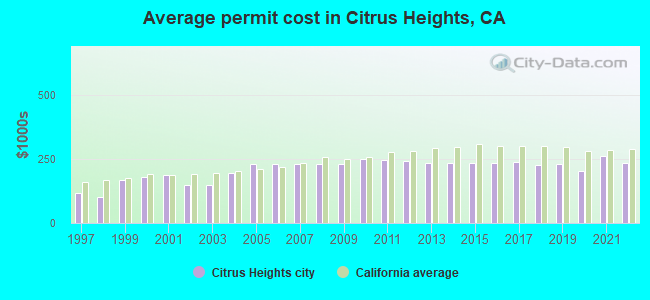
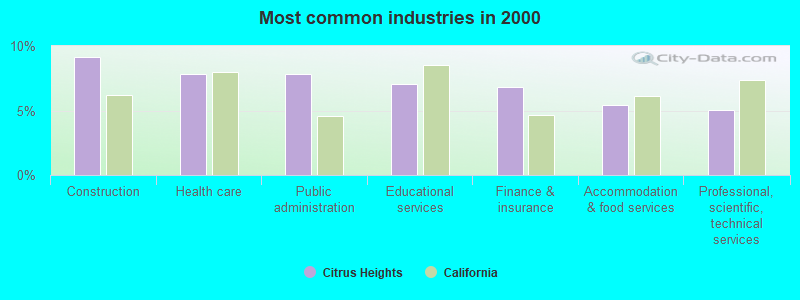
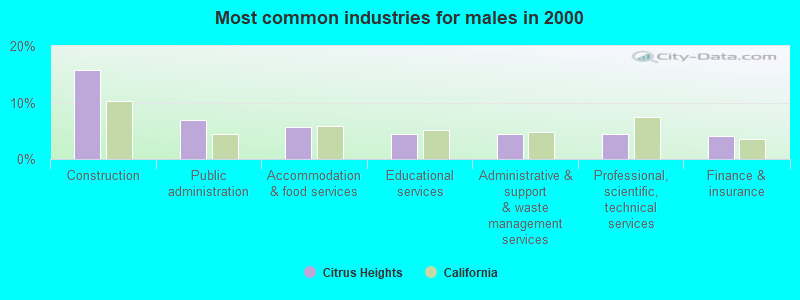
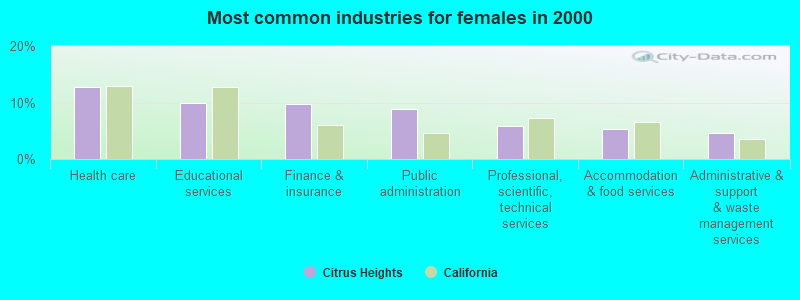
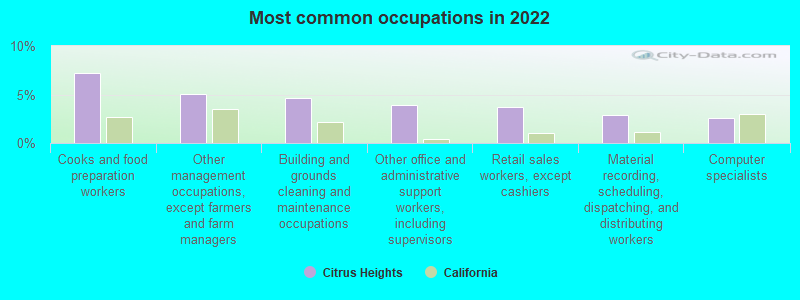
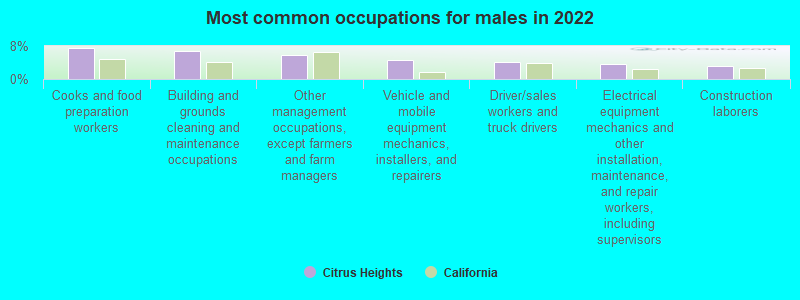
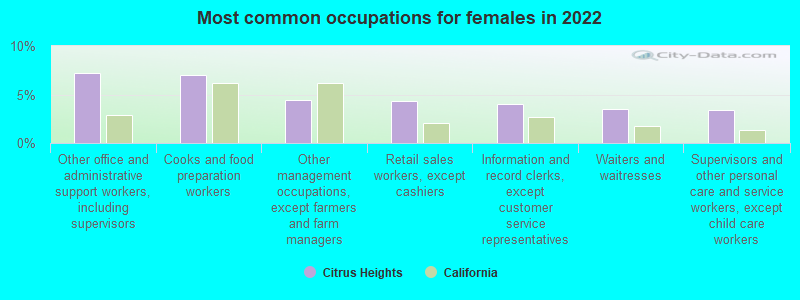


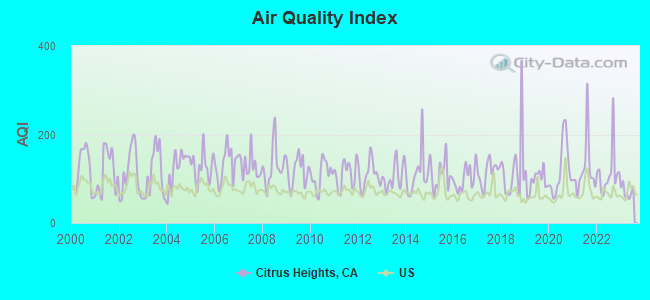
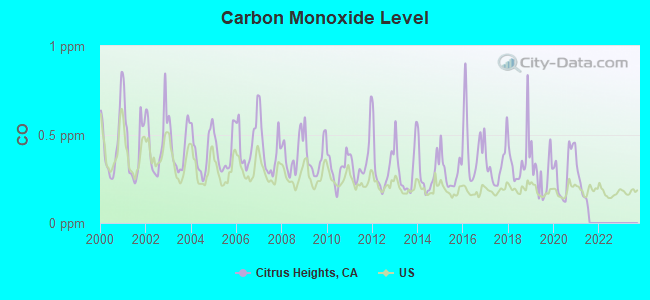
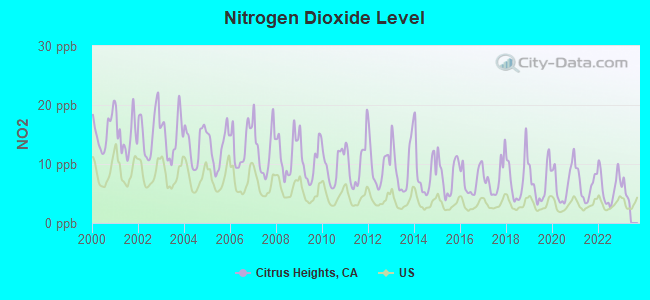
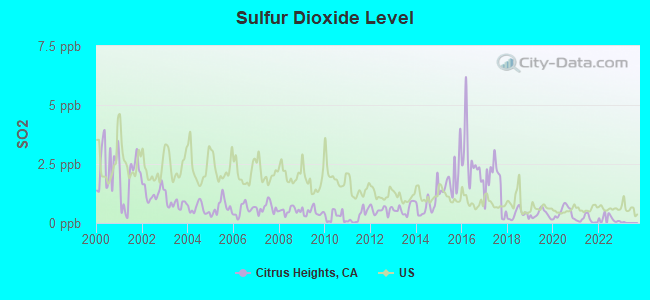
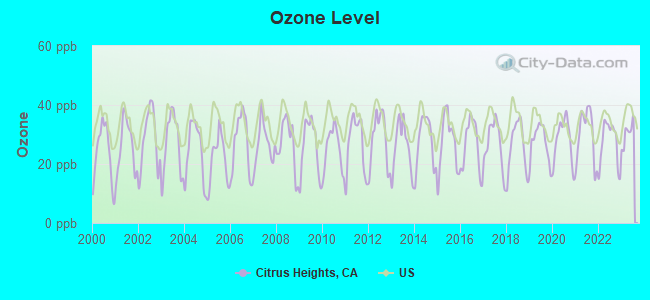
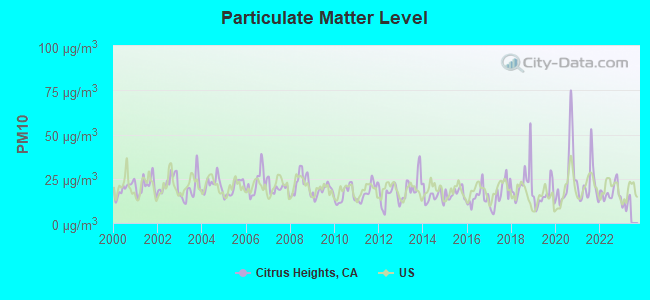
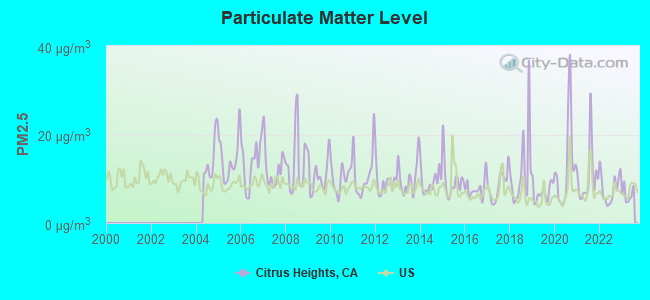
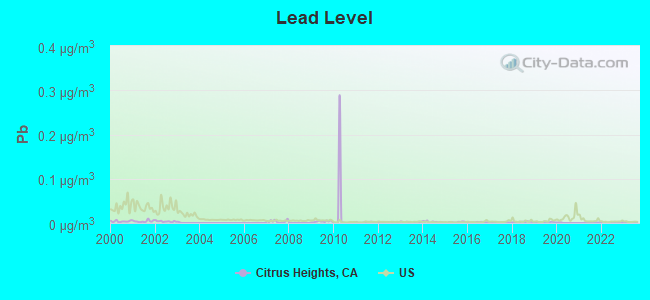

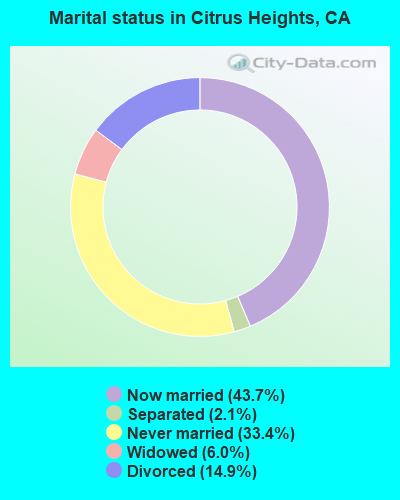
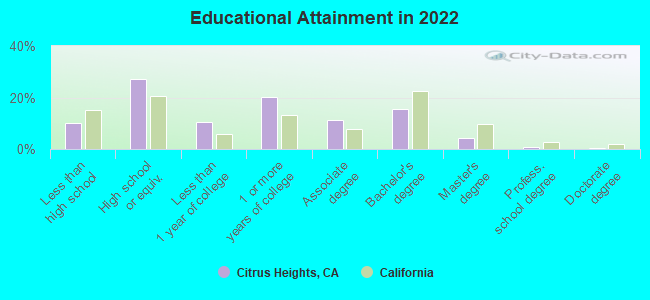
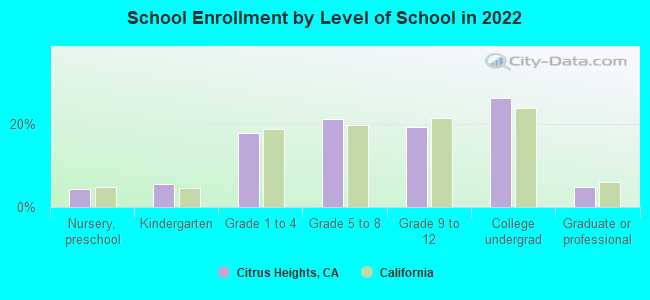
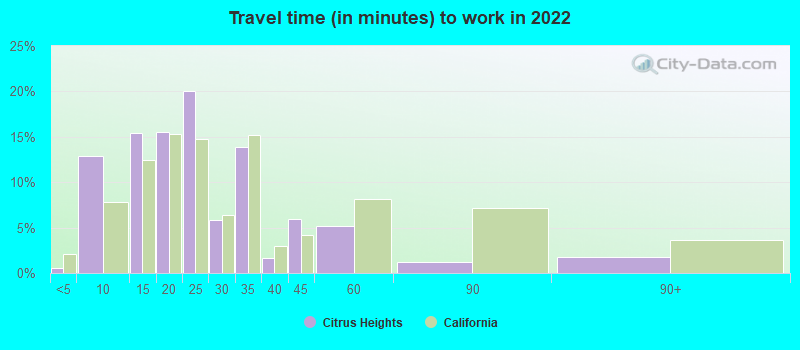
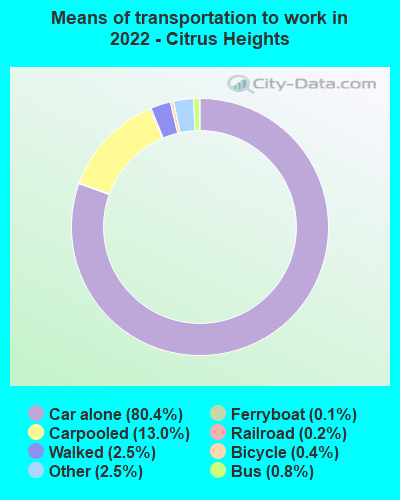
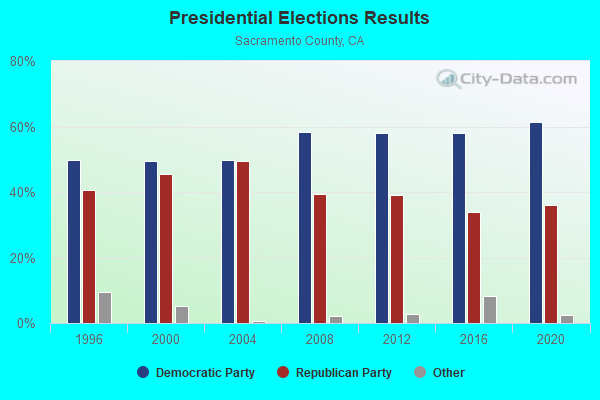
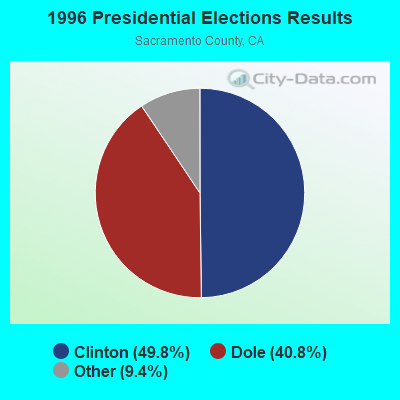
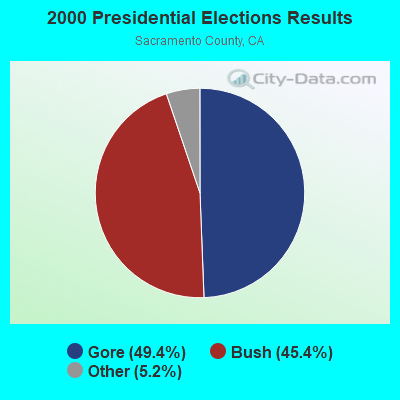
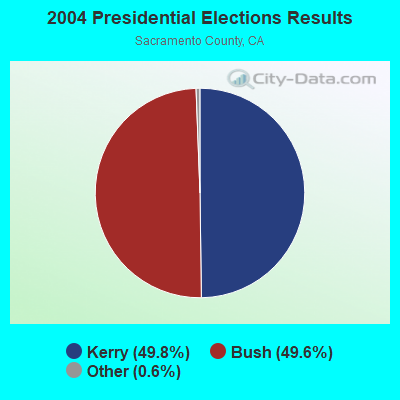
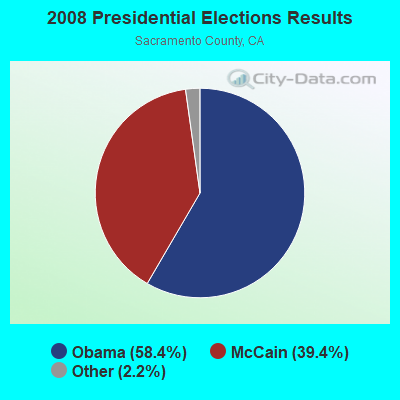
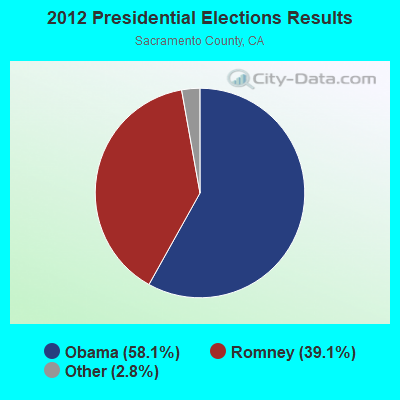
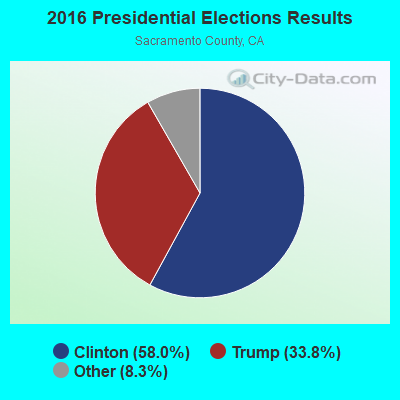
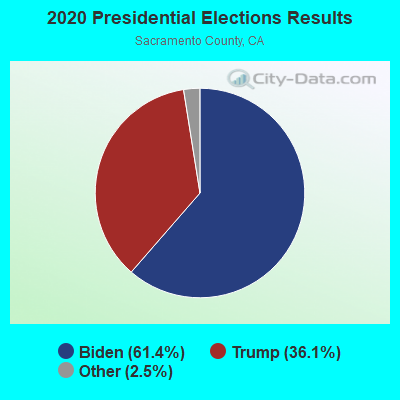
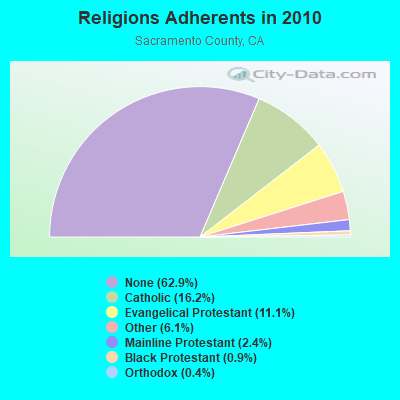
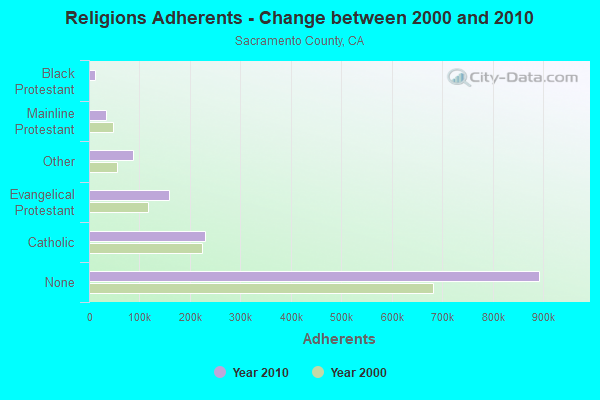
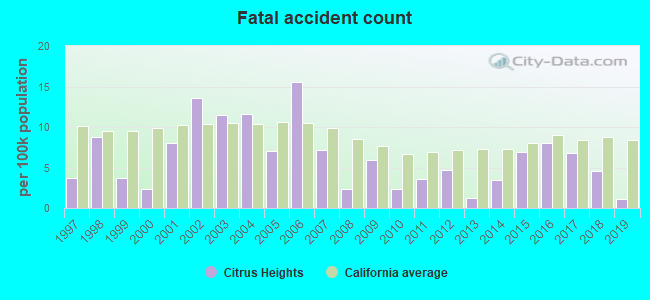
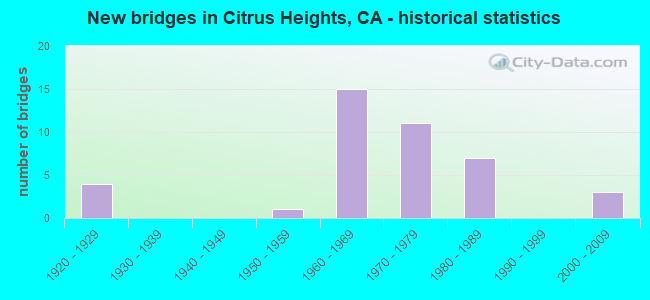
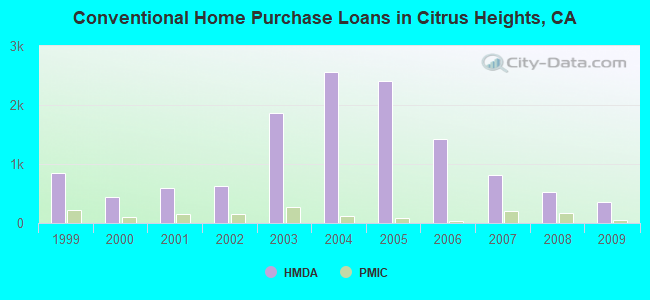
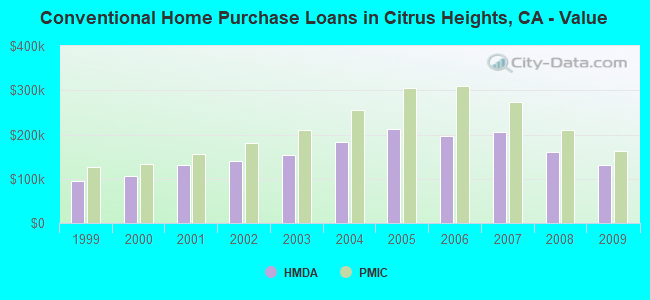
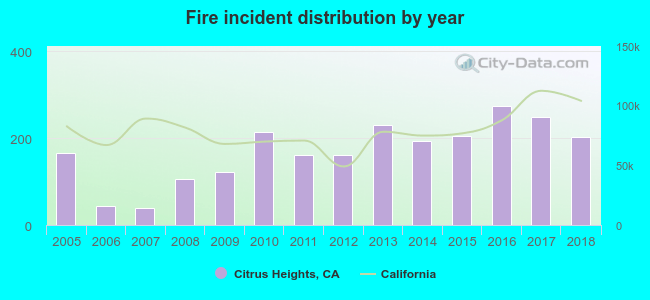 According to the data from the years 2005 - 2018 the average number of fires per year is 170. The highest number of reported fires - 275 took place in 2016, and the least - 39 in 2007. The data has a rising trend.
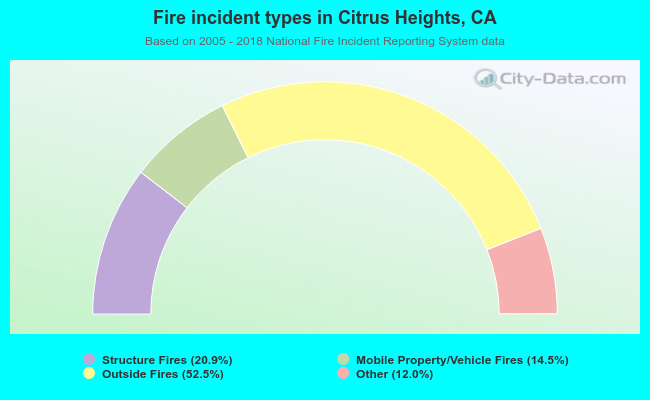 When looking into fire subcategories, the most reports belonged to: Outside Fires (52.5%), and Structure Fires (20.9%).