Fair Oaks, California Submit your own pictures of this place and show them to the world
OSM Map
General Map
Google Map
MSN Map
OSM Map
General Map
Google Map
MSN Map
OSM Map
General Map
Google Map
MSN Map
OSM Map
General Map
Google Map
MSN Map
Please wait while loading the map...
Population in 2010: 30,912. Population change since 2000: +10.4%Males: 15,252 Females: 15,660
March 2022 cost of living index in Fair Oaks: 103.4 (near average, U.S. average is 100) Percentage of residents living in poverty in 2022: 8.2%for White Non-Hispanic residents , 22.0% for Black residents , 12.2% for Hispanic or Latino residents , 11.8% for American Indian residents , 100.0% for Native Hawaiian and other Pacific Islander residents , 29.9% for other race residents , 3.5% for two or more races residents )
Profiles of local businesses
Business Search - 14 Million verified businesses
Data:
Median household income ($)
Median household income (% change since 2000)
Household income diversity
Ratio of average income to average house value (%)
Ratio of average income to average rent
Median household income ($) - White
Median household income ($) - Black or African American
Median household income ($) - Asian
Median household income ($) - Hispanic or Latino
Median household income ($) - American Indian and Alaska Native
Median household income ($) - Multirace
Median household income ($) - Other Race
Median household income for houses/condos with a mortgage ($)
Median household income for apartments without a mortgage ($)
Races - White alone (%)
Races - White alone (% change since 2000)
Races - Black alone (%)
Races - Black alone (% change since 2000)
Races - American Indian alone (%)
Races - American Indian alone (% change since 2000)
Races - Asian alone (%)
Races - Asian alone (% change since 2000)
Races - Hispanic (%)
Races - Hispanic (% change since 2000)
Races - Native Hawaiian and Other Pacific Islander alone (%)
Races - Native Hawaiian and Other Pacific Islander alone (% change since 2000)
Races - Two or more races (%)
Races - Two or more races (% change since 2000)
Races - Other race alone (%)
Races - Other race alone (% change since 2000)
Racial diversity
Unemployment (%)
Unemployment (% change since 2000)
Unemployment (%) - White
Unemployment (%) - Black or African American
Unemployment (%) - Asian
Unemployment (%) - Hispanic or Latino
Unemployment (%) - American Indian and Alaska Native
Unemployment (%) - Multirace
Unemployment (%) - Other Race
Population density (people per square mile)
Population - Males (%)
Population - Females (%)
Population - Males (%) - White
Population - Males (%) - Black or African American
Population - Males (%) - Asian
Population - Males (%) - Hispanic or Latino
Population - Males (%) - American Indian and Alaska Native
Population - Males (%) - Multirace
Population - Males (%) - Other Race
Population - Females (%) - White
Population - Females (%) - Black or African American
Population - Females (%) - Asian
Population - Females (%) - Hispanic or Latino
Population - Females (%) - American Indian and Alaska Native
Population - Females (%) - Multirace
Population - Females (%) - Other Race
Coronavirus confirmed cases (Apr 27, 2024)
Deaths caused by coronavirus (Apr 27, 2024)
Coronavirus confirmed cases (per 100k population) (Apr 27, 2024)
Deaths caused by coronavirus (per 100k population) (Apr 27, 2024)
Daily increase in number of cases (Apr 27, 2024)
Weekly increase in number of cases (Apr 27, 2024)
Cases doubled (in days) (Apr 27, 2024)
Hospitalized patients (Apr 18, 2022)
Negative test results (Apr 18, 2022)
Total test results (Apr 18, 2022)
COVID Vaccine doses distributed (per 100k population) (Sep 19, 2023)
COVID Vaccine doses administered (per 100k population) (Sep 19, 2023)
COVID Vaccine doses distributed (Sep 19, 2023)
COVID Vaccine doses administered (Sep 19, 2023)
Likely homosexual households (%)
Likely homosexual households (% change since 2000)
Likely homosexual households - Lesbian couples (%)
Likely homosexual households - Lesbian couples (% change since 2000)
Likely homosexual households - Gay men (%)
Likely homosexual households - Gay men (% change since 2000)
Cost of living index
Median gross rent ($)
Median contract rent ($)
Median monthly housing costs ($)
Median house or condo value ($)
Median house or condo value ($ change since 2000)
Mean house or condo value by units in structure - 1, detached ($)
Mean house or condo value by units in structure - 1, attached ($)
Mean house or condo value by units in structure - 2 ($)
Mean house or condo value by units in structure by units in structure - 3 or 4 ($)
Mean house or condo value by units in structure - 5 or more ($)
Mean house or condo value by units in structure - Boat, RV, van, etc. ($)
Mean house or condo value by units in structure - Mobile home ($)
Median house or condo value ($) - White
Median house or condo value ($) - Black or African American
Median house or condo value ($) - Asian
Median house or condo value ($) - Hispanic or Latino
Median house or condo value ($) - American Indian and Alaska Native
Median house or condo value ($) - Multirace
Median house or condo value ($) - Other Race
Median resident age
Resident age diversity
Median resident age - Males
Median resident age - Females
Median resident age - White
Median resident age - Black or African American
Median resident age - Asian
Median resident age - Hispanic or Latino
Median resident age - American Indian and Alaska Native
Median resident age - Multirace
Median resident age - Other Race
Median resident age - Males - White
Median resident age - Males - Black or African American
Median resident age - Males - Asian
Median resident age - Males - Hispanic or Latino
Median resident age - Males - American Indian and Alaska Native
Median resident age - Males - Multirace
Median resident age - Males - Other Race
Median resident age - Females - White
Median resident age - Females - Black or African American
Median resident age - Females - Asian
Median resident age - Females - Hispanic or Latino
Median resident age - Females - American Indian and Alaska Native
Median resident age - Females - Multirace
Median resident age - Females - Other Race
Commute - mean travel time to work (minutes)
Travel time to work - Less than 5 minutes (%)
Travel time to work - Less than 5 minutes (% change since 2000)
Travel time to work - 5 to 9 minutes (%)
Travel time to work - 5 to 9 minutes (% change since 2000)
Travel time to work - 10 to 19 minutes (%)
Travel time to work - 10 to 19 minutes (% change since 2000)
Travel time to work - 20 to 29 minutes (%)
Travel time to work - 20 to 29 minutes (% change since 2000)
Travel time to work - 30 to 39 minutes (%)
Travel time to work - 30 to 39 minutes (% change since 2000)
Travel time to work - 40 to 59 minutes (%)
Travel time to work - 40 to 59 minutes (% change since 2000)
Travel time to work - 60 to 89 minutes (%)
Travel time to work - 60 to 89 minutes (% change since 2000)
Travel time to work - 90 or more minutes (%)
Travel time to work - 90 or more minutes (% change since 2000)
Marital status - Never married (%)
Marital status - Now married (%)
Marital status - Separated (%)
Marital status - Widowed (%)
Marital status - Divorced (%)
Median family income ($)
Median family income (% change since 2000)
Median non-family income ($)
Median non-family income (% change since 2000)
Median per capita income ($)
Median per capita income (% change since 2000)
Median family income ($) - White
Median family income ($) - Black or African American
Median family income ($) - Asian
Median family income ($) - Hispanic or Latino
Median family income ($) - American Indian and Alaska Native
Median family income ($) - Multirace
Median family income ($) - Other Race
Median year house/condo built
Median year apartment built
Year house built - Built 2005 or later (%)
Year house built - Built 2000 to 2004 (%)
Year house built - Built 1990 to 1999 (%)
Year house built - Built 1980 to 1989 (%)
Year house built - Built 1970 to 1979 (%)
Year house built - Built 1960 to 1969 (%)
Year house built - Built 1950 to 1959 (%)
Year house built - Built 1940 to 1949 (%)
Year house built - Built 1939 or earlier (%)
Average household size
Household density (households per square mile)
Average household size - White
Average household size - Black or African American
Average household size - Asian
Average household size - Hispanic or Latino
Average household size - American Indian and Alaska Native
Average household size - Multirace
Average household size - Other Race
Occupied housing units (%)
Vacant housing units (%)
Owner occupied housing units (%)
Renter occupied housing units (%)
Vacancy status - For rent (%)
Vacancy status - For sale only (%)
Vacancy status - Rented or sold, not occupied (%)
Vacancy status - For seasonal, recreational, or occasional use (%)
Vacancy status - For migrant workers (%)
Vacancy status - Other vacant (%)
Residents with income below the poverty level (%)
Residents with income below 50% of the poverty level (%)
Children below poverty level (%)
Poor families by family type - Married-couple family (%)
Poor families by family type - Male, no wife present (%)
Poor families by family type - Female, no husband present (%)
Poverty status for native-born residents (%)
Poverty status for foreign-born residents (%)
Poverty among high school graduates not in families (%)
Poverty among people who did not graduate high school not in families (%)
Residents with income below the poverty level (%) - White
Residents with income below the poverty level (%) - Black or African American
Residents with income below the poverty level (%) - Asian
Residents with income below the poverty level (%) - Hispanic or Latino
Residents with income below the poverty level (%) - American Indian and Alaska Native
Residents with income below the poverty level (%) - Multirace
Residents with income below the poverty level (%) - Other Race
Air pollution - Air Quality Index (AQI)
Air pollution - CO
Air pollution - NO2
Air pollution - SO2
Air pollution - Ozone
Air pollution - PM10
Air pollution - PM25
Air pollution - Pb
Crime - Murders per 100,000 population
Crime - Rapes per 100,000 population
Crime - Robberies per 100,000 population
Crime - Assaults per 100,000 population
Crime - Burglaries per 100,000 population
Crime - Thefts per 100,000 population
Crime - Auto thefts per 100,000 population
Crime - Arson per 100,000 population
Crime - City-data.com crime index
Crime - Violent crime index
Crime - Property crime index
Crime - Murders per 100,000 population (5 year average)
Crime - Rapes per 100,000 population (5 year average)
Crime - Robberies per 100,000 population (5 year average)
Crime - Assaults per 100,000 population (5 year average)
Crime - Burglaries per 100,000 population (5 year average)
Crime - Thefts per 100,000 population (5 year average)
Crime - Auto thefts per 100,000 population (5 year average)
Crime - Arson per 100,000 population (5 year average)
Crime - City-data.com crime index (5 year average)
Crime - Violent crime index (5 year average)
Crime - Property crime index (5 year average)
1996 Presidential Elections Results (%) - Democratic Party (Clinton)
1996 Presidential Elections Results (%) - Republican Party (Dole)
1996 Presidential Elections Results (%) - Other
2000 Presidential Elections Results (%) - Democratic Party (Gore)
2000 Presidential Elections Results (%) - Republican Party (Bush)
2000 Presidential Elections Results (%) - Other
2004 Presidential Elections Results (%) - Democratic Party (Kerry)
2004 Presidential Elections Results (%) - Republican Party (Bush)
2004 Presidential Elections Results (%) - Other
2008 Presidential Elections Results (%) - Democratic Party (Obama)
2008 Presidential Elections Results (%) - Republican Party (McCain)
2008 Presidential Elections Results (%) - Other
2012 Presidential Elections Results (%) - Democratic Party (Obama)
2012 Presidential Elections Results (%) - Republican Party (Romney)
2012 Presidential Elections Results (%) - Other
2016 Presidential Elections Results (%) - Democratic Party (Clinton)
2016 Presidential Elections Results (%) - Republican Party (Trump)
2016 Presidential Elections Results (%) - Other
2020 Presidential Elections Results (%) - Democratic Party (Biden)
2020 Presidential Elections Results (%) - Republican Party (Trump)
2020 Presidential Elections Results (%) - Other
Ancestries Reported - Arab (%)
Ancestries Reported - Czech (%)
Ancestries Reported - Danish (%)
Ancestries Reported - Dutch (%)
Ancestries Reported - English (%)
Ancestries Reported - French (%)
Ancestries Reported - French Canadian (%)
Ancestries Reported - German (%)
Ancestries Reported - Greek (%)
Ancestries Reported - Hungarian (%)
Ancestries Reported - Irish (%)
Ancestries Reported - Italian (%)
Ancestries Reported - Lithuanian (%)
Ancestries Reported - Norwegian (%)
Ancestries Reported - Polish (%)
Ancestries Reported - Portuguese (%)
Ancestries Reported - Russian (%)
Ancestries Reported - Scotch-Irish (%)
Ancestries Reported - Scottish (%)
Ancestries Reported - Slovak (%)
Ancestries Reported - Subsaharan African (%)
Ancestries Reported - Swedish (%)
Ancestries Reported - Swiss (%)
Ancestries Reported - Ukrainian (%)
Ancestries Reported - United States (%)
Ancestries Reported - Welsh (%)
Ancestries Reported - West Indian (%)
Ancestries Reported - Other (%)
Educational Attainment - No schooling completed (%)
Educational Attainment - Less than high school (%)
Educational Attainment - High school or equivalent (%)
Educational Attainment - Less than 1 year of college (%)
Educational Attainment - 1 or more years of college (%)
Educational Attainment - Associate degree (%)
Educational Attainment - Bachelor's degree (%)
Educational Attainment - Master's degree (%)
Educational Attainment - Professional school degree (%)
Educational Attainment - Doctorate degree (%)
School Enrollment - Nursery, preschool (%)
School Enrollment - Kindergarten (%)
School Enrollment - Grade 1 to 4 (%)
School Enrollment - Grade 5 to 8 (%)
School Enrollment - Grade 9 to 12 (%)
School Enrollment - College undergrad (%)
School Enrollment - Graduate or professional (%)
School Enrollment - Not enrolled in school (%)
School enrollment - Public schools (%)
School enrollment - Private schools (%)
School enrollment - Not enrolled (%)
Median number of rooms in houses and condos
Median number of rooms in apartments
Housing units lacking complete plumbing facilities (%)
Housing units lacking complete kitchen facilities (%)
Density of houses
Urban houses (%)
Rural houses (%)
Households with people 60 years and over (%)
Households with people 65 years and over (%)
Households with people 75 years and over (%)
Households with one or more nonrelatives (%)
Households with no nonrelatives (%)
Population in households (%)
Family households (%)
Nonfamily households (%)
Population in families (%)
Family households with own children (%)
Median number of bedrooms in owner occupied houses
Mean number of bedrooms in owner occupied houses
Median number of bedrooms in renter occupied houses
Mean number of bedrooms in renter occupied houses
Median number of vehichles in owner occupied houses
Mean number of vehichles in owner occupied houses
Median number of vehichles in renter occupied houses
Mean number of vehichles in renter occupied houses
Mortgage status - with mortgage (%)
Mortgage status - with second mortgage (%)
Mortgage status - with home equity loan (%)
Mortgage status - with both second mortgage and home equity loan (%)
Mortgage status - without a mortgage (%)
Average family size
Average family size - White
Average family size - Black or African American
Average family size - Asian
Average family size - Hispanic or Latino
Average family size - American Indian and Alaska Native
Average family size - Multirace
Average family size - Other Race
Geographical mobility - Same house 1 year ago (%)
Geographical mobility - Moved within same county (%)
Geographical mobility - Moved from different county within same state (%)
Geographical mobility - Moved from different state (%)
Geographical mobility - Moved from abroad (%)
Place of birth - Born in state of residence (%)
Place of birth - Born in other state (%)
Place of birth - Native, outside of US (%)
Place of birth - Foreign born (%)
Housing units in structures - 1, detached (%)
Housing units in structures - 1, attached (%)
Housing units in structures - 2 (%)
Housing units in structures - 3 or 4 (%)
Housing units in structures - 5 to 9 (%)
Housing units in structures - 10 to 19 (%)
Housing units in structures - 20 to 49 (%)
Housing units in structures - 50 or more (%)
Housing units in structures - Mobile home (%)
Housing units in structures - Boat, RV, van, etc. (%)
House/condo owner moved in on average (years ago)
Renter moved in on average (years ago)
Year householder moved into unit - Moved in 1999 to March 2000 (%)
Year householder moved into unit - Moved in 1995 to 1998 (%)
Year householder moved into unit - Moved in 1990 to 1994 (%)
Year householder moved into unit - Moved in 1980 to 1989 (%)
Year householder moved into unit - Moved in 1970 to 1979 (%)
Year householder moved into unit - Moved in 1969 or earlier (%)
Means of transportation to work - Drove car alone (%)
Means of transportation to work - Carpooled (%)
Means of transportation to work - Public transportation (%)
Means of transportation to work - Bus or trolley bus (%)
Means of transportation to work - Streetcar or trolley car (%)
Means of transportation to work - Subway or elevated (%)
Means of transportation to work - Railroad (%)
Means of transportation to work - Ferryboat (%)
Means of transportation to work - Taxicab (%)
Means of transportation to work - Motorcycle (%)
Means of transportation to work - Bicycle (%)
Means of transportation to work - Walked (%)
Means of transportation to work - Other means (%)
Working at home (%)
Industry diversity
Most Common Industries - Agriculture, forestry, fishing and hunting, and mining (%)
Most Common Industries - Agriculture, forestry, fishing and hunting (%)
Most Common Industries - Mining, quarrying, and oil and gas extraction (%)
Most Common Industries - Construction (%)
Most Common Industries - Manufacturing (%)
Most Common Industries - Wholesale trade (%)
Most Common Industries - Retail trade (%)
Most Common Industries - Transportation and warehousing, and utilities (%)
Most Common Industries - Transportation and warehousing (%)
Most Common Industries - Utilities (%)
Most Common Industries - Information (%)
Most Common Industries - Finance and insurance, and real estate and rental and leasing (%)
Most Common Industries - Finance and insurance (%)
Most Common Industries - Real estate and rental and leasing (%)
Most Common Industries - Professional, scientific, and management, and administrative and waste management services (%)
Most Common Industries - Professional, scientific, and technical services (%)
Most Common Industries - Management of companies and enterprises (%)
Most Common Industries - Administrative and support and waste management services (%)
Most Common Industries - Educational services, and health care and social assistance (%)
Most Common Industries - Educational services (%)
Most Common Industries - Health care and social assistance (%)
Most Common Industries - Arts, entertainment, and recreation, and accommodation and food services (%)
Most Common Industries - Arts, entertainment, and recreation (%)
Most Common Industries - Accommodation and food services (%)
Most Common Industries - Other services, except public administration (%)
Most Common Industries - Public administration (%)
Occupation diversity
Most Common Occupations - Management, business, science, and arts occupations (%)
Most Common Occupations - Management, business, and financial occupations (%)
Most Common Occupations - Management occupations (%)
Most Common Occupations - Business and financial operations occupations (%)
Most Common Occupations - Computer, engineering, and science occupations (%)
Most Common Occupations - Computer and mathematical occupations (%)
Most Common Occupations - Architecture and engineering occupations (%)
Most Common Occupations - Life, physical, and social science occupations (%)
Most Common Occupations - Education, legal, community service, arts, and media occupations (%)
Most Common Occupations - Community and social service occupations (%)
Most Common Occupations - Legal occupations (%)
Most Common Occupations - Education, training, and library occupations (%)
Most Common Occupations - Arts, design, entertainment, sports, and media occupations (%)
Most Common Occupations - Healthcare practitioners and technical occupations (%)
Most Common Occupations - Health diagnosing and treating practitioners and other technical occupations (%)
Most Common Occupations - Health technologists and technicians (%)
Most Common Occupations - Service occupations (%)
Most Common Occupations - Healthcare support occupations (%)
Most Common Occupations - Protective service occupations (%)
Most Common Occupations - Fire fighting and prevention, and other protective service workers including supervisors (%)
Most Common Occupations - Law enforcement workers including supervisors (%)
Most Common Occupations - Food preparation and serving related occupations (%)
Most Common Occupations - Building and grounds cleaning and maintenance occupations (%)
Most Common Occupations - Personal care and service occupations (%)
Most Common Occupations - Sales and office occupations (%)
Most Common Occupations - Sales and related occupations (%)
Most Common Occupations - Office and administrative support occupations (%)
Most Common Occupations - Natural resources, construction, and maintenance occupations (%)
Most Common Occupations - Farming, fishing, and forestry occupations (%)
Most Common Occupations - Construction and extraction occupations (%)
Most Common Occupations - Installation, maintenance, and repair occupations (%)
Most Common Occupations - Production, transportation, and material moving occupations (%)
Most Common Occupations - Production occupations (%)
Most Common Occupations - Transportation occupations (%)
Most Common Occupations - Material moving occupations (%)
People in Group quarters - Institutionalized population (%)
People in Group quarters - Correctional institutions (%)
People in Group quarters - Federal prisons and detention centers (%)
People in Group quarters - Halfway houses (%)
People in Group quarters - Local jails and other confinement facilities (including police lockups) (%)
People in Group quarters - Military disciplinary barracks (%)
People in Group quarters - State prisons (%)
People in Group quarters - Other types of correctional institutions (%)
People in Group quarters - Nursing homes (%)
People in Group quarters - Hospitals/wards, hospices, and schools for the handicapped (%)
People in Group quarters - Hospitals/wards and hospices for chronically ill (%)
People in Group quarters - Hospices or homes for chronically ill (%)
People in Group quarters - Military hospitals or wards for chronically ill (%)
People in Group quarters - Other hospitals or wards for chronically ill (%)
People in Group quarters - Hospitals or wards for drug/alcohol abuse (%)
People in Group quarters - Mental (Psychiatric) hospitals or wards (%)
People in Group quarters - Schools, hospitals, or wards for the mentally retarded (%)
People in Group quarters - Schools, hospitals, or wards for the physically handicapped (%)
People in Group quarters - Institutions for the deaf (%)
People in Group quarters - Institutions for the blind (%)
People in Group quarters - Orthopedic wards and institutions for the physically handicapped (%)
People in Group quarters - Wards in general hospitals for patients who have no usual home elsewhere (%)
People in Group quarters - Wards in military hospitals for patients who have no usual home elsewhere (%)
People in Group quarters - Juvenile institutions (%)
People in Group quarters - Long-term care (%)
People in Group quarters - Homes for abused, dependent, and neglected children (%)
People in Group quarters - Residential treatment centers for emotionally disturbed children (%)
People in Group quarters - Training schools for juvenile delinquents (%)
People in Group quarters - Short-term care, detention or diagnostic centers for delinquent children (%)
People in Group quarters - Type of juvenile institution unknown (%)
People in Group quarters - Noninstitutionalized population (%)
People in Group quarters - College dormitories (includes college quarters off campus) (%)
People in Group quarters - Military quarters (%)
People in Group quarters - On base (%)
People in Group quarters - Barracks, unaccompanied personnel housing (UPH), (Enlisted/Officer), ;and similar group living quarters for military personnel (%)
People in Group quarters - Transient quarters for temporary residents (%)
People in Group quarters - Military ships (%)
People in Group quarters - Group homes (%)
People in Group quarters - Homes or halfway houses for drug/alcohol abuse (%)
People in Group quarters - Homes for the mentally ill (%)
People in Group quarters - Homes for the mentally retarded (%)
People in Group quarters - Homes for the physically handicapped (%)
People in Group quarters - Other group homes (%)
People in Group quarters - Religious group quarters (%)
People in Group quarters - Dormitories (%)
People in Group quarters - Agriculture workers' dormitories on farms (%)
People in Group quarters - Job Corps and vocational training facilities (%)
People in Group quarters - Other workers' dormitories (%)
People in Group quarters - Crews of maritime vessels (%)
People in Group quarters - Other nonhousehold living situations (%)
People in Group quarters - Other noninstitutional group quarters (%)
Residents speaking English at home (%)
Residents speaking English at home - Born in the United States (%)
Residents speaking English at home - Native, born elsewhere (%)
Residents speaking English at home - Foreign born (%)
Residents speaking Spanish at home (%)
Residents speaking Spanish at home - Born in the United States (%)
Residents speaking Spanish at home - Native, born elsewhere (%)
Residents speaking Spanish at home - Foreign born (%)
Residents speaking other language at home (%)
Residents speaking other language at home - Born in the United States (%)
Residents speaking other language at home - Native, born elsewhere (%)
Residents speaking other language at home - Foreign born (%)
Class of Workers - Employee of private company (%)
Class of Workers - Self-employed in own incorporated business (%)
Class of Workers - Private not-for-profit wage and salary workers (%)
Class of Workers - Local government workers (%)
Class of Workers - State government workers (%)
Class of Workers - Federal government workers (%)
Class of Workers - Self-employed workers in own not incorporated business and Unpaid family workers (%)
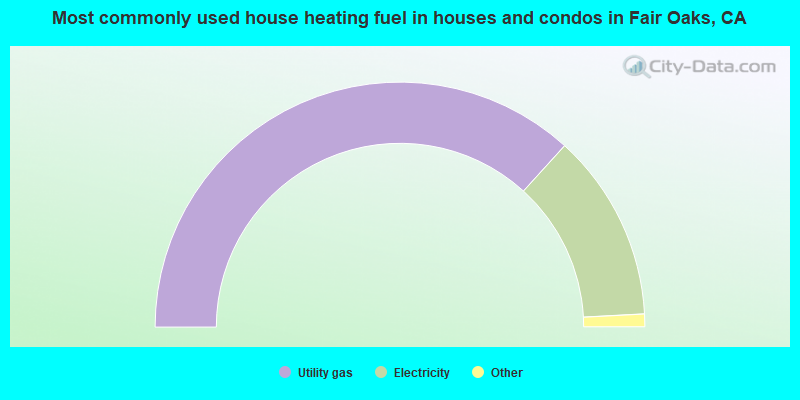
House heating fuel used in houses and condos - Utility gas (%)
House heating fuel used in houses and condos - Bottled, tank, or LP gas (%)
House heating fuel used in houses and condos - Electricity (%)
House heating fuel used in houses and condos - Fuel oil, kerosene, etc. (%)
House heating fuel used in houses and condos - Coal or coke (%)
House heating fuel used in houses and condos - Wood (%)
House heating fuel used in houses and condos - Solar energy (%)
House heating fuel used in houses and condos - Other fuel (%)
House heating fuel used in houses and condos - No fuel used (%)
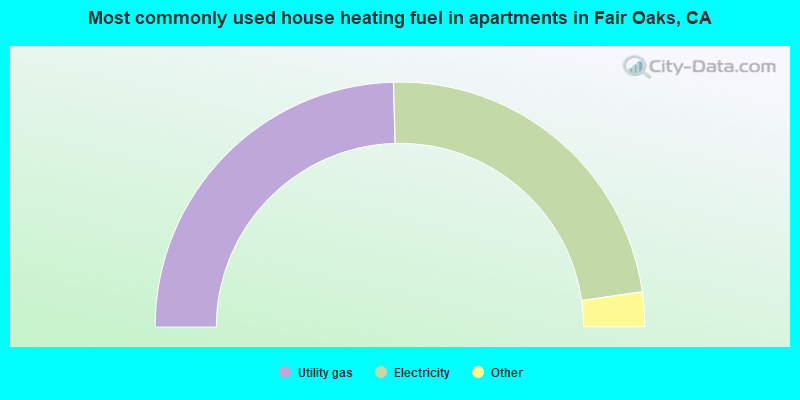
House heating fuel used in apartments - Utility gas (%)
House heating fuel used in apartments - Bottled, tank, or LP gas (%)
House heating fuel used in apartments - Electricity (%)
House heating fuel used in apartments - Fuel oil, kerosene, etc. (%)
House heating fuel used in apartments - Coal or coke (%)
House heating fuel used in apartments - Wood (%)
House heating fuel used in apartments - Solar energy (%)
House heating fuel used in apartments - Other fuel (%)
House heating fuel used in apartments - No fuel used (%)
Armed forces status - In Armed Forces (%)
Armed forces status - Civilian (%)
Armed forces status - Civilian - Veteran (%)
Armed forces status - Civilian - Nonveteran (%)
Fatal accidents locations in years 2005-2021
Fatal accidents locations in 2005
Fatal accidents locations in 2006
Fatal accidents locations in 2007
Fatal accidents locations in 2008
Fatal accidents locations in 2009
Fatal accidents locations in 2010
Fatal accidents locations in 2011
Fatal accidents locations in 2012
Fatal accidents locations in 2013
Fatal accidents locations in 2014
Fatal accidents locations in 2015
Fatal accidents locations in 2016
Fatal accidents locations in 2017
Fatal accidents locations in 2018
Fatal accidents locations in 2019
Fatal accidents locations in 2020
Fatal accidents locations in 2021
Alcohol use - People drinking some alcohol every month (%)
Alcohol use - People not drinking at all (%)
Alcohol use - Average days/month drinking alcohol
Alcohol use - Average drinks/week
Alcohol use - Average days/year people drink much
Audiometry - Average condition of hearing (%)
Audiometry - People that can hear a whisper from across a quiet room (%)
Audiometry - People that can hear normal voice from across a quiet room (%)
Audiometry - Ears ringing, roaring, buzzing (%)
Audiometry - Had a job exposure to loud noise (%)
Audiometry - Had off-work exposure to loud noise (%)
Blood Pressure & Cholesterol - Has high blood pressure (%)
Blood Pressure & Cholesterol - Checking blood pressure at home (%)
Blood Pressure & Cholesterol - Frequently checking blood cholesterol (%)
Blood Pressure & Cholesterol - Has high cholesterol level (%)
Consumer Behavior - Money monthly spent on food at supermarket/grocery store
Consumer Behavior - Money monthly spent on food at other stores
Consumer Behavior - Money monthly spent on eating out
Consumer Behavior - Money monthly spent on carryout/delivered foods
Consumer Behavior - Income spent on food at supermarket/grocery store (%)
Consumer Behavior - Income spent on food at other stores (%)
Consumer Behavior - Income spent on eating out (%)
Consumer Behavior - Income spent on carryout/delivered foods (%)
Current Health Status - General health condition (%)
Current Health Status - Blood donors (%)
Current Health Status - Has blood ever tested for HIV virus (%)
Current Health Status - Left-handed people (%)
Dermatology - People using sunscreen (%)
Diabetes - Diabetics (%)
Diabetes - Had a blood test for high blood sugar (%)
Diabetes - People taking insulin (%)
Diet Behavior & Nutrition - Diet health (%)
Diet Behavior & Nutrition - Milk product consumption (# of products/month)
Diet Behavior & Nutrition - Meals not home prepared (#/week)
Diet Behavior & Nutrition - Meals from fast food or pizza place (#/week)
Diet Behavior & Nutrition - Ready-to-eat foods (#/month)
Diet Behavior & Nutrition - Frozen meals/pizza (#/month)
Drug Use - People that ever used marijuana or hashish (%)
Drug Use - Ever used hard drugs (%)
Drug Use - Ever used any form of cocaine (%)
Drug Use - Ever used heroin (%)
Drug Use - Ever used methamphetamine (%)
Health Insurance - People covered by health insurance (%)
Kidney Conditions-Urology - Avg. # of times urinating at night
Medical Conditions - People with asthma (%)
Medical Conditions - People with anemia (%)
Medical Conditions - People with psoriasis (%)
Medical Conditions - People with overweight (%)
Medical Conditions - Elderly people having difficulties in thinking or remembering (%)
Medical Conditions - People who ever received blood transfusion (%)
Medical Conditions - People having trouble seeing even with glass/contacts (%)
Medical Conditions - People with arthritis (%)
Medical Conditions - People with gout (%)
Medical Conditions - People with congestive heart failure (%)
Medical Conditions - People with coronary heart disease (%)
Medical Conditions - People with angina pectoris (%)
Medical Conditions - People who ever had heart attack (%)
Medical Conditions - People who ever had stroke (%)
Medical Conditions - People with emphysema (%)
Medical Conditions - People with thyroid problem (%)
Medical Conditions - People with chronic bronchitis (%)
Medical Conditions - People with any liver condition (%)
Medical Conditions - People who ever had cancer or malignancy (%)
Mental Health - People who have little interest in doing things (%)
Mental Health - People feeling down, depressed, or hopeless (%)
Mental Health - People who have trouble sleeping or sleeping too much (%)
Mental Health - People feeling tired or having little energy (%)
Mental Health - People with poor appetite or overeating (%)
Mental Health - People feeling bad about themself (%)
Mental Health - People who have trouble concentrating on things (%)
Mental Health - People moving or speaking slowly or too fast (%)
Mental Health - People having thoughts they would be better off dead (%)
Oral Health - Average years since last visit a dentist
Oral Health - People embarrassed because of mouth (%)
Oral Health - People with gum disease (%)
Oral Health - General health of teeth and gums (%)
Oral Health - Average days a week using dental floss/device
Oral Health - Average days a week using mouthwash for dental problem
Oral Health - Average number of teeth
Pesticide Use - Households using pesticides to control insects (%)
Pesticide Use - Households using pesticides to kill weeds (%)
Physical Activity - People doing vigorous-intensity work activities (%)
Physical Activity - People doing moderate-intensity work activities (%)
Physical Activity - People walking or bicycling (%)
Physical Activity - People doing vigorous-intensity recreational activities (%)
Physical Activity - People doing moderate-intensity recreational activities (%)
Physical Activity - Average hours a day doing sedentary activities
Physical Activity - Average hours a day watching TV or videos
Physical Activity - Average hours a day using computer
Physical Functioning - People having limitations keeping them from working (%)
Physical Functioning - People limited in amount of work they can do (%)
Physical Functioning - People that need special equipment to walk (%)
Physical Functioning - People experiencing confusion/memory problems (%)
Physical Functioning - People requiring special healthcare equipment (%)
Prescription Medications - Average number of prescription medicines taking
Preventive Aspirin Use - Adults 40+ taking low-dose aspirin (%)
Reproductive Health - Vaginal deliveries (%)
Reproductive Health - Cesarean deliveries (%)
Reproductive Health - Deliveries resulted in a live birth (%)
Reproductive Health - Pregnancies resulted in a delivery (%)
Reproductive Health - Women breastfeeding newborns (%)
Reproductive Health - Women that had a hysterectomy (%)
Reproductive Health - Women that had both ovaries removed (%)
Reproductive Health - Women that have ever taken birth control pills (%)
Reproductive Health - Women taking birth control pills (%)
Reproductive Health - Women that have ever used Depo-Provera or injectables (%)
Reproductive Health - Women that have ever used female hormones (%)
Sexual Behavior - People 18+ that ever had sex (vaginal, anal, or oral) (%)
Sexual Behavior - Males 18+ that ever had vaginal sex with a woman (%)
Sexual Behavior - Males 18+ that ever performed oral sex on a woman (%)
Sexual Behavior - Males 18+ that ever had anal sex with a woman (%)
Sexual Behavior - Males 18+ that ever had any sex with a man (%)
Sexual Behavior - Females 18+ that ever had vaginal sex with a man (%)
Sexual Behavior - Females 18+ that ever performed oral sex on a man (%)
Sexual Behavior - Females 18+ that ever had anal sex with a man (%)
Sexual Behavior - Females 18+ that ever had any kind of sex with a woman (%)
Sexual Behavior - Average age people first had sex
Sexual Behavior - Average number of female sex partners in lifetime (males 18+)
Sexual Behavior - Average number of female vaginal sex partners in lifetime (males 18+)
Sexual Behavior - Average age people first performed oral sex on a woman (18+)
Sexual Behavior - Average number of woman performed oral sex on in lifetime (18+)
Sexual Behavior - Average number of male sex partners in lifetime (males 18+)
Sexual Behavior - Average number of male anal sex partners in lifetime (males 18+)
Sexual Behavior - Average age people first performed oral sex on a man (18+)
Sexual Behavior - Average number of male oral sex partners in lifetime (18+)
Sexual Behavior - People using protection when performing oral sex (%)
Sexual Behavior - Average number of times people have vaginal or anal sex a year
Sexual Behavior - People having sex without condom (%)
Sexual Behavior - Average number of male sex partners in lifetime (females 18+)
Sexual Behavior - Average number of male vaginal sex partners in lifetime (females 18+)
Sexual Behavior - Average number of female sex partners in lifetime (females 18+)
Sexual Behavior - Circumcised males 18+ (%)
Sleep Disorders - Average hours sleeping at night
Sleep Disorders - People that has trouble sleeping (%)
Smoking-Cigarette Use - People smoking cigarettes (%)
Taste & Smell - People 40+ having problems with smell (%)
Taste & Smell - People 40+ having problems with taste (%)
Taste & Smell - People 40+ that ever had wisdom teeth removed (%)
Taste & Smell - People 40+ that ever had tonsils teeth removed (%)
Taste & Smell - People 40+ that ever had a loss of consciousness because of a head injury (%)
Taste & Smell - People 40+ that ever had a broken nose or other serious injury to face or skull (%)
Taste & Smell - People 40+ that ever had two or more sinus infections (%)
Weight - Average height (inches)
Weight - Average weight (pounds)
Weight - Average BMI
Weight - People that are obese (%)
Weight - People that ever were obese (%)
Weight - People trying to lose weight (%)
23,063 70.2% White alone 4,619 14.1% Hispanic 2,071 6.3% Two or more races 1,540 4.7% Asian alone 706 2.1% Black alone 260 0.8% Other race alone 67 0.2% American Indian alone
According to our research of California and other state lists, there were 41 registered sex offenders living in Fair Oaks, California as of April 27, 2024 . The ratio of all residents to sex offenders in Fair Oaks is 794 to 1.The ratio of registered sex offenders to all residents in this city is near the state average.
Latest news from Fair Oaks, CA collected exclusively by city-data.com from local newspapers, TV, and radio stations
Ancestries: European (14.2%), English (8.8%), German (7.7%), American (6.3%), Irish (5.3%), Ukrainian (2.7%).
Current Local Time:
Land area: 9.89 square miles.
Population density: 3,126 people per square mile (average).
3,307 residents are foreign born (4.2% Europe , 3.4% Asia , 1.4% Latin America ).
This place:
10.1%California:
26.5%
Median real estate property taxes paid for housing units with mortgages in 2022: $5,054 (0.7%)Median real estate property taxes paid for housing units with no mortgage in 2022: $4,412 (0.6%)
Nearest city with pop. 50,000+: Citrus Heights, CA
Nearest city with pop. 200,000+: Sacramento, CA
Nearest city with pop. 1,000,000+: Los Angeles, CA
Nearest cities:
Latitude: 38.65 N, Longitude: 121.26 W
Daytime population change due to commuting: -7,178 (-21.8%)Workers who live and work in this place: 4,608 (27.6%)
Unemployment in December 2023:
Most common occupations in Fair Oaks, CA (%)
Both Males Females
Other management occupations, except farmers and farm managers (7.1%)
Other office and administrative support workers, including supervisors (5.4%)
Other sales and related occupations, including supervisors (5.2%)
Computer specialists (5.0%)
Retail sales workers, except cashiers (3.5%)
Preschool, kindergarten, elementary, and middle school teachers (3.5%)
Sales representatives, services, wholesale and manufacturing (3.2%)
Other management occupations, except farmers and farm managers (7.7%)
Computer specialists (6.4%)
Other sales and related occupations, including supervisors (6.0%)
Sales representatives, services, wholesale and manufacturing (4.1%)
Engineers (4.0%)
Top executives (3.7%)
Other office and administrative support workers, including supervisors (3.6%)
Other office and administrative support workers, including supervisors (7.3%)
Other management occupations, except farmers and farm managers (6.4%)
Preschool, kindergarten, elementary, and middle school teachers (6.2%)
Secretaries and administrative assistants (5.9%)
Other sales and related occupations, including supervisors (4.3%)
Retail sales workers, except cashiers (3.9%)
Computer specialists (3.4%)
Earthquake activity:
Fair Oaks-area historical earthquake activity is significantly above California state average. It is 7658% greater than the overall U.S. average. On 4/18/1906 at 13:12:21, a magnitude 7.9 (7.9 UK, Class: Major, Intensity: VIII - XII) earthquake occurred 104.6 miles away from the city center, causing $524,000,000 total damage On 10/18/1989 at 00:04:15, a magnitude 7.1 (6.5 MB, 7.1 MS, 6.9 MW, 7.0 ML) earthquake occurred 110.2 miles away from Fair Oaks center, causing 62 deaths ( 62 shaking deaths) and 3757 injuries, causing $1,305,032,704 total damage On 10/3/1915 at 06:52:48, a magnitude 7.6 (7.6 UK) earthquake occurred 237.7 miles away from Fair Oaks center On 7/21/1952 at 11:52:14, a magnitude 7.7 (7.7 UK) earthquake occurred 281.8 miles away from Fair Oaks center, causing $50,000,000 total damage On 12/21/1932 at 06:10:09, a magnitude 7.2 (7.2 UK) earthquake occurred 172.0 miles away from Fair Oaks center On 1/31/1922 at 13:17:28, a magnitude 7.6 (7.6 UK) earthquake occurred 268.9 miles away from the city center Magnitude types: body-wave magnitude (MB), local magnitude (ML), surface-wave magnitude (MS), moment magnitude (MW) Natural disasters: The number of natural disasters in Sacramento County (18) is near the US average (15).Major Disasters (Presidential) Declared: 11Emergencies Declared: 3Floods: 13, Winter Storms: 6, Storms: 5, Mudslides: 4, Landslides: 3, Drought: 1, Earthquake: 1, Heavy Rain: 1, Hurricane: 1, Tornado: 1, Wind: 1, Other: 1 (Note: some incidents may be assigned to more than one category). Hospitals and medical centers in Fair Oaks: FAIR OAKS HOSPITAL (provides emergency services, 11228 FAIR OAKS BLVD) ESKATON HOME HEALTHCARE (9722 FAIR OAKS BLVD, SUITE A & E)
ESKATON CARE CENTER FAIR OAKS (11300 FAIR OAKS BLVD.)
Amtrak stations near Fair Oaks: 5 miles: RANCHO CORDOVA (10369 FOLSOM BLVD.) - Bus Station Services: fully wheelchair accessible, free short-term parking, public transit connection.
8 miles: ROSEVILLE (201 PACIFIC ST.) Services: partially wheelchair accessible, public payphones, free short-term parking, free long-term parking, taxi stand, intercity bus service.
10 miles: ROCKLIN (ROCKLIN RD. & RAILROAD AVE.) - Bus Station Services: partially wheelchair accessible, free short-term parking.
Colleges/universities with over 2000 students nearest to Fair Oaks:
American River College (about 5 miles; Sacramento, CA ; Full-time enrollment: 20,452)
Folsom Lake College (about 8 miles; Folsom, CA ; FT enrollment: 5,308)
Sierra College (about 11 miles; Rocklin, CA ; FT enrollment: 11,488)
California State University-Sacramento (about 11 miles; Sacramento, CA ; FT enrollment: 22,234)
University of Phoenix-Sacramento Valley Campus (about 15 miles; Sacramento, CA ; FT enrollment: 2,855)
Universal Technical Institute of Northern California Inc (about 15 miles; Sacramento, CA ; FT enrollment: 3,193)
Sacramento City College (about 15 miles; Sacramento, CA ; FT enrollment: 15,963)
Public high schools in Fair Oaks: BELLA VISTA HIGH Students: 1,258, Location: 8301 MADISON AVE., Grades: 9-12)DEL CAMPO HIGH Students: 1,240, Location: 4925 DEWEY DR., Grades: 9-12)EL SERENO ALTERNATIVE EDUCATION Students: 71, Location: 10700 FAIR OAKS BLVD., Grades: 9-12)LA VISTA CENTER Students: 32, Location: 4501 BANNISTER RD., Grades: 6-12)Private high schools in Fair Oaks: SACRAMENTO WALDORF SCHOOL Students: 407, Location: 3750 BANNISTER RD, Grades: PK-12)
FREEDOM CHRISTIAN SCHOOL Students: 132, Location: 7736 SUNSET AVE, Grades: KG-12)
HARBOR HALLS ACADEMY Students: 12, Location: 9813 FAIR OAKS BLVD STE A, Grades: 7-12, Boys only )
Public elementary/middle schools in Fair Oaks: WILL ROGERS MIDDLE Students: 569, Location: 4924 DEWEY DR., Grades: 6-8)ORANGEVALE OPEN K-8 Students: 446, Location: 5630 ILLINOIS AVE., Grades: KG-8)EARL LEGETTE ELEMENTARY Students: 341, Location: 4623 KENNETH AVE., Grades: KG-6)NORTHRIDGE ELEMENTARY Students: 337, Location: 5150 COCOA PALM WAY, Grades: KG-6)HARRY DEWEY FUNDAMENTAL ELEMENTARY Students: 301, Location: 7025 FALCON RD., Grades: KG-6)Private elementary/middle schools in Fair Oaks: ST MEL SCHOOL Students: 249, Location: 4745 PENNSYLVANIA AVE, Grades: PK-8)
SUMMIT CHRISTIAN SCHOOL Students: 109, Location: 5010 HAZEL AVE, Grades: PK-8)
FAITH LUTHERAN SCHOOL Students: 48, Location: 4000 SAN JUAN AVE, Grades: PK-1)
COUNTRY HILL MONTESSORI Students: 9, Location: 6131 KENNETH AVE, Grades: 1)
See full list of schools located in Fair Oaks User-submitted facts and corrections:
Fair Oaks Elementary school was closed in 2003 or 2004. I believe it is used by the school district for administrative purposes now.
HOLST (JOHN) ELEMENTARY (Students: 392; Location: 4501 BANNISTER AVE.; Grades: KG - 06) SCheduled to closed at the end of 2005 -06 school year
FAIR OAKS ELEMENTARY (Students: 304; Location: 10700 FAIR OAKS BLVD.; Grades: KG - 06) closed in 2004
Notable locations in Fair Oaks: (A) , Arden Gold Sewage Treatment Plant (B) , Northridge Country Club (C) , Nimbus Powerhouse (D) , Fair Oaks Community Library (E) , Fair Oaks Community Center (F) , Sacramento Metropolitan Fire District Station 32 (G) , Sacramento Metropolitan Fire District Station 31 (H) . Display/hide their locations on the map
Shopping Centers: (1) , Hazen Ridge Plaza Shopping Center (2) , Sunset Shopping Center (3) , Northridge Shopping Center (4) , Northridge Plaza Shopping Center (5) , Fair Oaks Square Shopping Center (6) , Bel Air Shopping Center (7) , Quail Pointe Shopping Center (8) . Display/hide their locations on the map
Churches in Fair Oaks include: (A) , Saint Mels Catholic Church (B) , Fair Oaks Open Bible Church (C) , Faith Lutheran Church (D) , Grace Bible Church (E) . Display/hide their locations on the map
Cemetery: (1) . Display/hide its location on the map
Creek: (A) . Display/hide its location on the map
Parks in Fair Oaks include: (1) , Fair Oaks Park (2) , Jim David Park (3) , Miller Park (4) , Mont View Park (5) , Phoenix Park (6) , Village Park (7) , Little Phoenix Park (8) . Display/hide their locations on the map
Tourist attraction:
Birthplace of: Joan Lunden - Television news anchor, Randall Bal - Swimmer, Michael Stember - Track and field middle distance runner.
Sacramento County has a predicted average indoor radon screening level less than 2 pCi/L (pico curies per liter) - Low Potential Drinking water stations with addresses in Fair Oaks and their reported violations in the past:
LAKESHORE VILLA CENTER (Population served: 30, Groundwater):
Past health violations:
MCL, Acute (TCR) - Between OCT-2010 and DEC-2010, Contaminant: Coliform
Past monitoring violations:
2 minor monitoring violations
Drinking water stations with addresses in Fair Oaks that have no violations reported:
NORTH RIDGE COUNTRY CLUB (Population served: 300, Primary Water Source Type: Groundwater)
Average household size: This place:
2.4 peopleCalifornia:
2.9 people
Percentage of family households: This place:
66.7%Whole state:
68.7%
Percentage of households with unmarried partners: This place:
6.8%Whole state:
7.2%
Likely homosexual households (counted as self-reported same-sex unmarried-partner households)
Lesbian couples: 0.5% of all households Gay men: 0.3% of all households
People in group quarters in Fair Oaks in 2010:
162 people in group homes intended for adults
128 people in nursing facilities/skilled-nursing facilities
57 people in residential treatment centers for adults
22 people in college/university student housing
20 people in workers' group living quarters and job corps centers
17 people in in-patient hospice facilities
12 people in group homes for juveniles (non-correctional)
12 people in residential treatment centers for juveniles (non-correctional)
People in group quarters in Fair Oaks in 2000:
167 people in nursing homes
46 people in homes for the mentally retarded
30 people in homes or halfway houses for drug/alcohol abuse
29 people in residential treatment centers for emotionally disturbed children
24 people in other noninstitutional group quarters
12 people in other nonhousehold living situations
6 people in schools, hospitals, or wards for the intellectually disabled
6 people in homes for the mentally ill
Banks with branches in Fair Oaks (2011 data):
U.S. Bank National Association: Dewey Drive Safeway Branch at 5450 Dewey Drive, branch established on 2004/06/07; Madison & Hazel Safeway at 8925 Madison Avenue, branch established on 2008/10/17. Info updated 2012/01/30: Bank assets: $330,470.8 mil, Deposits: $236,091.5 mil, headquarters in Cincinnati, OH, positive income , 3121 total offices , Holding Company: U.S. Bancorp
JPMorgan Chase Bank, National Association: Madison Hazel Branch at 8859 Madison Avenue, branch established on 1924/01/01; San Juan & Sunset Banking Center at 4820 San Juan Avenue, branch established on 2011/03/08. Info updated 2011/11/10: Bank assets: $1,811,678.0 mil, Deposits: $1,190,738.0 mil, headquarters in Columbus, OH, positive income , International Specialization, 5577 total offices , Holding Company: Jpmorgan Chase & Co.
Wells Fargo Bank, National Association: Fair Oaks-San Juan Avenue Branch at 4840 San Juan Avenue, branch established on 1995/01/19; Madison Mall Branch at 8870 Madison Avenue, branch established on 1996/11/27. Info updated 2011/04/05: Bank assets: $1,161,490.0 mil, Deposits: $905,653.0 mil, headquarters in Sioux Falls, SD, positive income , 6395 total offices , Holding Company: Wells Fargo & Company
American River Bank: Fair Oaks Village Branch at 10123 Fair Oaks Boulevard, branch established on 1985/04/15. Info updated 2006/11/03: Bank assets: $581.6 mil, Deposits: $467.4 mil, headquarters in Sacramento, CA, positive income , Commercial Lending Specialization, 12 total offices , Holding Company: American River Bankshares
For population 15 years and over in Fair Oaks:
Never married: 27.3%Now married: 53.6%Separated: 1.8%Widowed: 5.2%Divorced: 12.1% For population 25 years and over in Fair Oaks:
High school or higher: 96.3%Bachelor's degree or higher: 47.3%Graduate or professional degree: 16.9%Unemployed: 3.6%Mean travel time to work (commute): 22.0 minutes
Education Gini index (Inequality in education) Here:
9.9California average:
15.5
Religion statistics for Fair Oaks, CA (based on Sacramento County data)
Religion Adherents Congregations Catholic 229,725 45 Evangelical Protestant 157,621 493 Other 86,390 183 Mainline Protestant 33,989 105 Black Protestant 12,585 38 Orthodox 5,675 12 None 892,803 -
Source: Clifford Grammich, Kirk Hadaway, Richard Houseal, Dale E.Jones, Alexei Krindatch, Richie Stanley and Richard H.Taylor. 2012. 2010 U.S.Religion Census: Religious Congregations & Membership Study. Association of Statisticians of American Religious Bodies. Jones, Dale E., et al. 2002. Congregations and Membership in the United States 2000. Nashville, TN: Glenmary Research Center. Graphs represent county-level data
Food Environment Statistics: Number of grocery stores : 255This county :
1.85 / 10,000 pop.California :
2.14 / 10,000 pop.
Number of supercenters and club stores : 10Sacramento County :
0.07 / 10,000 pop.State :
0.04 / 10,000 pop.
Number of convenience stores (no gas) : 86This county :
0.62 / 10,000 pop.California :
0.62 / 10,000 pop.
Number of convenience stores (with gas) : 233This county :
1.69 / 10,000 pop.State :
1.49 / 10,000 pop.
Number of full-service restaurants : 922This county :
6.68 / 10,000 pop.California :
7.42 / 10,000 pop.
Adult diabetes rate : Sacramento County :
7.8%California :
7.3%
Adult obesity rate : This county :
25.0%California :
21.3%
Low-income preschool obesity rate : Sacramento County :
15.4%California :
17.9%
Health and Nutrition: Healthy diet rate : Here:
53.5%California:
49.4%
Average overall health of teeth and gums : This city:
52.1%California:
48.0%
People feeling badly about themselves : This city:
19.4%California:
20.2%
People not drinking alcohol at all : This city:
8.9%State:
11.2%
Average hours sleeping at night : Overweight people : Fair Oaks:
34.7%California:
31.5%
General health condition : Here:
59.3%California:
56.4%
Average condition of hearing : Fair Oaks:
79.3%California:
80.9%
More about Health and Nutrition of Fair Oaks, CA Residents
5.68% of this county's 2021 resident taxpayers lived in other counties in 2020 ($67,729 average adjusted gross income )
Here:
5.68%California average:
5.19%
0.01% of residents moved from foreign countries ($150 average AGI )Sacramento County:
0.01%California average:
0.03%
Top counties from which taxpayers relocated into this county between 2020 and 2021:
6.10% of this county's 2020 resident taxpayers moved to other counties in 2021 ($74,281 average adjusted gross income )
Here:
6.10%California average:
6.14%
0.01% of residents moved to foreign countries ($109 average AGI )Sacramento County:
0.01%California average:
0.02%
Top counties to which taxpayers relocated from this county between 2020 and 2021:
Businesses in Fair Oaks, CA
Name Count Name Count
24 Hour Fitness 1 McDonald's 2 7-Eleven 1 New Balance 1 Arby's 1 Panda Express 1 Baskin-Robbins 1 Safeway 2 CVS 1 Starbucks 5 Carl\s Jr. 1 Subway 4 FedEx 5 T.J.Maxx 1 GameStop 2 Taco Bell 2 H&R Block 1 Trader Joe's 1 Jamba Juice 1 U-Haul 1 Jones New York 1 UPS 2 KFC 1 Vans 1 LensCrafters 1 Vons 2
Strongest AM radio stations in Fair Oaks:
KSTE (650 AM; 25 kW; RANCHO CORDOVA, CA; Owner: AMFM RADIO LICENSES, L.L.C.)
KLIB (1110 AM; 10 kW; ROSEVILLE, CA; Owner: WAY BROADCASTING, INC.)
KFIA (710 AM; 25 kW; CARMICHAEL, CA; Owner: VISTA BROADCASTING INC.)
KFSG (1690 AM; 10 kW; ROSEVILLE, CA; Owner: WAY BROADCASTING, INC.)
KHTK (1140 AM; 50 kW; SACRAMENTO, CA; Owner: INFINITY RADIO SUBSIDIARY OPERATIONS INC.)
KFBK (1530 AM; 50 kW; SACRAMENTO, CA; Owner: AMFM RADIO LICENSES, L.L.C.)
KTKZ (1380 AM; 5 kW; SACRAMENTO, CA; Owner: VISTA BROADCASTING, INC.)
KSMH (1620 AM; 10 kW; WEST SACRAMENTO, CA; Owner: IHR EDUCATIONAL BROADCASTING)
KAHI (950 AM; 10 kW; AUBURN, CA; Owner: IHR EDUCATIONAL BROADCASTING)
KIID (1470 AM; 5 kW; SACRAMENTO, CA; Owner: ABC, INC.)
KEBR (1210 AM; 5 kW; ROCKLIN, CA; Owner: FAMILY STATIONS, INC.)
KCBC (770 AM; 50 kW; RIVERBANK, CA; Owner: KIERTRON, INC.)
KCTC (1320 AM; 5 kW; SACRAMENTO, CA; Owner: ENTERCOM SACRAMENTO LICENSE, LLC)
Strongest FM radio stations in Fair Oaks:
KXOA (93.7 FM; ROSEVILLE, CA; Owner: INFINITY RADIO SUBSIDIARY OPERATIONS INC.)
KXCL (103.9 FM; YUBA CITY, CA; Owner: HARLAN COMMUNICATIONS, INC.)
KRXQ (98.5 FM; SACRAMENTO, CA; Owner: ENTERCOM SACRAMENTO LICENSE, LLC)
K211DF (90.1 FM; FOOTHILL FARMS, CA; Owner: YOUR CHRISTIAN COMPANION NETWORK, INC.)
KEDR (88.1 FM; SACRAMENTO, CA; Owner: FAMILY STATIONS, INC.)
KNCI (105.1 FM; SACRAMENTO, CA; Owner: INFINITY RADIO SUBSIDIARY OPERATIONS INC.)
K256AG (99.1 FM; CLARKSVILLE, CA; Owner: EDUCATIONAL MEDIA FOUNDATION)
KWOD (106.5 FM; SACRAMENTO, CA; Owner: ENTERCOM SACRAMENTO LICENSE, LLC)
KSEG (96.9 FM; SACRAMENTO, CA; Owner: ENTERCOM SACRAMENTO LICENSE, LLC)
KZZO (100.5 FM; SACRAMENTO, CA; Owner: INFINITY RADIO OPERATIONS INC.)
KXPR (90.9 FM; SACRAMENTO, CA; Owner: CALIFORNIA STATE UNIVERSITY)
KGBY (92.5 FM; SACRAMENTO, CA; Owner: AMFM RADIO LICENSES, L.L.C.)
KDND (107.9 FM; SACRAMENTO, CA; Owner: ENTERCOM SACRAMENTO LICENSE, LLC)
KCCL-FM (101.9 FM; SHINGLE SPRINGS, CA; Owner: ENTRAVISION HOLDINGS, LLC)
KKSF-FM1 (103.7 FM; PLEASANTON, ETC., CA; Owner: AMFM RADIO LICENSES, L.L.C.)
KRCX-FM (99.9 FM; MARYSVILLE, CA; Owner: ENTRAVISION HOLDINGS, LLC)
KQEI-FM (89.3 FM; NORTH HIGHLANDS, CA; Owner: KQED, INC.)
KYMX (96.1 FM; SACRAMENTO, CA; Owner: INFINITY RADIO OPERATIONS INC.)
KBLX-FM2 (102.9 FM; PLEASANTON, CA; Owner: ICBC BROADCAST HOLDINGS -CA, INC.)
KSOL-FM3 (98.9 FM; PLEASANTON, CA; Owner: TMS LICENSE CALIFORNIA, INC)
TV broadcast stations around Fair Oaks:
KMMK-LP (Channel 14; SACRAMENTO, CA; Owner: CABALLERO TELEVISION TEXAS, L.L.C.)
K22FR (Channel 22; SACRAMENTO, CA; Owner: NATIONAL MINORITY T.V., INC.)
KEZT-CA (Channel 23; SACRAMENTO, CA; Owner: TELEFUTURA SACRAMENTO LLC)
K27EU (Channel 27; SACRAMENTO, CA; Owner: ABUNDANT LIFE BROADCASTING, INC.)
KCSO-LP (Channel 33; SACRAMENTO, CA; Owner: SAINTE 51, L.P.)
KSPX (Channel 29; SACRAMENTO, CA; Owner: PAXSON SACRAMENTO LICENSE, INC.)
KTXL (Channel 40; SACRAMENTO, CA; Owner: CHANNEL 40, INC.)
KQCA (Channel 58; STOCKTON, CA; Owner: KCRA HEARST-ARGYLE TELEVISION, INC.)
KCRA-TV (Channel 3; SACRAMENTO, CA; Owner: KCRA HEARST-ARGYLE TELEVISION, INC.)
KVIE (Channel 6; SACRAMENTO, CA; Owner: KVIE, INC.)
KOVR (Channel 13; STOCKTON, CA; Owner: SCI - SACRAMENTO LICENSEE, LLC)
KXTV (Channel 10; SACRAMENTO, CA; Owner: KXTV, INC.)
KMAX-TV (Channel 31; SACRAMENTO, CA; Owner: UPN STATIONS GROUP INC.)
KUVS (Channel 19; MODESTO, CA; Owner: KUVS LICENSE PARTNERSHIP, G.P.)
K69FB (Channel 69; SACRAMENTO, CA; Owner: TRINITY BROADCASTING NETWORK)
K17EH (Channel 17; EUREKA, CA; Owner: MS COMMUNICATIONS, LLC)
KSAO-LP (Channel 49; SACRAMENTO, CA; Owner: GARY M. COCOLA FAMILY TRUST, GARY M. COCOLA TRUSTEE)
KBTV-LP (Channel 8; SACRAMENTO, CA; Owner: INCISOR COMMUNICATIONS, L.L.C.)
KMUM-CA (Channel 15; SACRAMENTO, CA; Owner: CABALLERO TELEVISION TEXAS, L.L.C.)
KRJR-LP (Channel 47; SACRAMENTO, CA; Owner: WORD OF GOD FELLOWSHIP, INC.)
K27FX (Channel 27; EUREKA, CA; Owner: MS COMMUNICATIONS, LLC)
KGTN-LP (Channel 62; PLACERVILLE, CA; Owner: PRAISE THE LORD STUDIO CHAPEL)
K61DW (Channel 61; SACRAMENTO, CA; Owner: DR. W. R. PORTEE)
KSTV-LP (Channel 60; SACRAMENTO, CA; Owner: GARY M. COCOLA FAMILY TRUST, GARY M. COCOLA TRUSTEE)
National Bridge Inventory (NBI) Statistics 1 Number of bridges13ft / 4.1m Total length3,204 Total average daily traffic320 Total average daily truck traffic4,335 Total future (year 2043) average daily traffic
FCC Registered Antenna Towers: 24 (
See the full list of FCC Registered Antenna Towers in Fair Oaks )
FCC Registered Private Land Mobile Towers: 2 (
See the full list of FCC Registered Private Land Mobile Towers in Fair Oaks, CA )
FCC Registered Broadcast Land Mobile Towers: 7 (
See the full list of FCC Registered Broadcast Land Mobile Towers )
FCC Registered Microwave Towers: 6
Fair Oaks CA 3, 9849 Fair Oaks Blvd. (Lat: 38.640167 Lon: -121.274389), Type: Pole, Structure height: 19.5 m, Overall height: 20.7 m, Call Sign: WQII373, Assigned Frequencies: 11325.0 MHz, Grant Date: 02/19/2008, Expiration Date: 02/19/2018, Cancellation Date: 08/19/2009, Certifier: William Chastain, Registrant: Radio Dynamics Corporation, 774 Mays Blvd., #10-465, Silver Spring, MD 20914, Phone: (301) 493-5171, Fax: (301) 576-4553, Email:
SC06135A, 7437 Sunset Ave (Lat: 38.653389 Lon: -121.290528), Type: Pole, Structure height: 23.2 m, Call Sign: WQJE912, Assigned Frequencies: 19405.0 MHz, Grant Date: 08/15/2008, Expiration Date: 08/15/2018, Cancellation Date: 01/28/2010, Certifier: Eric Miller, Registrant: Nextlink Wireless Inc., 13865 Sunrise Valley Drive, Herndon, VA 20171, Phone: (703) 547-2395, Fax: (703) 547-2422, Email:
CA-SAC103A, 8848 Madison Ave Suite C (Lat: 38.661611 Lon: -121.228028), Type: Pole, Structure height: 19.8 m, Call Sign: WQMF787, Assigned Frequencies: 21925.0 MHz, 22075.0 MHz, Grant Date: 09/09/2020, Expiration Date: 07/27/2030, Cancellation Date: 06/24/2021, Certifier: Nadja S Sodos-Wallace, Registrant: Sprint Corporation, 12502 Sunrise Valley Drive, M/S: Varesa0209, Reston, VA 20196, Phone: (800) 572-8256, Fax: (703) 433-4483, Email:
CA-SAC0691A, 9849 Fair Oaks Blvd (Lat: 38.640167 Lon: -121.274444), Type: Pole, Structure height: 19.5 m, Call Sign: WQMF806, Assigned Frequencies: 11465.0 MHz, 11585.0 MHz, Grant Date: 07/27/2010, Expiration Date: 07/27/2020, Cancellation Date: 09/26/2020, Certifier: Nadja S Sodos-Wallace, Registrant: Sprint Corporation, 12502 Sunrise Valley Drive, M/S: Varesa0209, Reston, VA 20196, Phone: (800) 572-8256, Fax: (703) 433-4483, Email:
CA-SAC136A, 7437 Sunset Ave (Lat: 38.653500 Lon: -121.290472), Type: Pole, Structure height: 27.4 m, Call Sign: WQMF918, Assigned Frequencies: 19375.0 MHz, 19475.0 MHz, Grant Date: 09/09/2020, Expiration Date: 07/28/2030, Cancellation Date: 09/13/2021, Certifier: Nadja S Sodos-Wallace, Registrant: T-Mobile Usa, Inc., 12920 Se 38th Street, Bellevue, WA 98006, Phone: (425) 383-8402, Fax: (425) 383-4840, Email:
SC06149A, 8147 Greenback Ln (Lat: 38.680111 Lon: -121.260000), Type: Pole, Structure height: 23 m, Call Sign: WQNR801, Assigned Frequencies: 11135.0 MHz, Grant Date: 05/03/2011, Expiration Date: 05/03/2021, Cancellation Date: 05/04/2018, Certifier: Denise C Clayton, Registrant: Verizon, 5055 North Point Pkwy, Np2ne Network Engineering, Alpharetta, GA 30022, Phone: (770) 797-1070, Email:
FCC Registered Amateur Radio Licenses: 329 (
See the full list of FCC Registered Amateur Radio Licenses in Fair Oaks )
FAA Registered Aircraft: 49 (
See the full list of FAA Registered Aircraft in Fair Oaks )
Home Mortgage Disclosure Act Aggregated Statistics For Year 2009(Based on 6 full tracts) A) FHA, FSA/RHS & VA B) Conventional C) Refinancings D) Home Improvement Loans F) Non-occupant Loans on Number Average Value Number Average Value Number Average Value Number Average Value Number Average Value
LOANS ORIGINATED 98 $279,602 104 $288,192 827 $268,356 46 $158,957 41 $165,293 APPLICATIONS APPROVED, NOT ACCEPTED 10 $294,700 15 $258,400 77 $299,727 4 $110,250 9 $187,333 APPLICATIONS DENIED 20 $284,400 23 $305,261 205 $302,444 17 $109,294 32 $252,625 APPLICATIONS WITHDRAWN 18 $278,222 18 $269,833 159 $280,679 19 $125,842 8 $106,625 FILES CLOSED FOR INCOMPLETENESS 5 $203,400 2 $402,000 42 $292,881 3 $111,667 4 $163,250
Aggregated Statistics For Year 2008(Based on 6 full tracts) A) FHA, FSA/RHS & VA B) Conventional C) Refinancings D) Home Improvement Loans E) Loans on Dwellings For 5+ Families F) Non-occupant Loans on G) Loans On Manufactured Number Average Value Number Average Value Number Average Value Number Average Value Number Average Value Number Average Value Number Average Value
LOANS ORIGINATED 57 $294,246 201 $291,478 373 $284,558 55 $95,491 1 $3,742,000 58 $210,897 0 $0 APPLICATIONS APPROVED, NOT ACCEPTED 1 $253,000 33 $318,242 79 $281,570 12 $91,167 1 $4,600,000 10 $229,200 0 $0 APPLICATIONS DENIED 14 $285,429 40 $308,250 220 $296,682 39 $123,333 0 $0 43 $303,163 5 $68,800 APPLICATIONS WITHDRAWN 11 $258,000 42 $277,571 118 $312,602 16 $197,188 0 $0 20 $206,450 0 $0 FILES CLOSED FOR INCOMPLETENESS 1 $128,000 5 $316,800 17 $299,176 3 $99,667 0 $0 5 $283,400 0 $0
Aggregated Statistics For Year 2007(Based on 6 full tracts) A) FHA, FSA/RHS & VA B) Conventional C) Refinancings D) Home Improvement Loans E) Loans on Dwellings For 5+ Families F) Non-occupant Loans on G) Loans On Manufactured Number Average Value Number Average Value Number Average Value Number Average Value Number Average Value Number Average Value Number Average Value
LOANS ORIGINATED 5 $268,000 308 $313,844 643 $292,636 131 $127,511 3 $1,186,667 95 $273,916 1 $191,000 APPLICATIONS APPROVED, NOT ACCEPTED 1 $336,000 55 $265,855 117 $317,026 23 $119,348 0 $0 16 $235,875 2 $28,500 APPLICATIONS DENIED 1 $345,000 84 $313,560 356 $352,208 50 $125,280 1 $875,000 57 $291,018 1 $92,000 APPLICATIONS WITHDRAWN 0 $0 42 $291,714 158 $290,291 23 $198,522 0 $0 7 $184,857 0 $0 FILES CLOSED FOR INCOMPLETENESS 0 $0 10 $281,200 49 $351,265 3 $216,333 0 $0 0 $0 0 $0
Aggregated Statistics For Year 2006(Based on 6 full tracts) A) FHA, FSA/RHS & VA B) Conventional C) Refinancings D) Home Improvement Loans E) Loans on Dwellings For 5+ Families F) Non-occupant Loans on G) Loans On Manufactured Number Average Value Number Average Value Number Average Value Number Average Value Number Average Value Number Average Value Number Average Value
LOANS ORIGINATED 3 $235,000 347 $314,755 865 $298,464 199 $142,171 7 $2,621,143 114 $275,228 1 $228,000 APPLICATIONS APPROVED, NOT ACCEPTED 0 $0 77 $311,312 129 $314,264 31 $144,161 0 $0 39 $252,128 1 $14,000 APPLICATIONS DENIED 0 $0 132 $308,030 339 $314,156 73 $169,589 0 $0 49 $284,980 2 $72,500 APPLICATIONS WITHDRAWN 1 $269,000 83 $280,470 239 $307,008 32 $183,094 0 $0 29 $303,276 0 $0 FILES CLOSED FOR INCOMPLETENESS 0 $0 19 $365,474 65 $338,138 7 $268,429 0 $0 5 $342,200 0 $0
Aggregated Statistics For Year 2005(Based on 6 full tracts) A) FHA, FSA/RHS & VA B) Conventional C) Refinancings D) Home Improvement Loans E) Loans on Dwellings For 5+ Families F) Non-occupant Loans on G) Loans On Manufactured Number Average Value Number Average Value Number Average Value Number Average Value Number Average Value Number Average Value Number Average Value
LOANS ORIGINATED 3 $289,333 657 $310,311 1,206 $291,918 221 $164,376 5 $1,114,800 182 $269,401 3 $107,000 APPLICATIONS APPROVED, NOT ACCEPTED 0 $0 104 $298,740 147 $294,741 29 $157,414 0 $0 16 $282,625 4 $71,000 APPLICATIONS DENIED 0 $0 152 $301,770 316 $328,788 78 $162,500 0 $0 40 $302,975 3 $72,667 APPLICATIONS WITHDRAWN 3 $203,000 120 $294,783 343 $294,790 43 $222,000 3 $6,083,667 36 $265,333 0 $0 FILES CLOSED FOR INCOMPLETENESS 0 $0 26 $304,115 110 $318,100 5 $217,200 0 $0 4 $295,250 1 $183,000
Aggregated Statistics For Year 2004(Based on 6 full tracts) A) FHA, FSA/RHS & VA B) Conventional C) Refinancings D) Home Improvement Loans E) Loans on Dwellings For 5+ Families F) Non-occupant Loans on G) Loans On Manufactured Number Average Value Number Average Value Number Average Value Number Average Value Number Average Value Number Average Value Number Average Value
LOANS ORIGINATED 6 $227,000 714 $269,272 1,423 $250,165 186 $118,720 3 $8,322,000 166 $221,669 1 $145,000 APPLICATIONS APPROVED, NOT ACCEPTED 0 $0 99 $251,889 161 $255,981 21 $124,000 0 $0 21 $223,286 3 $144,667 APPLICATIONS DENIED 0 $0 130 $290,092 286 $274,591 71 $161,225 0 $0 47 $232,085 0 $0 APPLICATIONS WITHDRAWN 0 $0 94 $295,915 272 $244,162 39 $142,692 0 $0 21 $225,286 0 $0 FILES CLOSED FOR INCOMPLETENESS 0 $0 22 $208,045 122 $267,516 12 $119,750 0 $0 8 $139,875 0 $0
Aggregated Statistics For Year 2003(Based on 6 full tracts) A) FHA, FSA/RHS & VA B) Conventional C) Refinancings D) Home Improvement Loans E) Loans on Dwellings For 5+ Families F) Non-occupant Loans on Number Average Value Number Average Value Number Average Value Number Average Value Number Average Value Number Average Value
LOANS ORIGINATED 19 $205,053 581 $239,706 2,988 $208,206 116 $58,414 4 $2,257,500 216 $162,782 APPLICATIONS APPROVED, NOT ACCEPTED 4 $169,750 71 $263,479 323 $206,947 26 $50,615 0 $0 40 $174,875 APPLICATIONS DENIED 4 $198,250 79 $235,861 381 $213,312 42 $58,048 0 $0 29 $166,448 APPLICATIONS WITHDRAWN 5 $202,000 92 $266,380 426 $211,143 10 $66,900 0 $0 38 $220,079 FILES CLOSED FOR INCOMPLETENESS 2 $189,500 18 $207,611 87 $223,816 8 $42,375 0 $0 4 $162,750
Aggregated Statistics For Year 2002(Based on 6 full tracts) A) FHA, FSA/RHS & VA B) Conventional C) Refinancings D) Home Improvement Loans E) Loans on Dwellings For 5+ Families F) Non-occupant Loans on Number Average Value Number Average Value Number Average Value Number Average Value Number Average Value Number Average Value
LOANS ORIGINATED 52 $183,404 670 $219,693 2,278 $200,257 116 $71,802 3 $3,572,667 139 $160,432 APPLICATIONS APPROVED, NOT ACCEPTED 6 $144,167 56 $229,357 227 $206,670 15 $46,000 1 $1,575,000 18 $144,389 APPLICATIONS DENIED 5 $183,800 86 $193,977 326 $187,632 34 $59,000 2 $432,000 11 $137,273 APPLICATIONS WITHDRAWN 6 $148,667 75 $193,867 296 $214,105 8 $50,750 1 $6,175,000 23 $192,000 FILES CLOSED FOR INCOMPLETENESS 3 $161,667 25 $224,640 51 $175,686 2 $20,000 0 $0 9 $169,889
Aggregated Statistics For Year 2001(Based on 6 full tracts) A) FHA, FSA/RHS & VA B) Conventional C) Refinancings D) Home Improvement Loans E) Loans on Dwellings For 5+ Families F) Non-occupant Loans on Number Average Value Number Average Value Number Average Value Number Average Value Number Average Value Number Average Value
LOANS ORIGINATED 46 $127,435 531 $185,006 1,616 $187,585 83 $53,494 4 $758,500 98 $126,224 APPLICATIONS APPROVED, NOT ACCEPTED 1 $125,000 55 $170,836 173 $180,110 18 $50,500 0 $0 4 $125,250 APPLICATIONS DENIED 6 $135,833 62 $153,516 312 $165,087 33 $40,424 0 $0 12 $94,417 APPLICATIONS WITHDRAWN 3 $161,667 68 $166,779 276 $175,399 36 $65,028 0 $0 15 $151,667 FILES CLOSED FOR INCOMPLETENESS 2 $138,500 10 $166,800 67 $150,448 2 $28,500 0 $0 3 $134,333
Aggregated Statistics For Year 2000(Based on 6 full tracts) A) FHA, FSA/RHS & VA B) Conventional C) Refinancings D) Home Improvement Loans E) Loans on Dwellings For 5+ Families F) Non-occupant Loans on Number Average Value Number Average Value Number Average Value Number Average Value Number Average Value Number Average Value
LOANS ORIGINATED 70 $131,143 591 $167,607 331 $145,716 87 $50,529 5 $1,951,600 60 $119,283 APPLICATIONS APPROVED, NOT ACCEPTED 10 $93,800 37 $147,946 62 $140,597 27 $33,259 0 $0 10 $144,600 APPLICATIONS DENIED 4 $115,750 79 $166,835 160 $162,725 37 $45,216 3 $2,246,000 9 $183,333 APPLICATIONS WITHDRAWN 7 $131,714 55 $173,327 88 $132,148 8 $43,000 0 $0 8 $121,625 FILES CLOSED FOR INCOMPLETENESS 4 $170,500 15 $156,267 19 $150,526 3 $46,667 1 $1,916,000 2 $90,000
Aggregated Statistics For Year 1999(Based on 5 full and 1 partial tracts) A) FHA, FSA/RHS & VA B) Conventional C) Refinancings D) Home Improvement Loans E) Loans on Dwellings For 5+ Families F) Non-occupant Loans on Number Average Value Number Average Value Number Average Value Number Average Value Number Average Value Number Average Value
LOANS ORIGINATED 101 $126,650 509 $158,518 713 $164,120 99 $38,964 4 $2,662,048 85 $115,494 APPLICATIONS APPROVED, NOT ACCEPTED 3 $111,607 56 $183,105 112 $148,548 29 $24,823 0 $0 12 $167,225 APPLICATIONS DENIED 5 $131,010 63 $165,009 206 $355,325 35 $31,309 0 $0 21 $139,633 APPLICATIONS WITHDRAWN 8 $117,630 59 $153,201 153 $156,838 10 $39,591 1 $223,070 13 $129,085 FILES CLOSED FOR INCOMPLETENESS 0 $0 7 $152,131 47 $153,691 2 $86,180 0 $0 3 $126,263
Detailed HMDA statistics for the following Tracts:
0080.05
, 0080.06 , 0080.07 , 0080.08 , 0080.09 , 0080.10
Private Mortgage Insurance Companies Aggregated Statistics For Year 2009(Based on 6 full tracts) A) Conventional B) Refinancings C) Non-occupant Loans on Number Average Value Number Average Value Number Average Value
LOANS ORIGINATED 15 $289,933 11 $328,636 1 $410,000 APPLICATIONS APPROVED, NOT ACCEPTED 8 $287,875 1 $335,000 0 $0 APPLICATIONS DENIED 2 $170,000 4 $366,500 0 $0 APPLICATIONS WITHDRAWN 5 $242,200 1 $407,000 0 $0 FILES CLOSED FOR INCOMPLETENESS 0 $0 0 $0 0 $0
Aggregated Statistics For Year 2008(Based on 6 full tracts) A) Conventional B) Refinancings C) Non-occupant Loans on Number Average Value Number Average Value Number Average Value
LOANS ORIGINATED 44 $310,159 12 $358,083 4 $213,000 APPLICATIONS APPROVED, NOT ACCEPTED 24 $348,875 11 $382,000 0 $0 APPLICATIONS DENIED 10 $285,900 6 $340,167 7 $255,571 APPLICATIONS WITHDRAWN 4 $241,000 1 $247,000 2 $261,500 FILES CLOSED FOR INCOMPLETENESS 0 $0 0 $0 0 $0
Aggregated Statistics For Year 2007(Based on 6 full tracts) A) Conventional B) Refinancings C) Non-occupant Loans on Number Average Value Number Average Value Number Average Value
LOANS ORIGINATED 36 $315,500 18 $346,944 6 $300,000 APPLICATIONS APPROVED, NOT ACCEPTED 4 $299,500 1 $442,000 0 $0 APPLICATIONS DENIED 0 $0 1 $442,000 0 $0 APPLICATIONS WITHDRAWN 3 $376,000 0 $0 0 $0 FILES CLOSED FOR INCOMPLETENESS 1 $500,000 0 $0 0 $0
Aggregated Statistics For Year 2006(Based on 6 full tracts) A) Conventional B) Refinancings C) Non-occupant Loans on Number Average Value Number Average Value Number Average Value
LOANS ORIGINATED 11 $347,818 6 $454,333 1 $243,000 APPLICATIONS APPROVED, NOT ACCEPTED 2 $650,000 2 $437,000 0 $0 APPLICATIONS DENIED 0 $0 1 $374,000 0 $0 APPLICATIONS WITHDRAWN 0 $0 1 $318,000 0 $0 FILES CLOSED FOR INCOMPLETENESS 0 $0 0 $0 0 $0
Aggregated Statistics For Year 2005(Based on 6 full tracts) A) Conventional B) Refinancings C) Non-occupant Loans on Number Average Value Number Average Value Number Average Value
LOANS ORIGINATED 18 $375,111 13 $354,308 6 $281,833 APPLICATIONS APPROVED, NOT ACCEPTED 1 $332,000 1 $595,000 1 $332,000 APPLICATIONS DENIED 0 $0 0 $0 0 $0 APPLICATIONS WITHDRAWN 0 $0 1 $463,000 0 $0 FILES CLOSED FOR INCOMPLETENESS 0 $0 0 $0 0 $0
Aggregated Statistics For Year 2004(Based on 6 full tracts) A) Conventional B) Refinancings C) Non-occupant Loans on Number Average Value Number Average Value Number Average Value
LOANS ORIGINATED 28 $291,500 13 $336,615 9 $248,889 APPLICATIONS APPROVED, NOT ACCEPTED 8 $213,000 11 $269,000 2 $225,000 APPLICATIONS DENIED 2 $347,000 1 $428,000 0 $0 APPLICATIONS WITHDRAWN 0 $0 0 $0 0 $0 FILES CLOSED FOR INCOMPLETENESS 0 $0 1 $173,000 0 $0
Aggregated Statistics For Year 2003(Based on 6 full tracts) A) Conventional B) Refinancings C) Non-occupant Loans on Number Average Value Number Average Value Number Average Value
LOANS ORIGINATED 69 $239,159 53 $244,321 9 $228,667 APPLICATIONS APPROVED, NOT ACCEPTED 10 $209,500 27 $232,815 1 $139,000 APPLICATIONS DENIED 0 $0 1 $261,000 1 $261,000 APPLICATIONS WITHDRAWN 3 $254,333 3 $273,333 2 $262,500 FILES CLOSED FOR INCOMPLETENESS 0 $0 0 $0 0 $0
Aggregated Statistics For Year 2002(Based on 6 full tracts) A) Conventional B) Refinancings C) Non-occupant Loans on Number Average Value Number Average Value Number Average Value
LOANS ORIGINATED 91 $219,549 41 $217,098 6 $201,167 APPLICATIONS APPROVED, NOT ACCEPTED 13 $263,692 14 $189,071 0 $0 APPLICATIONS DENIED 3 $224,000 1 $297,000 0 $0 APPLICATIONS WITHDRAWN 1 $194,000 3 $213,000 1 $194,000 FILES CLOSED FOR INCOMPLETENESS 1 $167,000 0 $0 1 $167,000
Aggregated Statistics For Year 2001(Based on 6 full tracts) A) Conventional B) Refinancings C) Non-occupant Loans on Number Average Value Number Average Value Number Average Value
LOANS ORIGINATED 99 $208,253 72 $197,681 6 $100,000 APPLICATIONS APPROVED, NOT ACCEPTED 15 $186,467 12 $182,250 3 $127,000 APPLICATIONS DENIED 1 $208,000 2 $208,500 1 $208,000 APPLICATIONS WITHDRAWN 3 $162,667 0 $0 0 $0 FILES CLOSED FOR INCOMPLETENESS 0 $0 0 $0 0 $0
Aggregated Statistics For Year 2000(Based on 6 full tracts) A) Conventional B) Refinancings C) Non-occupant Loans on Number Average Value Number Average Value Number Average Value
LOANS ORIGINATED 119 $192,756 31 $221,065 9 $148,889 APPLICATIONS APPROVED, NOT ACCEPTED 19 $206,263 3 $198,000 2 $151,500 APPLICATIONS DENIED 2 $152,000 0 $0 1 $84,000 APPLICATIONS WITHDRAWN 4 $222,500 1 $182,000 2 $192,500 FILES CLOSED FOR INCOMPLETENESS 0 $0 0 $0 0 $0
Aggregated Statistics For Year 1999(Based on 5 full and 1 partial tracts) A) Conventional B) Refinancings C) Non-occupant Loans on Number Average Value Number Average Value Number Average Value
LOANS ORIGINATED 138 $185,409 70 $179,001 4 $92,735 APPLICATIONS APPROVED, NOT ACCEPTED 15 $169,915 8 $180,309 2 $112,705 APPLICATIONS DENIED 5 $131,466 2 $288,465 1 $82,290 APPLICATIONS WITHDRAWN 5 $128,506 2 $216,025 2 $126,435 FILES CLOSED FOR INCOMPLETENESS 5 $219,212 7 $175,534 1 $225,050
Detailed PMIC statistics for the following Tracts:
0080.05
, 0080.06 , 0080.07 , 0080.08 , 0080.09 , 0080.10
Most common first names in Fair Oaks, CA among deceased individuals Name Count Lived (average)
Mary 202 80.3 years William 155 71.8 years John 154 72.9 years Robert 138 71.7 years James 118 69.5 years Helen 106 82.8 years George 96 77.5 years Charles 95 76.7 years Ruth 76 80.6 years Donald 76 71.9 years
Most common last names in Fair Oaks, CA among deceased individuals Last name Count Lived (average)
Smith 76 73.8 years Johnson 60 73.4 years Jones 41 76.7 years Brown 38 76.9 years Davis 34 77.0 years Miller 33 74.6 years Wilson 32 79.0 years Williams 30 72.0 years Martin 27 74.6 years Anderson 27 75.1 years
Fair Oaks compared to California state average:
Unemployed percentage significantly below state average. Black race population percentage below state average. Hispanic race population percentage below state average. Median age significantly above state average. Foreign-born population percentage significantly below state average. Length of stay since moving in above state average. Number of rooms per house above state average. Percentage of population with a bachelor's degree or higher above state average.
#90 on the list of "Top 101 cities where residents moved in more then 10 years ago (10,000+ households)"
#12 on the list of "Top 101 counties with the highest percentage of residents that drank alcohol in the past 30 days"
#18 on the list of "Top 101 counties with the highest ground withdrawal of fresh water for public supply"
#19 on the list of "Top 101 counties with the highest total withdrawal of fresh water for public supply"
#23 on the list of "Top 101 counties with the most Other adherents"
#25 on the list of "Top 101 counties with the most Other congregations (pop. 50,000+)"
Top Patent Applicants
Michael J. Eberle (17)
Lance W. Dover (12)
Jason Aron Alonzo (11)
Sidharth Dalmia (10)
Maciej Chichlowski (9)
Diana Margaret Tasker (8)
Loren M. Koehler (7)
Evan Carl White (6)
Adrian Cowham (5)
Ryan Olivera (5)
Total of 203 patent applications in 2008-2024.


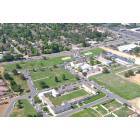

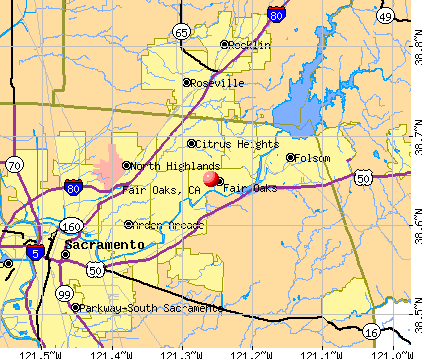


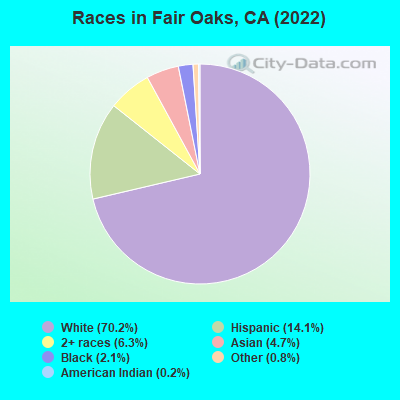
 Recent articles from our blog. Our writers, many of them Ph.D. graduates or candidates, create easy-to-read articles on a wide variety of topics.

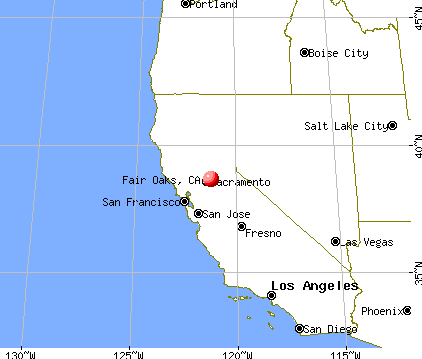
 (3.4 miles
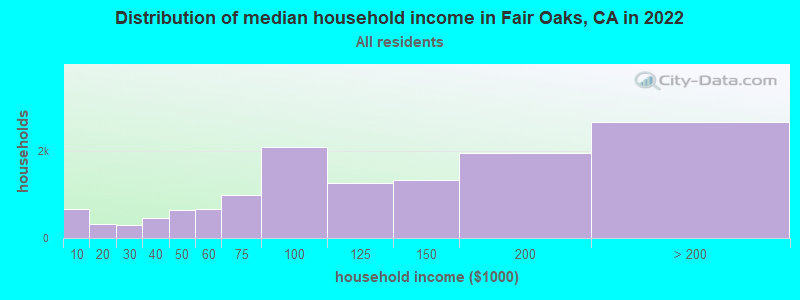
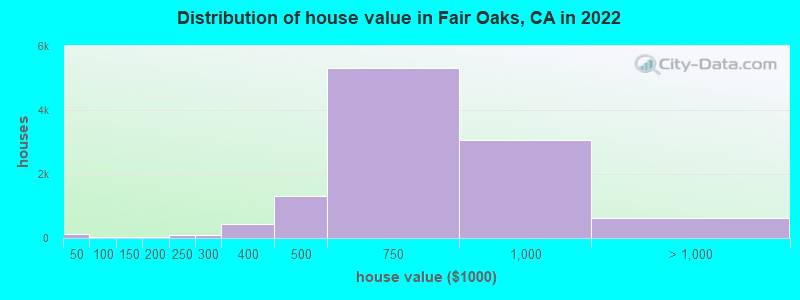

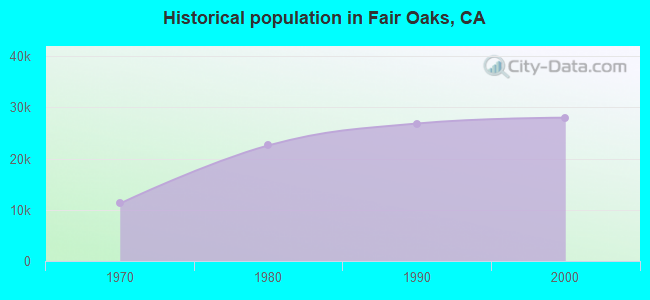
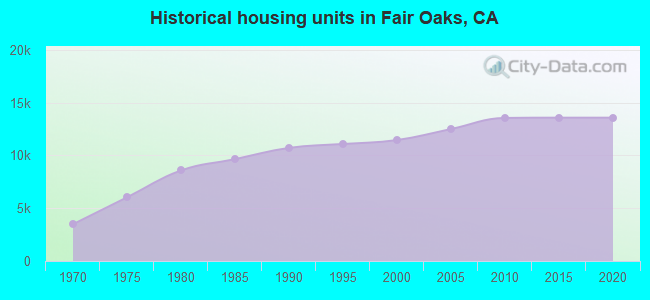
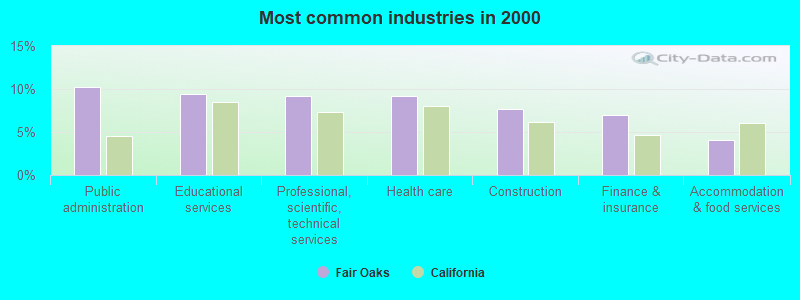
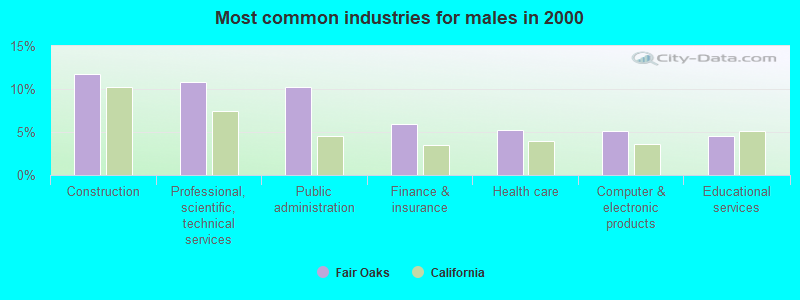
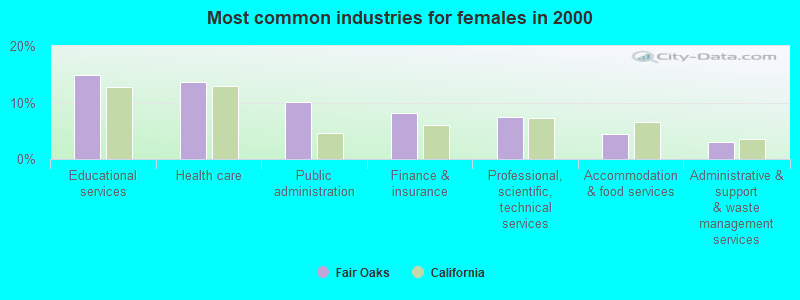
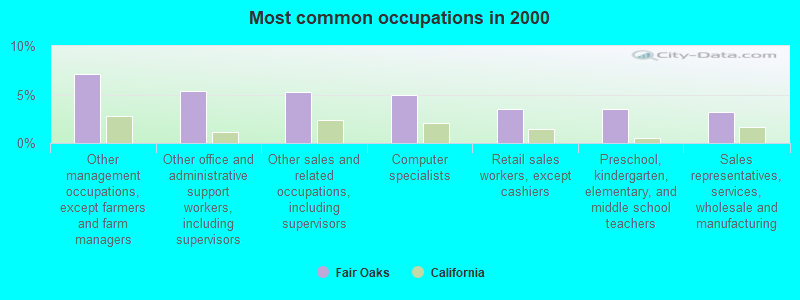
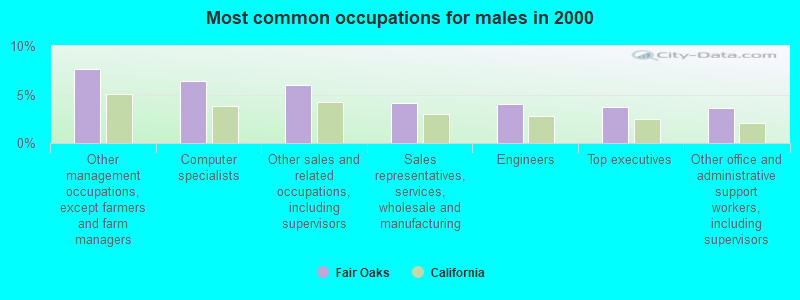
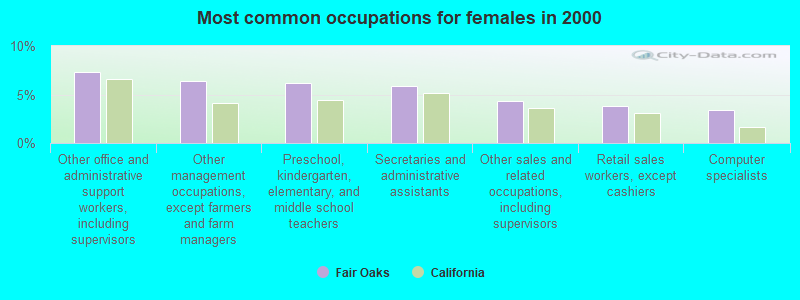
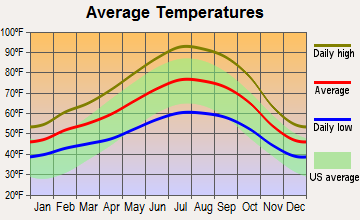
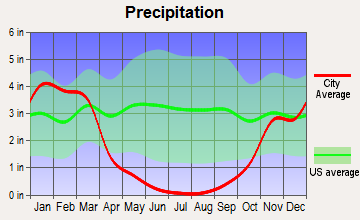
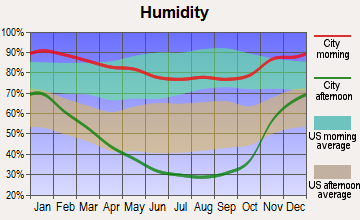
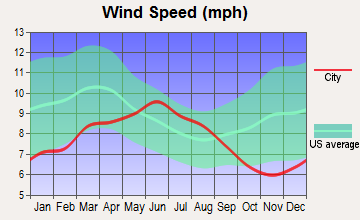
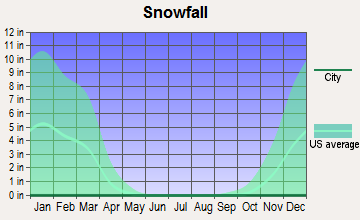
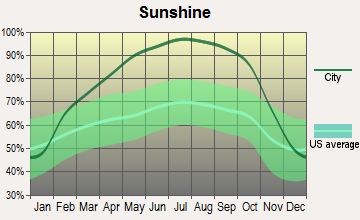
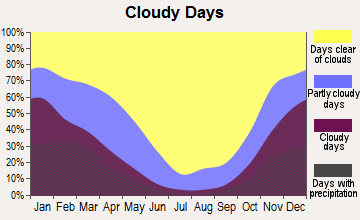
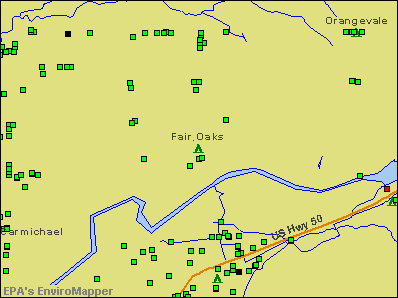

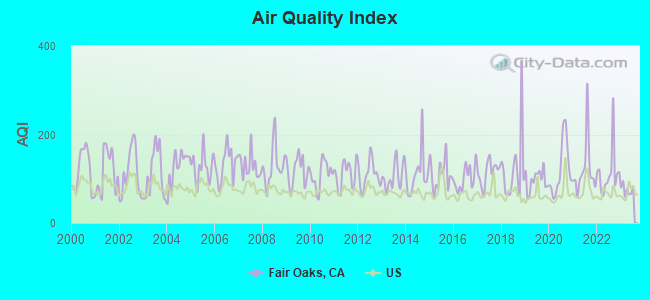
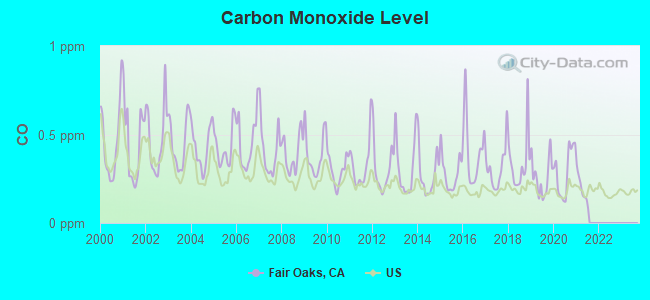
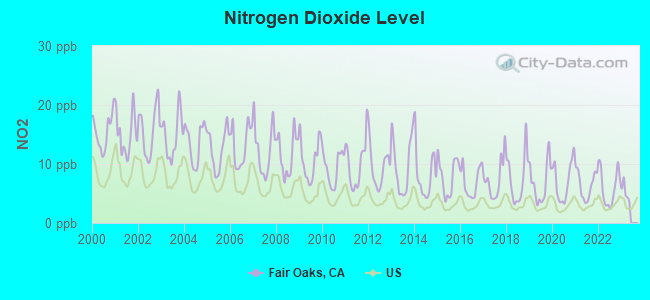
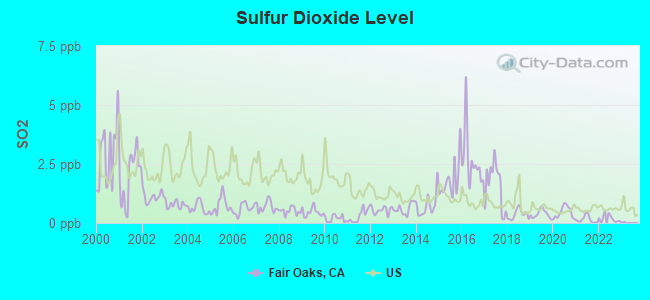
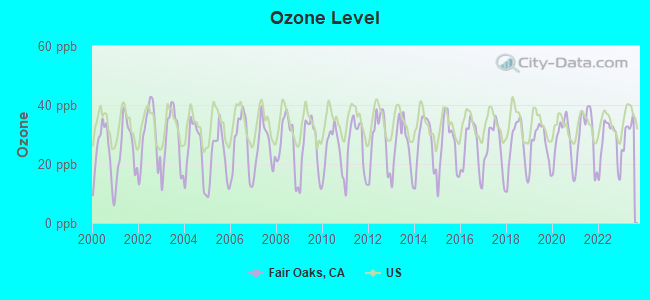
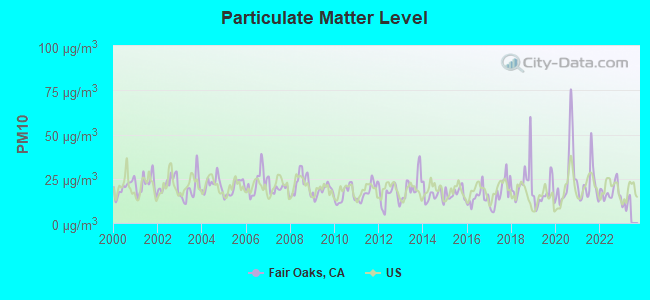
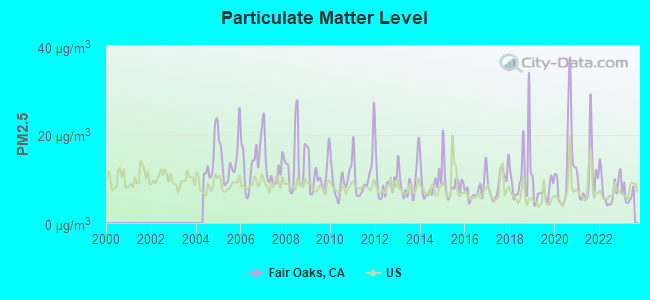
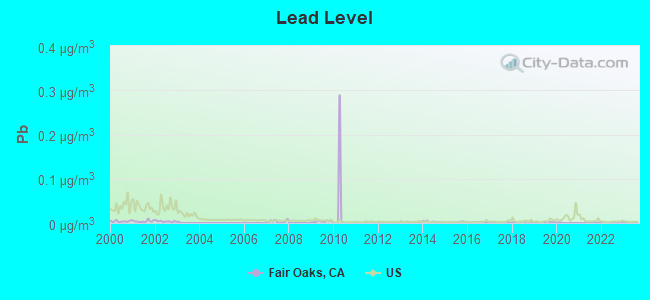

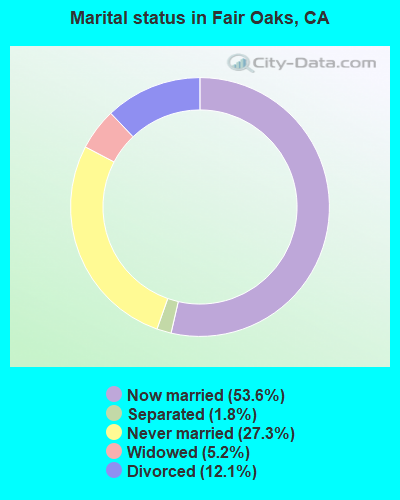
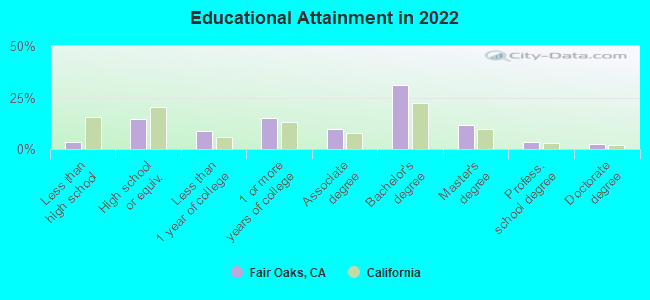
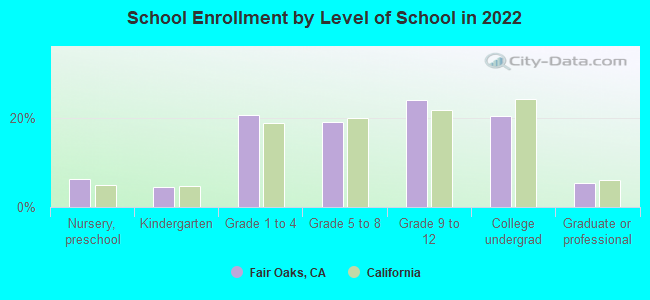
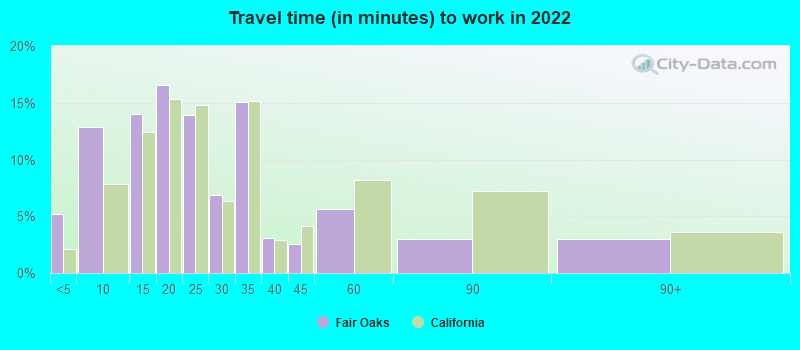
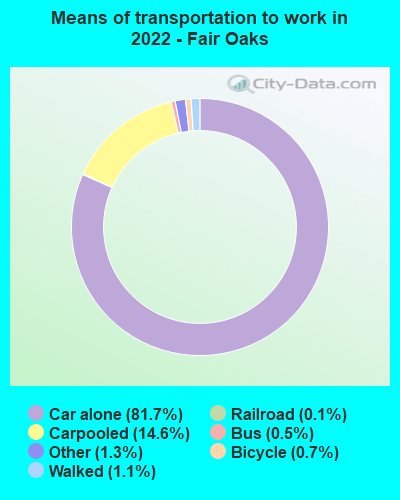
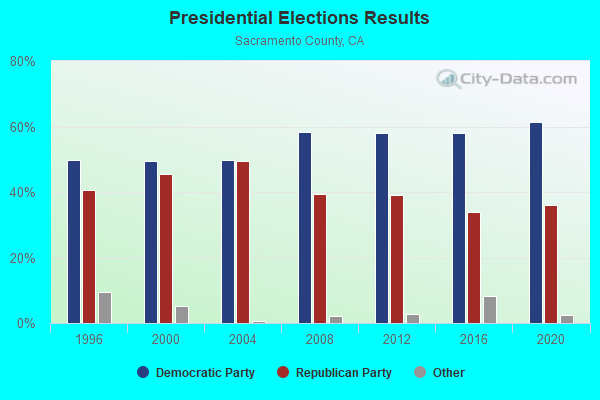
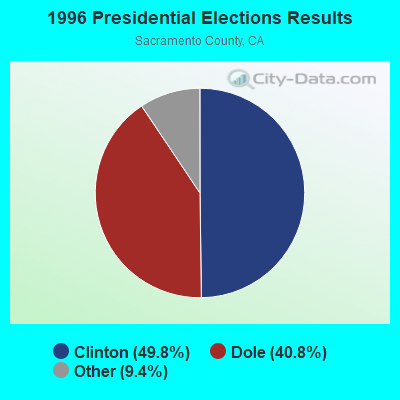
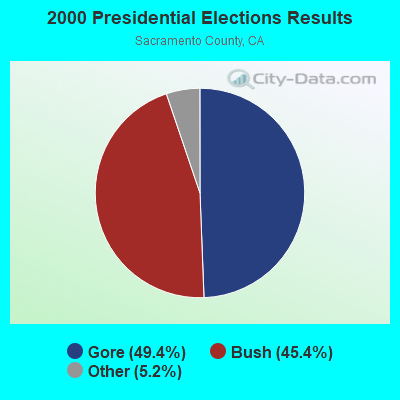
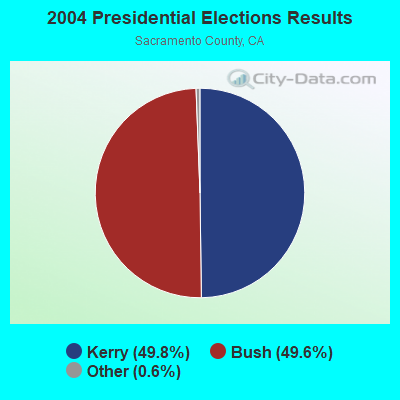
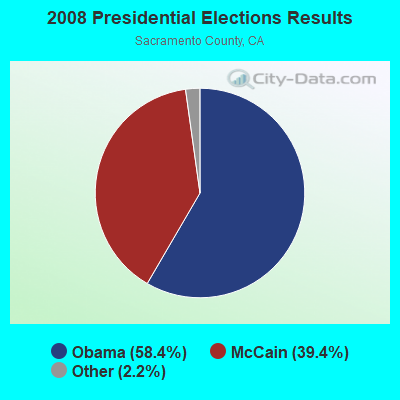
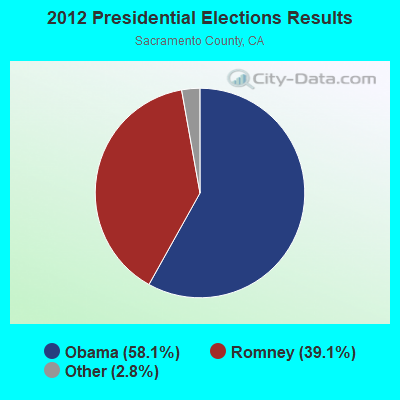
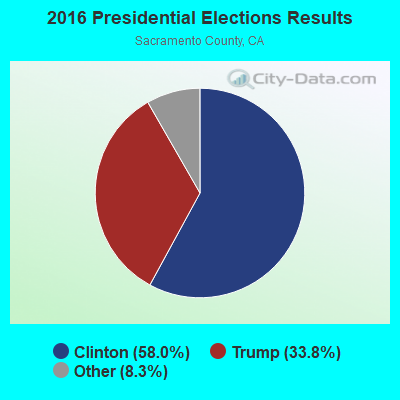
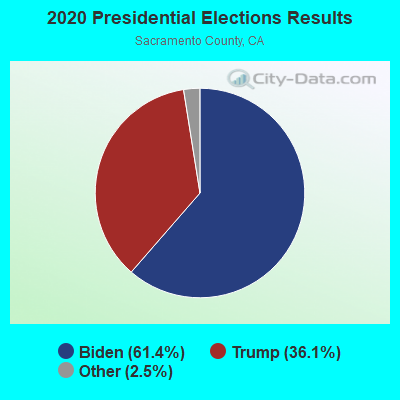
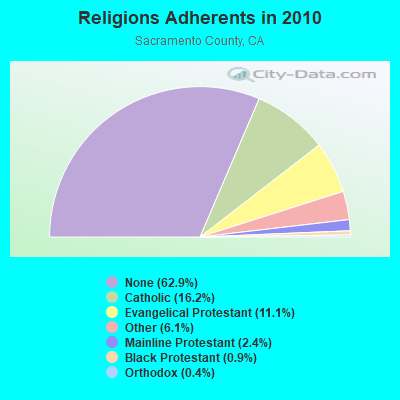
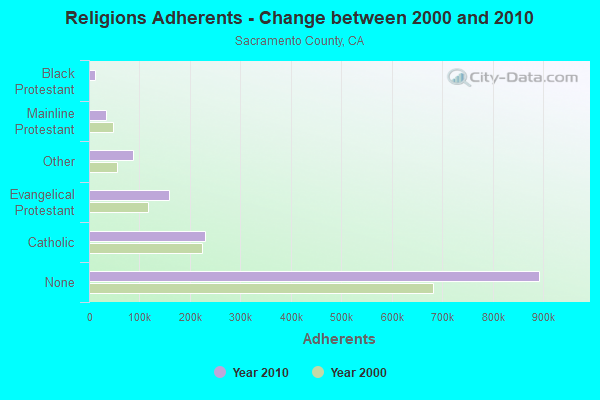
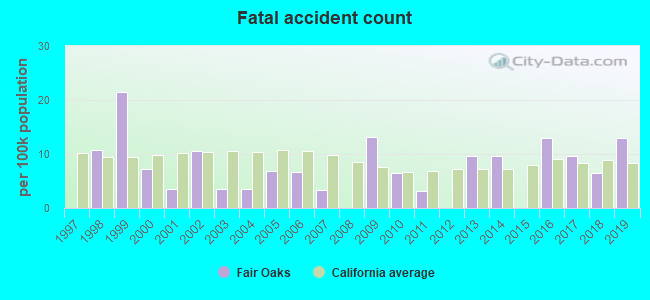
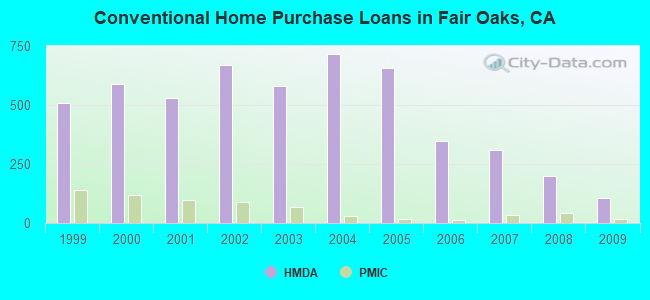
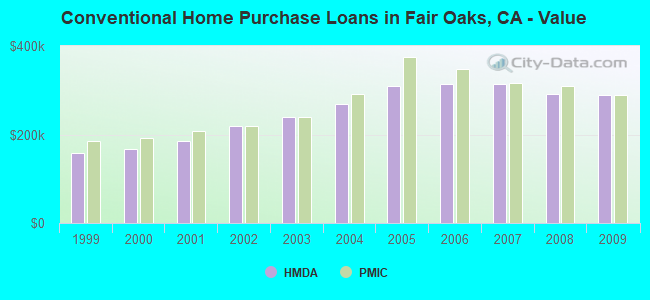
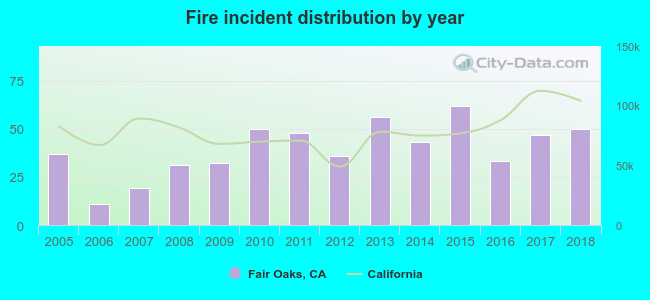 According to the data from the years 2005 - 2018 the average number of fires per year is 40. The highest number of reported fire incidents - 62 took place in 2015, and the least - 11 in 2006. The data has a growing trend.
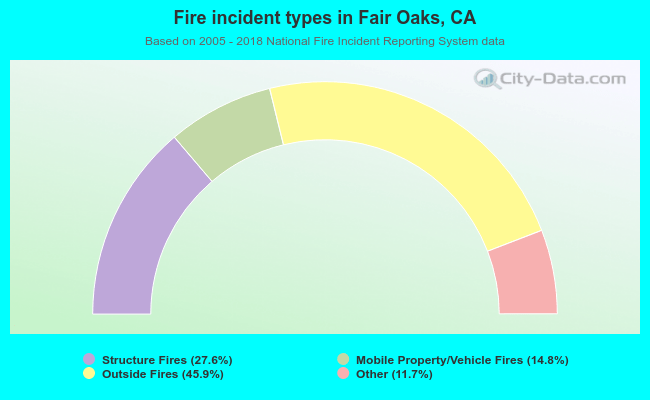 When looking into fire subcategories, the most incidents belonged to: Outside Fires (45.9%), and Structure Fires (27.6%).