Estimated zip code population in 2022: 43,888 Zip code population in 2010: 40,196 Zip code population in 2000: 40,739
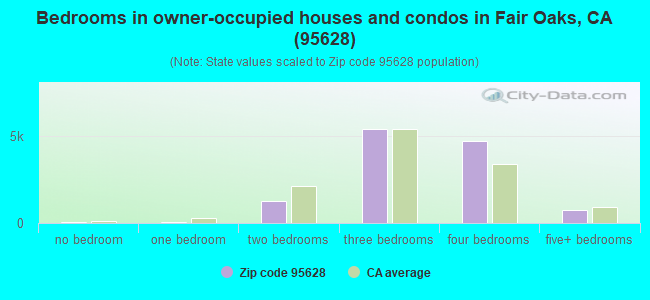
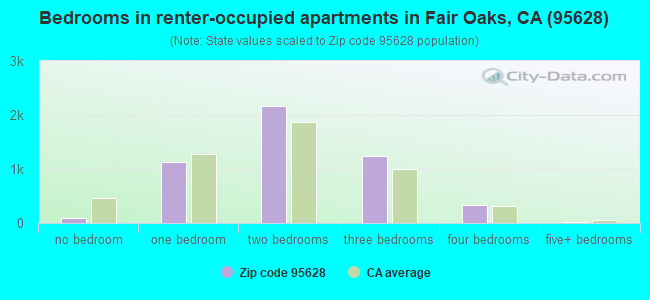
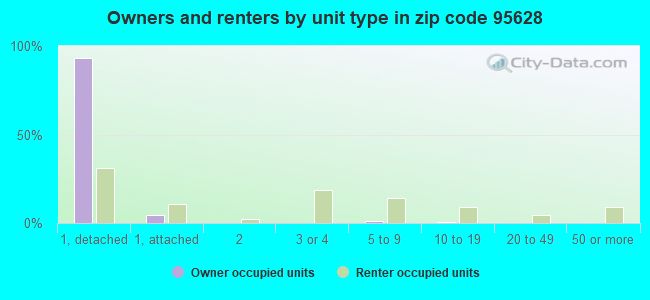
Houses and condos: 17,756 Renter-occupied apartments: 5,006
% of renters here:
29%
State:
44%
March 2022 cost of living index in zip code 95628: 101.9 (near average, U.S. average is 100)
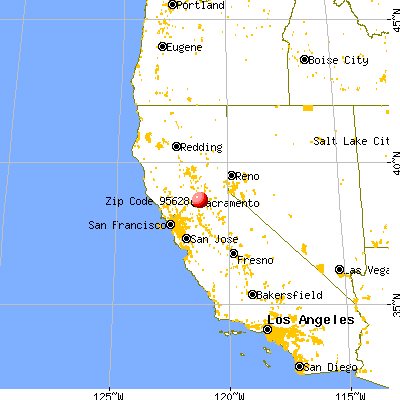
Land area: 12.8 sq. mi. Water area: 0.5 sq. mi.
Population density: 3,440 people per square mile
(average).
OSM Map
General Map
Google Map
MSN Map
OSM Map
General Map
Google Map
MSN Map
OSM Map
General Map
Google Map
MSN Map
OSM Map
General Map
Google Map
MSN Map
Please wait while loading the map...
Real estate property taxes paid for housing units in 2022:
This zip code:
0.7% ($4,344)
California:
0.7% ($4,831)
Median real estate property taxes paid for housing units with mortgages in 2022: $4,592 (0.7%) Median real estate property taxes paid for housing units with no mortgage in 2022: $3,750 (0.6%)
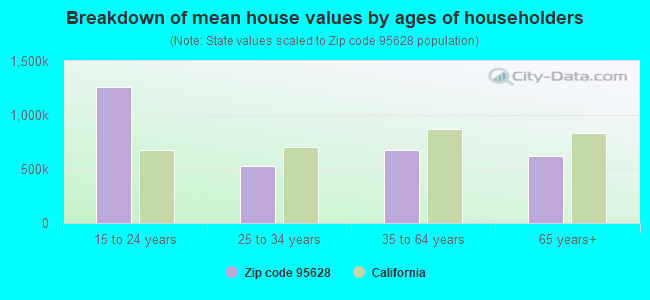
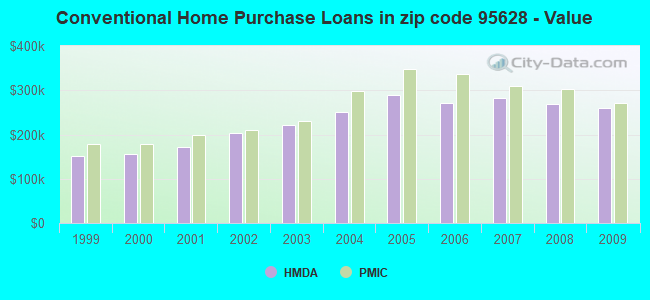
Estimated median house/condo value in 2022: $638,153
95628:
$638,153
California:
$715,900
According to our research of California and other state lists, there were 40 registered sex offenders living in 95628 zip code as of April 27, 2024. The ratio of all residents to sex offenders in zip code 95628 is 1,056 to 1. The ratio of registered sex offenders to all residents in this zip code is lower than the state average.
Median resident age:
This zip code:
43.7 years
California median age:
37.9 years
Average household size:
This zip code:
2.5 people
California:
2.8 people
Averages for the 2020 tax year for zip code 95628, filed in 2021:
Average Adjusted Gross Income (AGI) in 2020: $98,121 (Individual Income Tax Returns)
Here:
$98,121
State:
$95,910
Salary/wage: $79,968 (reported on 73.6% of returns)
Here:
$79,968
State:
$77,331
(% of AGI for various income ranges: 1153.4% for AGIs below $25k, 3680.2% for AGIs $25k-50k, 6817.2% for AGIs $50k-75k, 9399.3% for AGIs $75k-100k, 18679.1% for AGIs $100k-200k, 79436.2% for AGIs over 200k)
Taxable interest for individuals: $1,614 (reported on 49.7% of returns)
This zip code:
$1,614
California:
$2,294
(% of AGI for various income ranges: 24.8% for AGIs below $25k, 38.9% for AGIs $25k-50k, 62.9% for AGIs $50k-75k, 120.5% for AGIs $75k-100k, 205.6% for AGIs $100k-200k, 1404.3% for AGIs over 200k)
Ordinary dividends: $7,675 (reported on 26.7% of returns)
Here:
$7,675
State:
$10,949
(% of AGI for various income ranges: 49.6% for AGIs below $25k, 71.5% for AGIs $25k-50k, 132.7% for AGIs $50k-75k, 240.2% for AGIs $75k-100k, 482.6% for AGIs $100k-200k, 4236.0% for AGIs over 200k)
Net capital gain/loss in AGI: +$27,261 (reported on 25.6% of returns)
Here:
+$27,261
State:
+$49,306
(% of AGI for various income ranges: 13.2% for AGIs below $25k, 39.5% for AGIs $25k-50k, 137.0% for AGIs $50k-75k, 293.1% for AGIs $75k-100k, 675.0% for AGIs $100k-200k, 22547.9% for AGIs over 200k)
Profit/loss from business: +$19,283 (reported on 18.0% of returns)
Here:
+$19,283
State:
+$15,671
(% of AGI for various income ranges: 161.8% for AGIs below $25k, 273.4% for AGIs $25k-50k, 350.4% for AGIs $50k-75k, 396.4% for AGIs $75k-100k, 862.6% for AGIs $100k-200k, 5366.4% for AGIs over 200k)
Taxable individual retirement arrangement distribution: $22,123 (reported on 12.3% of returns)
95628:
$22,123
California:
$23,505
(% of AGI for various income ranges: 81.0% for AGIs below $25k, 149.7% for AGIs $25k-50k, 225.3% for AGIs $50k-75k, 542.2% for AGIs $75k-100k, 1079.9% for AGIs $100k-200k, 2778.1% for AGIs over 200k)
Self-employed (Keogh) retirement plans: $22,004 (reported on 1.2% of returns)
95628:
$22,004
California:
$30,163
(% of AGI for various income ranges: 3.4% for AGIs below $25k, 20.5% for AGIs $50k-75k, 68.6% for AGIs $100k-200k, 620.9% for AGIs over 200k)
Total itemized deductions: $32,321 (reported on 19.1% of returns)
Here:
$32,321
State:
$39,517
(% of AGI for various income ranges: 140.8% for AGIs below $25k, 287.0% for AGIs $25k-50k, 616.0% for AGIs $50k-75k, 1181.4% for AGIs $75k-100k, 2081.2% for AGIs $100k-200k, 8029.8% for AGIs over 200k)
Charity contributions: $7,148 (reported on 15.8% of returns)
Here:
$7,148
State:
$12,598
(% of AGI for various income ranges: 6.8% for AGIs below $25k, 29.3% for AGIs $25k-50k, 74.7% for AGIs $50k-75k, 121.3% for AGIs $75k-100k, 352.1% for AGIs $100k-200k, 2170.2% for AGIs over 200k)
Taxes paid: $8,559 (reported on 19.1% of returns)
95628:
$8,559
State:
$8,807
(% of AGI for various income ranges: 22.5% for AGIs below $25k, 56.1% for AGIs $25k-50k, 160.4% for AGIs $50k-75k, 358.6% for AGIs $75k-100k, 650.8% for AGIs $100k-200k, 1807.8% for AGIs over 200k)
Earned income credit: $1,677 (reported on 8.6% of returns)
Here:
$1,677
State:
$2,074
(% of AGI for various income ranges: 59.5% for AGIs below $25k, 43.6% for AGIs $25k-50k)
Percentage of individuals using paid preparers for their 2020 taxes: 92.6%
Here:
93%
State:
92%
(% for various income ranges: 91.3% for AGIs below $25k, 92.8% for AGIs $25k-50k, 92.4% for AGIs $50k-75k, 92.9% for AGIs $75k-100k, 92.8% for AGIs $100k-200k, 94.3% for AGIs over 200k)
Averages for the 2012 tax year for zip code 95628, filed in 2013:
Average Adjusted Gross Income (AGI) in 2012: $76,347 (Individual Income Tax Returns)
Here:
$76,347
State:
$72,726
Salary/wage: $63,198 (reported on 75.6% of returns)
Here:
$63,198
State:
$59,079
(% of AGI for various income ranges: 65.2% for AGIs below $25k, 69.2% for AGIs $25k-50k, 64.9% for AGIs $50k-75k, 64.6% for AGIs $75k-100k, 66.7% for AGIs $100k-200k, 53.5% for AGIs over 200k)
Taxable interest for individuals: $1,466 (reported on 49.7% of returns)
This zip code:
$1,466
California:
$2,146
(% of AGI for various income ranges: 1.5% for AGIs below $25k, 0.8% for AGIs $25k-50k, 0.8% for AGIs $50k-75k, 1.0% for AGIs $75k-100k, 0.8% for AGIs $100k-200k, 1.1% for AGIs over 200k)
Ordinary dividends: $4,960 (reported on 27.4% of returns)
Here:
$4,960
State:
$9,308
(% of AGI for various income ranges: 2.4% for AGIs below $25k, 1.4% for AGIs $25k-50k, 1.5% for AGIs $50k-75k, 1.4% for AGIs $75k-100k, 1.6% for AGIs $100k-200k, 2.3% for AGIs over 200k)
Net capital gain/loss in AGI: +$14,977 (reported on 23.3% of returns)
Here:
+$14,977
State:
+$30,460
(% of AGI for various income ranges: 0.2% for AGIs $25k-50k, 0.3% for AGIs $50k-75k, 0.5% for AGIs $75k-100k, 1.7% for AGIs $100k-200k, 13.4% for AGIs over 200k)
Profit/loss from business: +$19,569 (reported on 18.6% of returns)
Here:
+$19,569
State:
+$17,064
(% of AGI for various income ranges: 11.0% for AGIs below $25k, 5.4% for AGIs $25k-50k, 3.7% for AGIs $50k-75k, 3.4% for AGIs $75k-100k, 3.5% for AGIs $100k-200k, 5.8% for AGIs over 200k)
Taxable individual retirement arrangement distribution: $17,103 (reported on 14.4% of returns)
95628:
$17,103
California:
$19,557
(% of AGI for various income ranges: 4.3% for AGIs below $25k, 3.3% for AGIs $25k-50k, 3.6% for AGIs $50k-75k, 3.7% for AGIs $75k-100k, 3.7% for AGIs $100k-200k, 2.2% for AGIs over 200k)
Self-employment retirement plans: $20,686 (reported on 1.4% of returns)
95628:
$20,686
California:
$24,530
(% of AGI for various income ranges: 0.1% for AGIs $25k-50k, 0.1% for AGIs $50k-75k, 0.3% for AGIs $75k-100k, 0.3% for AGIs $100k-200k, 0.7% for AGIs over 200k)
Total itemized deductions: $28,420 (22% of AGI, reported on 44.6% of returns)
Here:
$28,420
State:
$34,004
Here:
22.2% of AGI
State:
22.7% of AGI
(% of AGI for various income ranges: 17.6% for AGIs below $25k, 13.4% for AGIs $25k-50k, 15.6% for AGIs $50k-75k, 17.7% for AGIs $75k-100k, 18.0% for AGIs $100k-200k, 15.9% for AGIs over 200k)
Charity contributions: $3,656 (reported on 38.6% of returns)
Here:
$3,656
State:
$4,659
(% of AGI for various income ranges: 1.0% for AGIs below $25k, 1.2% for AGIs $25k-50k, 1.6% for AGIs $50k-75k, 2.0% for AGIs $75k-100k, 2.1% for AGIs $100k-200k, 1.9% for AGIs over 200k)
Taxes paid: $10,946 (reported on 44.4% of returns)
95628:
$10,946
State:
$14,448
(% of AGI for various income ranges: 3.0% for AGIs below $25k, 2.7% for AGIs $25k-50k, 4.1% for AGIs $50k-75k, 5.3% for AGIs $75k-100k, 7.1% for AGIs $100k-200k, 8.8% for AGIs over 200k)
Earned income credit: $1,823 (reported on 11.4% of returns)
Here:
$1,823
State:
$2,286
(% of AGI for various income ranges: 4.2% for AGIs below $25k, 0.7% for AGIs $25k-50k)
Percentage of individuals using paid preparers for their 2012 taxes: 52.8%
Here:
53%
State:
64%
(% for various income ranges: 45.8% for AGIs below $25k, 49.2% for AGIs $25k-50k, 53.4% for AGIs $50k-75k, 56.7% for AGIs $75k-100k, 59.8% for AGIs $100k-200k, 74.8% for AGIs over 200k)
Averages for the 2004 tax year for zip code 95628, filed in 2005:
Average Adjusted Gross Income (AGI) in 2004: $68,449 (Individual Income Tax Returns)
Here:
$68,449
State:
$58,600
Salary/wage: $55,345 (reported on 78.2% of returns)
Here:
$55,345
State:
$49,455
(% of AGI for various income ranges: 446.1% for AGIs below $10k, 66.6% for AGIs $10k-25k, 72.2% for AGIs $25k-50k, 69.0% for AGIs $50k-75k, 68.8% for AGIs $75k-100k, 56.9% for AGIs over 100k)
Taxable interest for individuals: $1,896 (reported on 59.4% of returns)
This zip code:
$1,896
California:
$2,365
(% of AGI for various income ranges: 30.5% for AGIs below $10k, 2.6% for AGIs $10k-25k, 1.6% for AGIs $25k-50k, 1.4% for AGIs $50k-75k, 1.6% for AGIs $75k-100k, 1.6% for AGIs over 100k)
Taxable dividends: $3,614 (reported on 33.1% of returns)
Here:
$3,614
State:
$4,746
(% of AGI for various income ranges: 26.1% for AGIs below $10k, 1.8% for AGIs $10k-25k, 1.3% for AGIs $25k-50k, 1.3% for AGIs $50k-75k, 1.4% for AGIs $75k-100k, 2.0% for AGIs over 100k)
Net capital gain/loss: +$16,555 (reported on 28.5% of returns)
Here:
+$16,555
State:
+$23,418
(% of AGI for various income ranges: -8.1% for AGIs below $10k, 0.1% for AGIs $10k-25k, 0.3% for AGIs $25k-50k, 1.2% for AGIs $50k-75k, 1.4% for AGIs $75k-100k, 11.6% for AGIs over 100k)
Profit/loss from business: +$23,648 (reported on 20.1% of returns)
Here:
+$23,648
State:
+$16,826
(% of AGI for various income ranges: 20.4% for AGIs below $10k, 9.1% for AGIs $10k-25k, 6.3% for AGIs $25k-50k, 5.5% for AGIs $50k-75k, 5.4% for AGIs $75k-100k, 7.6% for AGIs over 100k)
IRA payment deduction: $3,347 (reported on 3.5% of returns)
95628:
$3,347
California:
$3,192
(% of AGI for various income ranges: 1.7% for AGIs below $10k, 0.3% for AGIs $10k-25k, 0.3% for AGIs $25k-50k, 0.3% for AGIs $50k-75k, 0.2% for AGIs $75k-100k, 0.1% for AGIs over 100k)
Self-employed pension: $16,308 (reported on 2.8% of returns)
Here:
$16,308
California:
$17,688
(% of AGI for various income ranges: 0.1% for AGIs $10k-25k, 0.3% for AGIs $25k-50k, 0.3% for AGIs $50k-75k, 0.4% for AGIs $75k-100k, 0.9% for AGIs over 100k)
Total itemized deductions: $25,636 (23% of AGI, reported on 48.3% of returns)
Here:
$25,636
State:
$28,113
Here:
22.6% of AGI
State:
25.3% of AGI
(% of AGI for various income ranges: 103.7% for AGIs below $10k, 14.8% for AGIs $10k-25k, 16.5% for AGIs $25k-50k, 21.0% for AGIs $50k-75k, 21.9% for AGIs $75k-100k, 16.7% for AGIs over 100k)
Charity contributions deductions: $3,371 (3% of AGI, reported on 43.7% of returns)
Here:
$3,371
State:
$3,923
Here:
2.8% of AGI
State:
3.3% of AGI
(% of AGI for various income ranges: 5.0% for AGIs below $10k, 1.2% for AGIs $10k-25k, 1.6% for AGIs $25k-50k, 2.5% for AGIs $50k-75k, 2.5% for AGIs $75k-100k, 2.2% for AGIs over 100k)
Total tax: $11,880 (reported on 83.8% of returns)
95628:
$11,880
State:
$10,761
(% of AGI for various income ranges: 20.0% for AGIs below $10k, 5.3% for AGIs $10k-25k, 7.9% for AGIs $25k-50k, 9.5% for AGIs $50k-75k, 10.5% for AGIs $75k-100k, 18.9% for AGIs over 100k)
Earned income credit: $1,471 (reported on 8.4% of returns)
Here:
$1,471
State:
$1,763
Percentage of individuals using paid preparers for their 2004 taxes: 57.3%
Here:
57%
State:
66%
(% for various income ranges: 47.0% for AGIs below $10k, 52.6% for AGIs $10k-25k, 54.3% for AGIs $25k-50k, 60.6% for AGIs $50k-75k, 63.2% for AGIs $75k-100k, 68.9% for AGIs over 100k)
Likely homosexual households (counted as self-reported same-sex unmarried-partner households)
Lesbian couples: 0.1% of all households
Gay men: 0.1% of all households
Household received Food Stamps/SNAP in the past 12 months: 929 Household did not receive Food Stamps/SNAP in the past 12 months: 16,052
Women who had a birth in the past 12 months: 492 (395 now married, 96 unmarried) Women who did not have a birth in the past 12 months: 8,639 (3,803 now married, 4,819 unmarried)
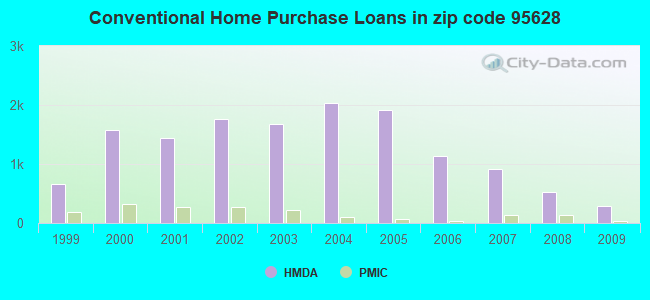
Housing units in zip code 95628 with a mortgage: 8,504 (823 second mortgage, 12 home equity loan, 739 both second mortgage and home equity loan) Houses without a mortgage: 302
Median monthly owner costs for units with a mortgage: $2,384 Median monthly owner costs for units without a mortgage: $775
Residents with income below the poverty level in 2022:
This zip code:
8.3%
Whole state:
12.2%
Residents with income below 50% of the poverty level in 2022:
This zip code:
4.3%
Whole state:
6.2%
Median number of rooms in houses and condos:
Here:
6.7
State:
6.0
Median number of rooms in apartments:
Here:
4.3
State:
3.9
Notable locations in this zip code not listed on our city pages
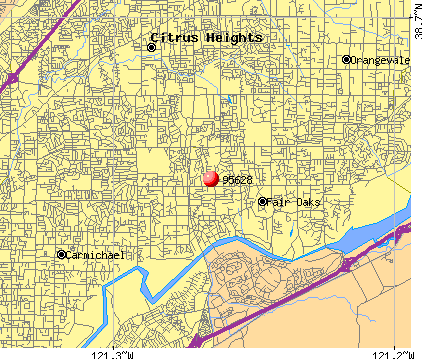
Notable locations in zip code 95628: Nimbus Dam Overlook (A), Arden Gold Sewage Treatment Plant (B), Northridge Country Club (C), Nimbus Powerhouse (D), Fair Oaks Community Library (E), Fair Oaks Community Center (F), Sacramento Metropolitan Fire District Station 32 (G), Sacramento Metropolitan Fire District Station 31 (H), Sacramento Metropolitan Fire District Station 108 (I), Sacramento County Sheriff - Fair Oaks / Orangevale Service Center (J). Display/hide their locations on the map
Shopping Centers: The Brickyard Shopping Center (1), Madison Mall Shopping Center (2), Hazen Ridge Plaza Shopping Center (3), Sunset Shopping Center (4), Northridge Shopping Center (5), Northridge Plaza Shopping Center (6), Fair Oaks Square Shopping Center (7), Bel Air Shopping Center (8), Quail Pointe Shopping Center (9). Display/hide their locations on the map
Churches in zip code 95628 include: First Baptist Church of Fair Oaks (A), Freedom Christian Church (B), Saint Mels Catholic Church (C), Sunrise Baptist Church (D), Fair Oaks Open Bible Church (E), Faith Lutheran Church (F), Gateway Christian Life Church (G), Grace Bible Church (H). Display/hide their locations on the map
Parks in zip code 95628 include: Bannister Park (1), Bird Track Park (2), Fair Oaks Park (3), Jim David Park (4), Miller Park (5), Mont View Park (6), Phoenix Park (7), Village Park (8), Little Phoenix Park (9). Display/hide their locations on the map
5,536 married couples with children.
1,767 single-parent households (640 men, 1,127 women).
84.2% of residents of 95628 zip code speak English at home.
5.1% of residents speak Spanish at home (81% very well, 12% well, 5% not well, 2% not at all).
7.5% of residents speak other Indo-European language at home (68% very well, 25% well, 4% not well, 3% not at all).
2.1% of residents speak Asian or Pacific Island language at home (63% very well, 26% well, 11% not well).
1.2% of residents speak other language at home (71% very well, 11% well, 18% not well).
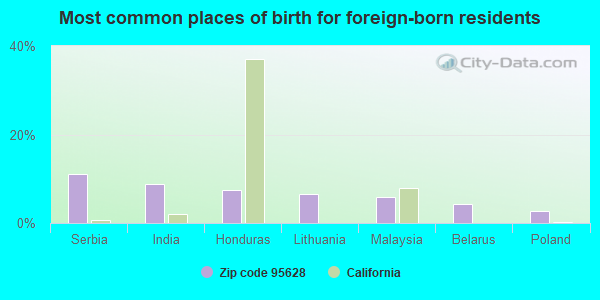
Foreign born population: 4,961 (11.3%) (78.2% of them are naturalized citizens)
This zip code:
11.3%
Whole state:
26.7%
11%Serbia
9%India
8%Honduras
6%Lithuania
6%Malaysia
4%Belarus
3%Poland
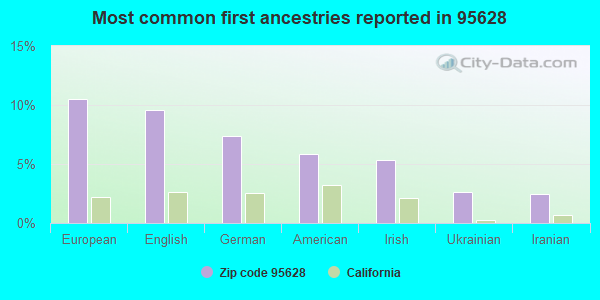
10%European
10%English
7%German
6%American
5%Irish
3%Ukrainian
2%Iranian
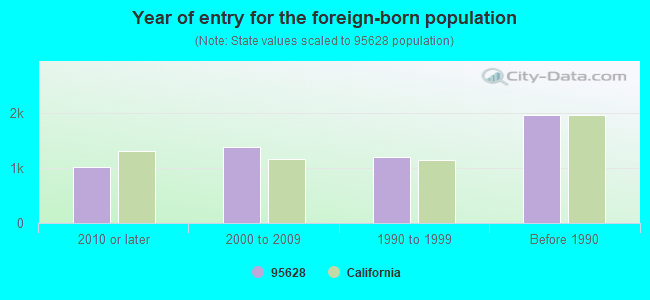
Year of entry for the foreign-born population
1,0152010 or later
1,3832000 to 2009
1,1901990 to 1999
1,959Before 1990
Major facilities with environmental interests located in this zip code:
JIFFY LUBE #381 (4160 SUNRISE BLVD in FAIR OAKS, CA)
STATE MASTER (California - Hazardous Waste Tracking) - HAZARDOU WASTE PROGRAM Small Quantity Generators, between 100 kg and 1000 kg of hazardous waste/month (Resource Conservation and Recovery Act (tracking hazardous waste)) - notification USED OIL PROGRAM (Resource Conservation and Recovery Act (tracking hazardous waste)) STATE MASTER (California - Used Oil Recycling System ) - USED OIL RECYCLING, USED OIL PROGRAM Organizations: PENNZOIL CO (CONTACT/OWNER)
Alternative names: JIFFY LUBE INTERNATIONAL 381
EQUILON ENTERPRISES (8865 MADISON AVE in FAIR OAKS, CA) . Federal Facility
STATE MASTER (California - Hazardous Waste Tracking) - HAZARDOU WASTE PROGRAM Small Quantity Generators, between 100 kg and 1000 kg of hazardous waste/month (Resource Conservation and Recovery Act (tracking hazardous waste)) - notification Organizations: EQUILON ENTERPRISES LLC DBA (CONTACT/OWNER)
Alternative names: SHELL OIL CO, SHELL SERVICE STATION
CHEVRON STATION 91537 (5365 DEWEY DR in FAIR OAKS, CA)
STATE MASTER (California - Hazardous Waste Tracking) - HAZARDOU WASTE PROGRAM Small Quantity Generators, between 100 kg and 1000 kg of hazardous waste/month (Resource Conservation and Recovery Act (tracking hazardous waste)) - notification Organizations: CHEVRON PRODUCTS CO (CONTACT/OWNER)
CHEVRON STATION NO 93540 (5361 SUNRISE BLVD in FAIR OAKS, CA)
STATE MASTER (California - Hazardous Waste Tracking) - HAZARDOU WASTE PROGRAM Small Quantity Generators, between 100 kg and 1000 kg of hazardous waste/month (Resource Conservation and Recovery Act (tracking hazardous waste)) - notification Organizations: CHEVRON PRODUCTS CO (CONTACT/OWNER)
CHEVRON STATION NO 94244 (8900 MADISON AVE in FAIR OAKS, CA)
STATE MASTER (California - Hazardous Waste Tracking) - HAZARDOU WASTE PROGRAM Small Quantity Generators, between 100 kg and 1000 kg of hazardous waste/month (Resource Conservation and Recovery Act (tracking hazardous waste)) - notification Organizations: CHEVRON PRODUCTS CO (CONTACT/OWNER)
EL SERENO ALTERNATIVE EDUC. (ALTERN.) (8301 MADISON AVE. in FAIR OAKS, CA)
(National Center for Education Statistics) - STATE ID-3430386 Organizations: SAN JUAN UNIFIED (SCHOOL DISTRICT)
(National Center for Education Statistics) - STATE ID-6034557 Organizations: SAN JUAN UNIFIED (SCHOOL DISTRICT)
HOLST (JOHN) ELEMENTARY (4501 BANNISTER AVE. in FAIR OAKS, CA)
(National Center for Education Statistics) - STATE ID-6034615 Organizations: SAN JUAN UNIFIED (SCHOOL DISTRICT)
LEGETTE (EARL) ELEMENTARY (4623 KENNETH AVE. in FAIR OAKS, CA)
(National Center for Education Statistics) - STATE ID-6034672 Organizations: SAN JUAN UNIFIED (SCHOOL DISTRICT)
LITTLEJOHN (LEIGHTON) ELEMENTARY (6838 KERMIT LANE in FAIR OAKS, CA)
(National Center for Education Statistics) - STATE ID-6034698 Organizations: SAN JUAN UNIFIED (SCHOOL DISTRICT)
NORTHRIDGE (5150 COCOA PALM WAY in FAIR OAKS, CA)
(National Center for Education Statistics) - STATE ID-6034755 Organizations: SAN JUAN UNIFIED (SCHOOL DISTRICT)
6815 MADISON AVE (6815 MADISON AVE in FAIR OAKS, CA)
(Integrated Compliance Information System) - ICIS-09-1989-0011, FORMAL ENFORCEMENT ACTION
FAIR OAKS WATER DISTRICT (10317 FAIR OAKS BLVD. in FAIR OAKS, CA)
(Integrated Compliance Information System) - ICIS-09-2004-0127, FORMAL ENFORCEMENT ACTION
Housing units lacking complete plumbing facilities: 0.1% Housing units lacking complete kitchen facilities: 0.8%
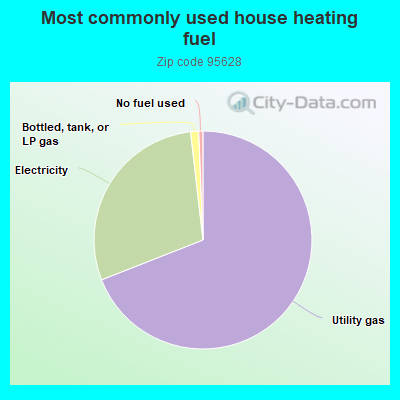
68.5%Utility gas
28.9%Electricity
1.2%Bottled, tank, or LP gas
0.6%No fuel used
Population in 1990: 40,502. Population change in the 1990s: +237 (+0.6%).
Place of birth for U.S.-born residents:
This state: 28,342
Northeast: 1,911
Midwest: 3,159
South: 2,539
West: 2,163
56% of the 95628 zip code residents lived in the same house 5 years ago. Out of people who lived in different houses, 64% lived in this county. Out of people who lived in different counties, 50% lived in California.
89% of the 95628 zip code residents lived in the same house 1 year ago. Out of people who lived in different houses, 53% moved from this county. Out of people who lived in different houses, 31% moved from different county within same state. Out of people who lived in different houses, 7% moved from different state. Out of people who lived in different houses, 9% moved from abroad.
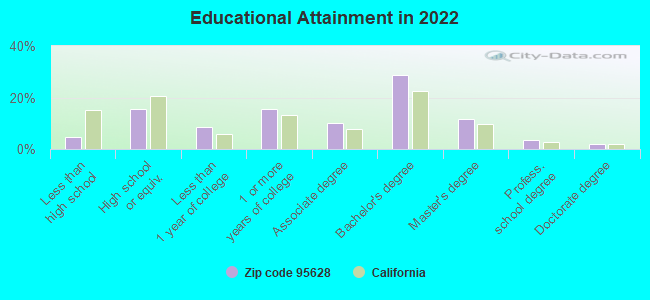
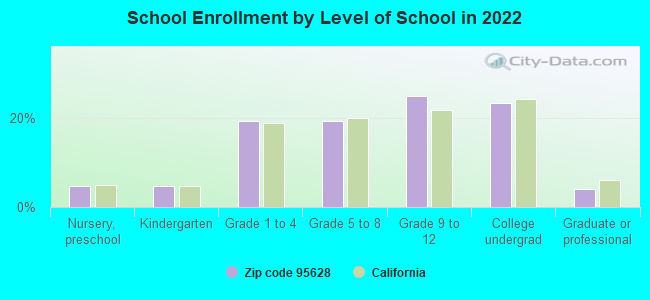
Private vs. public school enrollment:
Students in private schools in grades 1 to 8 (elementary and middle school): 695
Here:
19.8%
California:
10.5%
Students in private schools in grades 9 to 12 (high school): 149
Here:
6.7%
California:
8.5%
Students in private undergraduate colleges: 250
Here:
11.9%
California:
15.9%
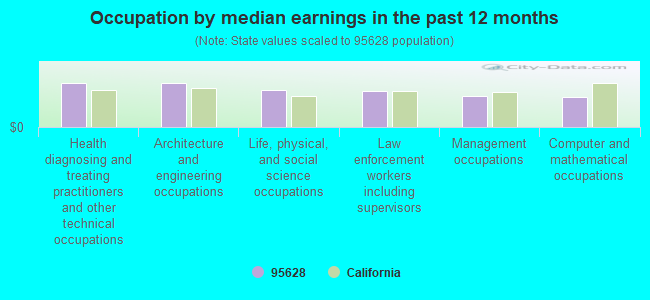
Occupation by median earnings in the past 12 months ($)
132,270Health diagnosing and treating practitioners and other technical occupations
132,069Architecture and engineering occupations
111,849Life, physical, and social science occupations
106,814Law enforcement workers including supervisors
92,466Management occupations
89,704Computer and mathematical occupations
Companies with federal contracts located in this zip code (FAIR OAKS, CA):
WILCOXEN, BETH (8832 BOLD RULER WAY; small business) : $99,086 in 4 contractsfrom 2002 to 2003
$66,798 with Air Force for Office Furniture. Signed on 2002-05-10. Completion date: 2002-06-28.
$14,085 with Navy for Office Furniture. Signed on 2003-05-08. Completion date: 2003-05-14.
$10,118 with Air Force for Laboratory Equipment and Supplies. Taking place in MD. Signed on 2003-07-11. Completion date: 2003-09-24.
$8,085 with Navy for Office Furniture. Signed on 2003-02-25. Completion date: 2003-03-20.
RELIANCE ENVIRONMENTAL SERVICE (8194 NIESSEN WAY; small business)
$96,000 with Navy for Well Drilling/Exploratory Services. Signed on 2000-10-01. Completion date: 2000-12-26.
MILLS, WILLIAM M (7760 WINDING WAY; small business) : $14,629 in 2 contractsin 2005
$14,629 with Army for Other Professional Services. Signed on 2005-10-12. Completion date: 2005-11-25.
$0, same as above.Signed on 2005-10-12. Completion date: 2005-11-25.
SAVANT DATA SYSTEMS (6608 MERCY COURT, STE C; small business)
$7,200 with Air Force for ADP Software. Signed on 2005-02-22. Completion date: 2005-02-25.
MICHELLE WOODWARD (4840 HARTMAN WAY; small business) : $7,100 in 11 contractsfrom 2003 to 2004
Contracts for Custodial Janitorial Services by Army, U.S. Army Corps of Engineers - civil program financing only Signed by year:2000: $0; 2001: $0; 2002: $0; 2003: $14,640; 2004: -$7,540; 2005: $0; 2006: $0.
Biggest contracts:
$9,000 with Army for Custodial Janitorial Services. Signed on 2003-11-12. Completion date: 2004-09-30.
$3,000, same as above.Signed on 2003-11-20. Completion date: 2004-09-30.
$2,640, same as above.Signed on 2003-11-19. Completion date: 2004-09-30.
$0 with U.S. Army Corps of Engineers - civil program financing only for Custodial Janitorial Services. Signed on 2004-06-30. Completion date: 2004-09-30.
MEDICAL HORIZONS, INC (4386 HALE RANCH LANE; small business)
$4,315 with Navy for Medical and Surgical Instruments, Equipment, and Supplies. Signed on 2003-09-09. Completion date: 2003-10-06.
WHITEFEATHER BASINGER AND ASSO (4070 BRIDGE ST 4; small business)
$3,500 with Air Force for Other Education and Training Services. Signed on 2005-09-23. Completion date: 2005-10-06.
FAIR OAKS CONSTRUCTION (5036 FILBERT AVE; small business) : $3,000 in 2 contractsin 2002
$3,000 with Department of Defense for Maintenance, Repair or Alteration of Real Property -- Other Warehouse Buildings. Signed on 2002-05-03. Completion date: 2002-05-09.
$0, same as above.Signed on 2002-05-03. Completion date: 2002-05-09.
Top industries in this zip code by the number of employees in 2005:
2005 - 2018 National Fire Incident Reporting System (NFIRS) incidents
According to the data from the years 2005 - 2018 the average number of fires per year is 44. The highest number of reported fires - 65 took place in 2005, and the least - 27 in 2006. The data has a declining trend.
When looking into fire subcategories, the most incidents belonged to: Outside Fires (44.9%), and Structure Fires (29.4%).
Fire incident types reported to NFIRS in Zip Code 95628


 Nearest zip codes: 95610, 95662, 95670, 95621, 95608, 95661.


 According to the data from the years 2005 - 2018 the average number of fires per year is 44. The highest number of reported fires - 65 took place in 2005, and the least - 27 in 2006. The data has a declining trend.
 When looking into fire subcategories, the most incidents belonged to: Outside Fires (44.9%), and Structure Fires (29.4%).