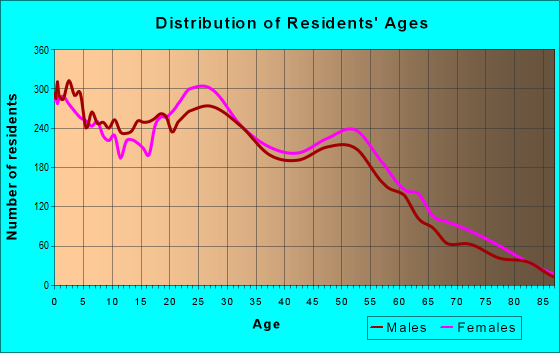
Estimated zip code population in 2022: 34,486 Zip code population in 2010: 31,806 Zip code population in 2000: 31,369
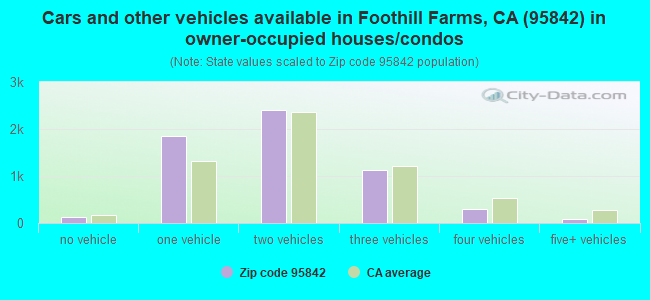
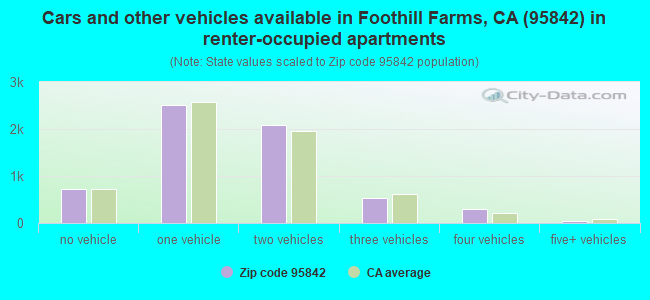
Houses and condos: 12,367 Renter-occupied apartments: 6,193
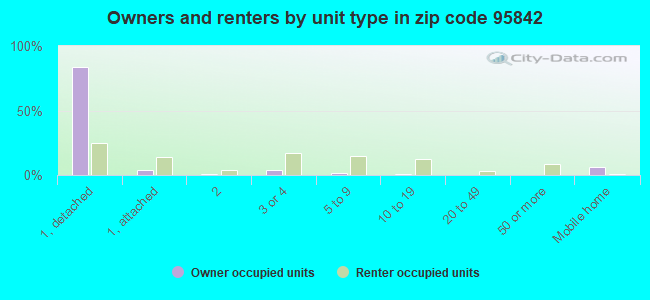
% of renters here:
51%
State:
44%
March 2022 cost of living index in zip code 95842: 101.2 (near average, U.S. average is 100)
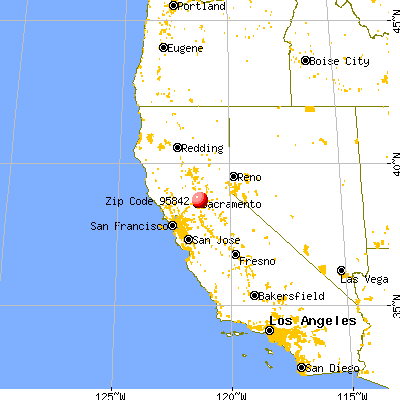
Land area: 3.9 sq. mi. Water area: 0.0 sq. mi.
Population density: 8,806 people per square mile
(high).
OSM Map
General Map
Google Map
MSN Map
OSM Map
General Map
Google Map
MSN Map
OSM Map
General Map
Google Map
MSN Map
OSM Map
General Map
Google Map
MSN Map
Please wait while loading the map...
Real estate property taxes paid for housing units in 2022:
This zip code:
0.6% ($2,083)
California:
0.7% ($4,831)
Median real estate property taxes paid for housing units with mortgages in 2022: $2,426 (0.6%) Median real estate property taxes paid for housing units with no mortgage in 2022: $1,466 (0.4%)
Averages for the 2020 tax year for zip code 95842, filed in 2021:
Average Adjusted Gross Income (AGI) in 2020: $45,167 (Individual Income Tax Returns)
Here:
$45,167
State:
$95,910
Salary/wage: $41,932 (reported on 82.6% of returns)
Here:
$41,932
State:
$77,331
(% of AGI for various income ranges: 1166.3% for AGIs below $25k, 3888.7% for AGIs $25k-50k, 7372.4% for AGIs $50k-75k, 11048.9% for AGIs $75k-100k, 18768.9% for AGIs $100k-200k, 50256.7% for AGIs over 200k)
Taxable interest for individuals: $355 (reported on 25.7% of returns)
This zip code:
$355
California:
$2,294
(% of AGI for various income ranges: 4.8% for AGIs below $25k, 8.5% for AGIs $25k-50k, 17.3% for AGIs $50k-75k, 31.1% for AGIs $75k-100k, 55.8% for AGIs $100k-200k, 53.3% for AGIs over 200k)
Ordinary dividends: $1,725 (reported on 6.6% of returns)
Here:
$1,725
State:
$10,949
(% of AGI for various income ranges: 6.3% for AGIs below $25k, 7.4% for AGIs $25k-50k, 16.6% for AGIs $50k-75k, 22.4% for AGIs $75k-100k, 110.6% for AGIs $100k-200k, 330.0% for AGIs over 200k)
Net capital gain/loss in AGI: +$4,014 (reported on 7.1% of returns)
Here:
+$4,014
State:
+$49,306
(% of AGI for various income ranges: 1.2% for AGIs below $25k, 8.8% for AGIs $25k-50k, 24.0% for AGIs $50k-75k, 64.6% for AGIs $75k-100k, 361.8% for AGIs $100k-200k, 2790.0% for AGIs over 200k)
Profit/loss from business: +$10,068 (reported on 17.8% of returns)
Here:
+$10,068
State:
+$15,671
(% of AGI for various income ranges: 190.4% for AGIs below $25k, 259.8% for AGIs $25k-50k, 309.7% for AGIs $50k-75k, 352.6% for AGIs $75k-100k, 462.4% for AGIs $100k-200k)
Taxable individual retirement arrangement distribution: $13,391 (reported on 4.1% of returns)
95842:
$13,391
California:
$23,505
(% of AGI for various income ranges: 31.8% for AGIs below $25k, 34.6% for AGIs $25k-50k, 88.6% for AGIs $50k-75k, 177.2% for AGIs $75k-100k, 490.5% for AGIs $100k-200k)
Total itemized deductions: $23,537 (reported on 6.6% of returns)
Here:
$23,537
State:
$39,517
(% of AGI for various income ranges: 21.7% for AGIs below $25k, 85.1% for AGIs $25k-50k, 373.4% for AGIs $50k-75k, 767.2% for AGIs $75k-100k, 1012.3% for AGIs $100k-200k, 3316.7% for AGIs over 200k)
Charity contributions: $5,178 (reported on 4.7% of returns)
Here:
$5,178
State:
$12,598
(% of AGI for various income ranges: 1.5% for AGIs below $25k, 11.0% for AGIs $25k-50k, 52.3% for AGIs $50k-75k, 90.1% for AGIs $75k-100k, 233.1% for AGIs $100k-200k, 646.7% for AGIs over 200k)
Taxes paid: $6,635 (reported on 6.6% of returns)
95842:
$6,635
State:
$8,807
(% of AGI for various income ranges: 3.2% for AGIs below $25k, 18.4% for AGIs $25k-50k, 102.6% for AGIs $50k-75k, 236.8% for AGIs $75k-100k, 322.4% for AGIs $100k-200k, 783.3% for AGIs over 200k)
Earned income credit: $2,269 (reported on 22.4% of returns)
Here:
$2,269
State:
$2,074
(% of AGI for various income ranges: 117.6% for AGIs below $25k, 93.5% for AGIs $25k-50k, 1.9% for AGIs $50k-75k)
Percentage of individuals using paid preparers for their 2020 taxes: 93.0%
Here:
93%
State:
92%
(% for various income ranges: 92.3% for AGIs below $25k, 94.0% for AGIs $25k-50k, 92.7% for AGIs $50k-75k, 92.8% for AGIs $75k-100k, 93.2% for AGIs $100k-200k, 88.9% for AGIs over 200k)
Averages for the 2012 tax year for zip code 95842, filed in 2013:
Average Adjusted Gross Income (AGI) in 2012: $35,810 (Individual Income Tax Returns)
Here:
$35,810
State:
$72,726
Salary/wage: $33,045 (reported on 83.6% of returns)
Here:
$33,045
State:
$59,079
(% of AGI for various income ranges: 73.2% for AGIs below $25k, 80.9% for AGIs $25k-50k, 77.6% for AGIs $50k-75k, 77.2% for AGIs $75k-100k, 73.0% for AGIs $100k-200k)
Taxable interest for individuals: $408 (reported on 26.6% of returns)
This zip code:
$408
California:
$2,146
(% of AGI for various income ranges: 0.4% for AGIs below $25k, 0.2% for AGIs $25k-50k, 0.3% for AGIs $50k-75k, 0.3% for AGIs $75k-100k, 0.5% for AGIs $100k-200k)
Ordinary dividends: $1,861 (reported on 7.3% of returns)
Here:
$1,861
State:
$9,308
(% of AGI for various income ranges: 0.3% for AGIs below $25k, 0.2% for AGIs $25k-50k, 0.3% for AGIs $50k-75k, 0.3% for AGIs $75k-100k, 0.9% for AGIs $100k-200k)
Net capital gain/loss in AGI: +$1,220 (reported on 5.2% of returns)
Here:
+$1,220
State:
+$30,460
(% of AGI for various income ranges: 0.2% for AGIs $50k-75k, 0.8% for AGIs $100k-200k)
Profit/loss from business: +$9,683 (reported on 15.9% of returns)
Here:
+$9,683
State:
+$17,064
(% of AGI for various income ranges: 12.6% for AGIs below $25k, 4.4% for AGIs $25k-50k, 2.3% for AGIs $50k-75k, 1.5% for AGIs $75k-100k, 0.8% for AGIs $100k-200k)
Taxable individual retirement arrangement distribution: $10,942 (reported on 5.4% of returns)
95842:
$10,942
California:
$19,557
(% of AGI for various income ranges: 1.3% for AGIs below $25k, 1.2% for AGIs $25k-50k, 1.6% for AGIs $50k-75k, 2.3% for AGIs $75k-100k, 2.3% for AGIs $100k-200k)
Total itemized deductions: $16,737 (26% of AGI, reported on 23.3% of returns)
Here:
$16,737
State:
$34,004
Here:
26.1% of AGI
State:
22.7% of AGI
(% of AGI for various income ranges: 5.0% for AGIs below $25k, 8.5% for AGIs $25k-50k, 13.2% for AGIs $50k-75k, 14.6% for AGIs $75k-100k, 15.0% for AGIs $100k-200k)
Charity contributions: $2,530 (reported on 18.3% of returns)
Here:
$2,530
State:
$4,659
(% of AGI for various income ranges: 0.5% for AGIs below $25k, 0.9% for AGIs $25k-50k, 1.5% for AGIs $50k-75k, 1.9% for AGIs $75k-100k, 2.1% for AGIs $100k-200k)
Taxes paid: $4,480 (reported on 23.3% of returns)
95842:
$4,480
State:
$14,448
(% of AGI for various income ranges: 0.8% for AGIs below $25k, 1.8% for AGIs $25k-50k, 3.4% for AGIs $50k-75k, 4.2% for AGIs $75k-100k, 5.3% for AGIs $100k-200k)
Earned income credit: $2,455 (reported on 28.6% of returns)
Here:
$2,455
State:
$2,286
(% of AGI for various income ranges: 8.9% for AGIs below $25k, 1.5% for AGIs $25k-50k)
Percentage of individuals using paid preparers for their 2012 taxes: 53.2%
Here:
53%
State:
64%
(% for various income ranges: 52.8% for AGIs below $25k, 53.0% for AGIs $25k-50k, 53.7% for AGIs $50k-75k, 54.9% for AGIs $75k-100k, 53.8% for AGIs $100k-200k)
Averages for the 2004 tax year for zip code 95842, filed in 2005:
Average Adjusted Gross Income (AGI) in 2004: $35,407 (Individual Income Tax Returns)
Here:
$35,407
State:
$58,600
Salary/wage: $33,832 (reported on 88.0% of returns)
Here:
$33,832
State:
$49,455
(% of AGI for various income ranges: 94.2% for AGIs below $10k, 79.6% for AGIs $10k-25k, 86.2% for AGIs $25k-50k, 85.0% for AGIs $50k-75k, 83.9% for AGIs $75k-100k, 78.3% for AGIs over 100k)
Taxable interest for individuals: $490 (reported on 37.8% of returns)
This zip code:
$490
California:
$2,365
(% of AGI for various income ranges: 2.1% for AGIs below $10k, 0.7% for AGIs $10k-25k, 0.5% for AGIs $25k-50k, 0.5% for AGIs $50k-75k, 0.5% for AGIs $75k-100k, 0.4% for AGIs over 100k)
Taxable dividends: $1,156 (reported on 11.2% of returns)
Here:
$1,156
State:
$4,746
(% of AGI for various income ranges: 0.8% for AGIs below $10k, 0.3% for AGIs $10k-25k, 0.3% for AGIs $25k-50k, 0.3% for AGIs $50k-75k, 0.5% for AGIs $75k-100k, 0.6% for AGIs over 100k)
Net capital gain/loss: +$3,793 (reported on 8.1% of returns)
Here:
+$3,793
State:
+$23,418
(% of AGI for various income ranges: -0.7% for AGIs below $10k, -0.1% for AGIs $10k-25k, 0.2% for AGIs $25k-50k, 0.3% for AGIs $50k-75k, 1.4% for AGIs $75k-100k, 5.7% for AGIs over 100k)
Profit/loss from business: +$6,716 (reported on 13.4% of returns)
Here:
+$6,716
State:
+$16,826
(% of AGI for various income ranges: 8.7% for AGIs below $10k, 6.0% for AGIs $10k-25k, 2.1% for AGIs $25k-50k, 1.5% for AGIs $50k-75k, 2.2% for AGIs $75k-100k, 1.5% for AGIs over 100k)
IRA payment deduction: $2,364 (reported on 1.6% of returns)
95842:
$2,364
California:
$3,192
(% of AGI for various income ranges: 0.1% for AGIs $10k-25k, 0.1% for AGIs $25k-50k, 0.1% for AGIs $50k-75k, 0.1% for AGIs $75k-100k, 0.1% for AGIs over 100k)
Self-employed pension: $6,607 (reported on 0.2% of returns)
Here:
$6,607
California:
$17,688
Total itemized deductions: $16,545 (30% of AGI, reported on 35.0% of returns)
Here:
$16,545
State:
$28,113
Here:
29.7% of AGI
State:
25.3% of AGI
(% of AGI for various income ranges: 12.2% for AGIs below $10k, 9.4% for AGIs $10k-25k, 15.2% for AGIs $25k-50k, 19.2% for AGIs $50k-75k, 19.8% for AGIs $75k-100k, 17.2% for AGIs over 100k)
Charity contributions deductions: $2,086 (4% of AGI, reported on 30.1% of returns)
Here:
$2,086
State:
$3,923
Here:
3.6% of AGI
State:
3.3% of AGI
(% of AGI for various income ranges: 0.5% for AGIs below $10k, 0.8% for AGIs $10k-25k, 1.6% for AGIs $25k-50k, 2.1% for AGIs $50k-75k, 2.4% for AGIs $75k-100k, 2.3% for AGIs over 100k)
Total tax: $3,714 (reported on 73.7% of returns)
95842:
$3,714
State:
$10,761
(% of AGI for various income ranges: 2.8% for AGIs below $10k, 4.1% for AGIs $10k-25k, 6.2% for AGIs $25k-50k, 8.4% for AGIs $50k-75k, 9.8% for AGIs $75k-100k, 13.8% for AGIs over 100k)
Earned income credit: $1,743 (reported on 19.4% of returns)
Here:
$1,743
State:
$1,763
Percentage of individuals using paid preparers for their 2004 taxes: 56.6%
Here:
57%
State:
66%
(% for various income ranges: 51.5% for AGIs below $10k, 57.9% for AGIs $10k-25k, 56.7% for AGIs $25k-50k, 59.1% for AGIs $50k-75k, 56.9% for AGIs $75k-100k, 58.8% for AGIs over 100k)
Likely homosexual households (counted as self-reported same-sex unmarried-partner households)
Lesbian couples: 0.1% of all households
Gay men: 0.1% of all households
Household received Food Stamps/SNAP in the past 12 months: 3,253 Household did not receive Food Stamps/SNAP in the past 12 months: 9,176
Women who had a birth in the past 12 months: 709 (466 now married, 244 unmarried) Women who did not have a birth in the past 12 months: 7,658 (2,987 now married, 4,673 unmarried)
Housing units in zip code 95842 with a mortgage: 3,994 (314 second mortgage, 190 both second mortgage and home equity loan) Houses without a mortgage: 9
Median monthly owner costs for units with a mortgage: $1,697 Median monthly owner costs for units without a mortgage: $495
Residents with income below the poverty level in 2022:
This zip code:
19.2%
Whole state:
12.2%
Residents with income below 50% of the poverty level in 2022:
This zip code:
10.0%
Whole state:
6.2%
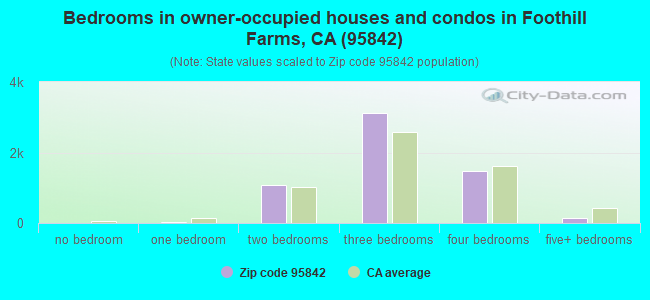
Median number of rooms in houses and condos:
Here:
5.7
State:
6.0
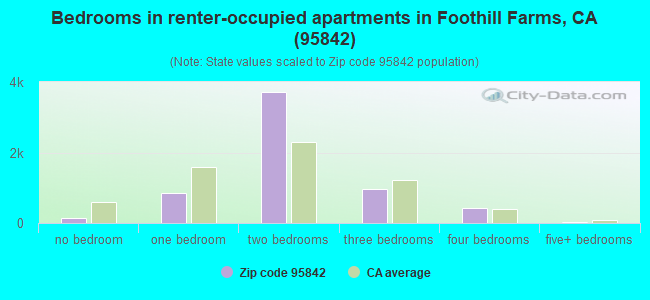
Median number of rooms in apartments:
Here:
4.1
State:
3.9
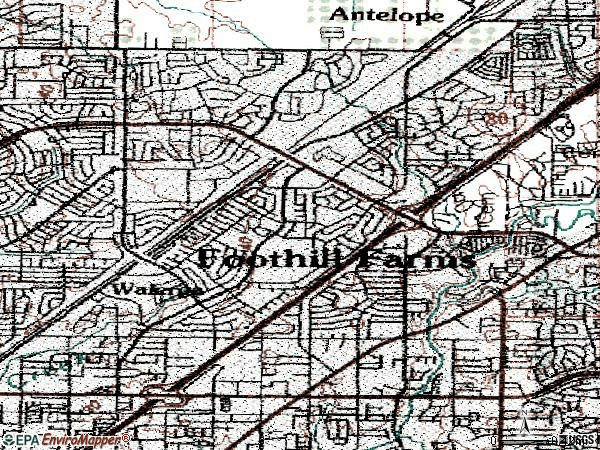
Notable locations in this zip code not listed on our city pages
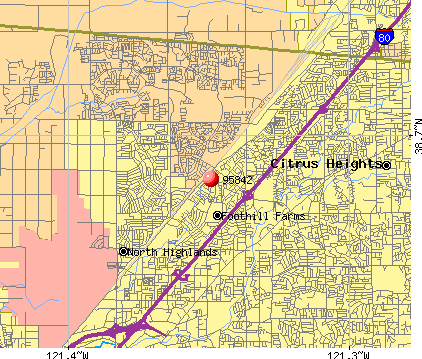
Churches in zip code 95842 include: Antelope Springs Baptist Church (A), Church of the Nazarene (B), Sacramento Korean Church of the Nazarene (C). Display/hide their locations on the map
Parks in zip code 95842 include: Daly Park (1), Mason Park (2), Spruce Park (3), Rushmore Jeanine Park (4), Chardonay Park (5). Display/hide their locations on the map
4,221 married couples with children.
3,713 single-parent households (901 men, 2,812 women).
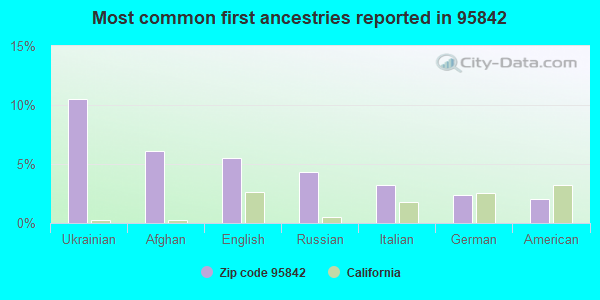
62.3% of residents of 95842 zip code speak English at home.
14.8% of residents speak Spanish at home (68% very well, 15% well, 12% not well, 4% not at all).
16.9% of residents speak other Indo-European language at home (44% very well, 26% well, 24% not well, 6% not at all).
4.9% of residents speak Asian or Pacific Island language at home (60% very well, 25% well, 15% not well).
1.5% of residents speak other language at home (43% very well, 35% well, 22% not well).
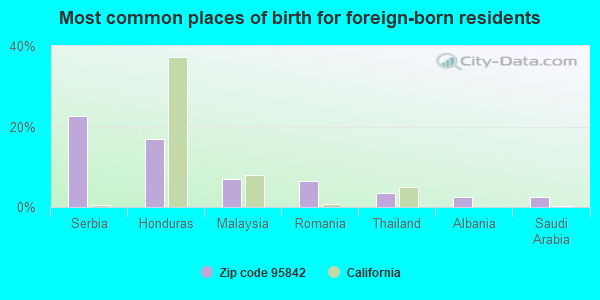
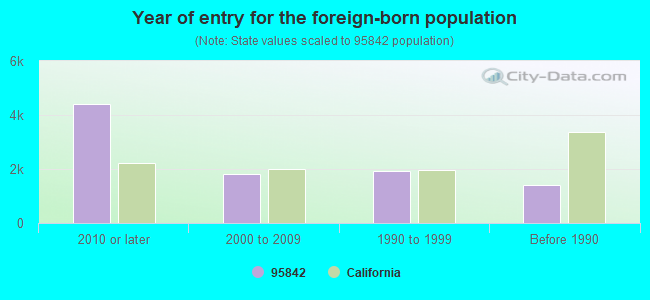
Foreign born population: 8,509 (24.7%) (43.0% of them are naturalized citizens)
Facilities with environmental interests located in this zip code:
EQUILON ENTERPRISES (4301 MADISON AVE in SACRAMENTO, CA) . Federal Facility
STATE MASTER (California - Hazardous Waste Tracking) - HAZARDOU WASTE PROGRAM HAZARDOUS WASTE BIENNIAL REPORTER (Resource Conservation and Recovery Act (tracking hazardous waste)) Small Quantity Generators, between 100 kg and 1000 kg of hazardous waste/month (Resource Conservation and Recovery Act (tracking hazardous waste)) - notification Organizations: EQUILON ENTERPRISES, LLC (CONTACT/OWNER)
Alternative names: SHELL OIL CO
HILLSDALE CLEANERS (5739 HILLSDALE BLVD in SACRAMENTO, CA)
STATE MASTER (California - Hazardous Waste Tracking) - HAZARDOU WASTE PROGRAM CRITERIA AND HAZARDOUS AIR POLLUTANT INVENTORY (Inventory of air pollution sources) Small Quantity Generators, between 100 kg and 1000 kg of hazardous waste/month (Resource Conservation and Recovery Act (tracking hazardous waste)) Business SIC classification: DRYCLEANING PLANTS, EXCEPT RUG CLEANING
GOLDEN STATE COLLISION CENTER (5740 ROSEVILLE ROAD SUITE L in SACRAMENTO, CA)
STATE MASTER (California - Hazardous Waste Tracking) - HAZARDOU WASTE PROGRAM Small Quantity Generators, between 100 kg and 1000 kg of hazardous waste/month (Resource Conservation and Recovery Act (tracking hazardous waste)) - notification Organizations: DAVID FINKELSTEIN (CONTACT/OWNER)
INTERNATIONAL AUTOCRAFT (7307 ROSEVILLE RD in SACRAMENTO, CA)
STATE MASTER (California - Hazardous Waste Tracking) - HAZARDOU WASTE PROGRAM Small Quantity Generators, between 100 kg and 1000 kg of hazardous waste/month (Resource Conservation and Recovery Act (tracking hazardous waste)) - notification
FOOTHILL FARMS JUNIOR HIGH (5001 DIABLO DR. in SACRAMENTO, CA)
(National Center for Education Statistics) - STATE ID-6059232 Organizations: GRANT JOINT UNION HIGH (SCHOOL DISTRICT)
FOOTHILL HIGH (5000 MCCLOUD DR. in SACRAMENTO, CA)
(National Center for Education Statistics) - STATE ID-3433265 Organizations: GRANT JOINT UNION HIGH (SCHOOL DISTRICT)
FOOTHILL OAKS ELEMENTARY (5520 LANCELOT DR. in SACRAMENTO, CA)
(National Center for Education Statistics) - STATE ID-6112064 Organizations: RIO LINDA UNION ELEMENTARY (SCHOOL DISTRICT)
FRONTIER ELEMENTARY (6691 SILVERTHORNE CIR. in SACRAMENTO, CA)
(National Center for Education Statistics) - STATE ID-6033492 Organizations: RIO LINDA UNION ELEMENTARY (SCHOOL DISTRICT)
HOME DEPOT USA INC HD 6669 (5859 ANTELOPE RD in SACRAMENTO, CA)
Small Quantity Generators, between 100 kg and 1000 kg of hazardous waste/month (Resource Conservation and Recovery Act (tracking hazardous waste))
KNIESELS HI TECH BODY AND PAINT (7329 ROSEVILLE RD NO 1 in SACRAMENTO, CA)
Small Quantity Generators, between 100 kg and 1000 kg of hazardous waste/month (Resource Conservation and Recovery Act (tracking hazardous waste)) - notification Organizations: RICH KNIESEL (CONTACT/OWNER)
HANS CLEANERS (7117 WALERGA RD #4 in SACRAMENTO, CA)
CRITERIA AND HAZARDOUS AIR POLLUTANT INVENTORY (Inventory of air pollution sources) Business SIC classification: DRYCLEANING PLANTS, EXCEPT RUG CLEANING
LIBERTY TOWERS CHRISTIAN SCHOOL (5132 ELKHORN BLVD in SACRAMENTO, CA)
COMPLIANCE ACTIVITY (Tracking inspections of insecticide, fungicide, and rodenticide, and toxic substances)
Housing units lacking complete plumbing facilities: 0.5% Housing units lacking complete kitchen facilities: 0.8%
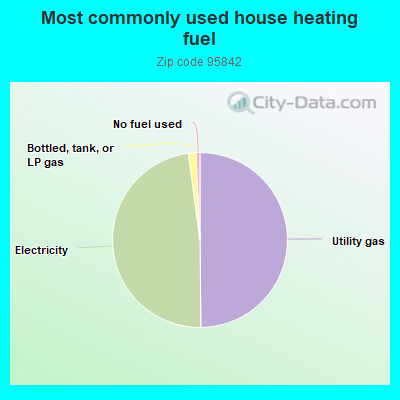
49.7%Utility gas
47.9%Electricity
1.4%Bottled, tank, or LP gas
0.7%No fuel used
Population in 1990: 32,169.
Place of birth for U.S.-born residents:
This state: 20,866
Northeast: 608
Midwest: 1,465
South: 1,498
West: 959
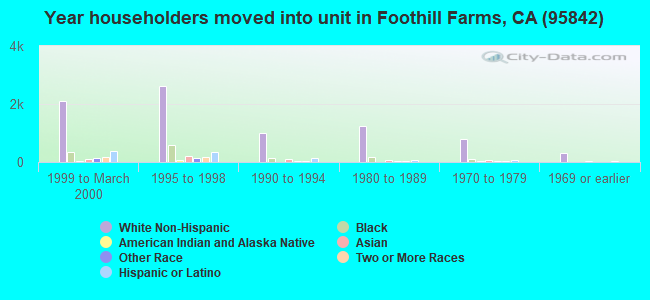
44% of the 95842 zip code residents lived in the same house 5 years ago. Out of people who lived in different houses, 68% lived in this county. Out of people who lived in different counties, 50% lived in California.
88% of the 95842 zip code residents lived in the same house 1 year ago. Out of people who lived in different houses, 57% moved from this county. Out of people who lived in different houses, 27% moved from different county within same state. Out of people who lived in different houses, 6% moved from different state. Out of people who lived in different houses, 9% moved from abroad.
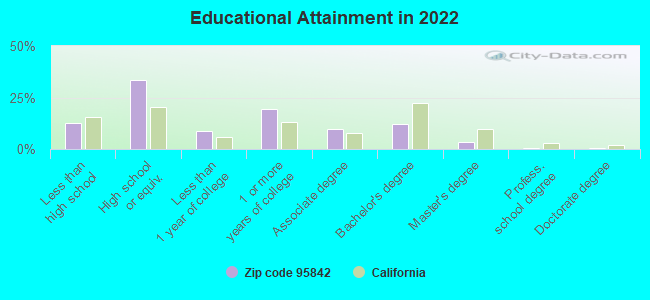
Private vs. public school enrollment:
Students in private schools in grades 1 to 8 (elementary and middle school): 413
Here:
9.8%
California:
10.5%
Students in private schools in grades 9 to 12 (high school): 163
Here:
9.0%
California:
8.5%
Students in private undergraduate colleges: 146
Here:
8.9%
California:
15.9%
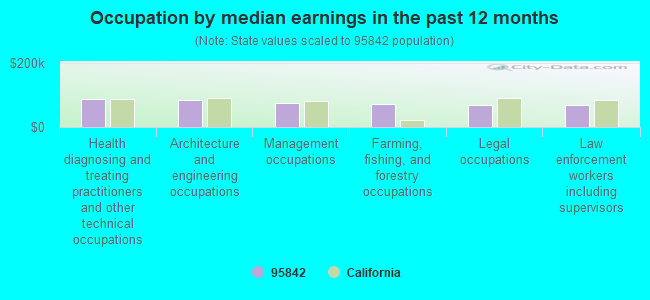
Occupation by median earnings in the past 12 months ($)
88,971Health diagnosing and treating practitioners and other technical occupations
84,318Architecture and engineering occupations
75,912Management occupations
72,396Farming, fishing, and forestry occupations
68,502Legal occupations
68,017Law enforcement workers including supervisors
Companies with federal contracts located in this zip code:
STAPLES & PFEIFFER INC (7031 ROSEVILLE RD in SACRAMENTO, CA; small business) : $1,707,944 in 84 contractsfrom 2000 to 2006
Contracts for Hose, Pipe, Tube, Lubrication, and Railing Fittings, Industrial Assembly Machines, Non-nuclear Ship Repair (West) Ship repair (including overhauls and conversions) performed on. non-nuclear propelled and nonpropelled ships west of the 108th meridian, Hardware, Commercial, and moreby Defense Logistics Agency, Navy, Offices, Boards and Divisions (includes Attorney General, Deputy Attorney General, etc.) Signed by year:2000: -$4,210; 2001: $167,910; 2002: $133,200; 2003: $206,767; 2004: $798,340; 2005: $312,618; 2006: $93,319.
Biggest contracts:
$108,000 with Defense Logistics Agency for Hose, Pipe, Tube, Lubrication, and Railing Fittings. Signed on 2002-04-05. Completion date: 2002-06-26.
$88,224, same as above.Signed on 2004-09-07. Completion date: 2004-10-07.
$88,224, same as above.Signed on 2004-09-07. Completion date: 2004-10-07.
$84,257, same as above.Signed on 2004-09-03. Completion date: 2004-10-04.
Top industries in this zip code by the number of employees in 2005:
2005 - 2018 National Fire Incident Reporting System (NFIRS) incidents
Based on the data from the years 2005 - 2018 the average number of fire incidents per year is 66. The highest number of reported fire incidents - 107 took place in 2018, and the least - 19 in 2006. The data has an increasing trend.
When looking into fire subcategories, the most reports belonged to: Outside Fires (53.2%), and Mobile Property/Vehicle Fires (19.5%).
Fire incident types reported to NFIRS in Zip Code 95842


 Nearest zip codes: 95841, 95660, 95843, 95621, 95652, 95608.
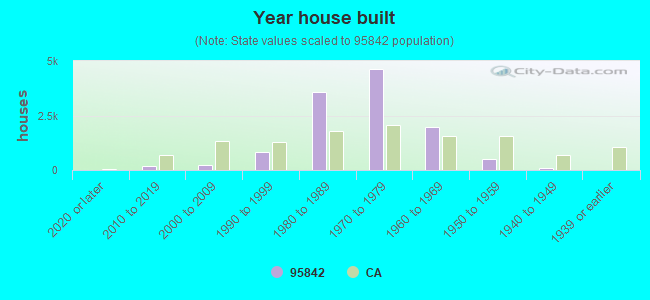


 . Federal Facility
 Based on the data from the years 2005 - 2018 the average number of fire incidents per year is 66. The highest number of reported fire incidents - 107 took place in 2018, and the least - 19 in 2006. The data has an increasing trend.
 When looking into fire subcategories, the most reports belonged to: Outside Fires (53.2%), and Mobile Property/Vehicle Fires (19.5%).