Estimated zip code population in 2022: 21,363 Zip code population in 2010: 19,448 Zip code population in 2000: 20,975
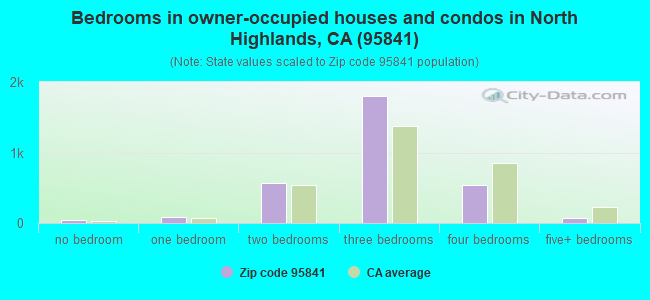
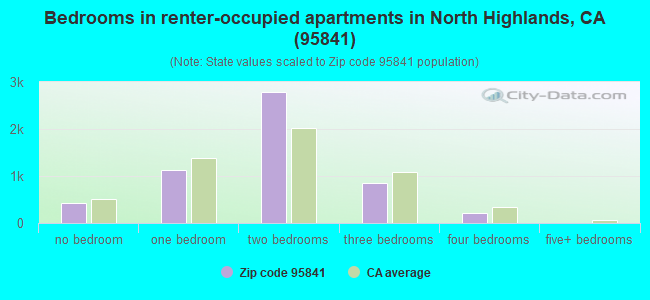
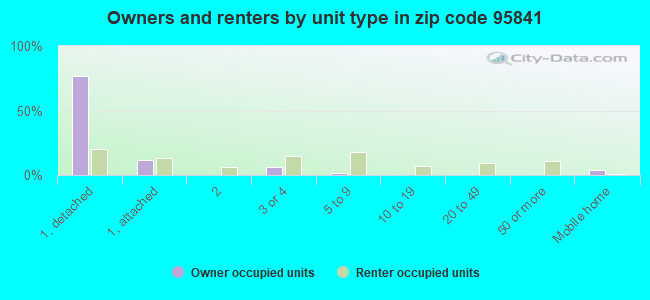
Houses and condos: 8,932 Renter-occupied apartments: 5,424
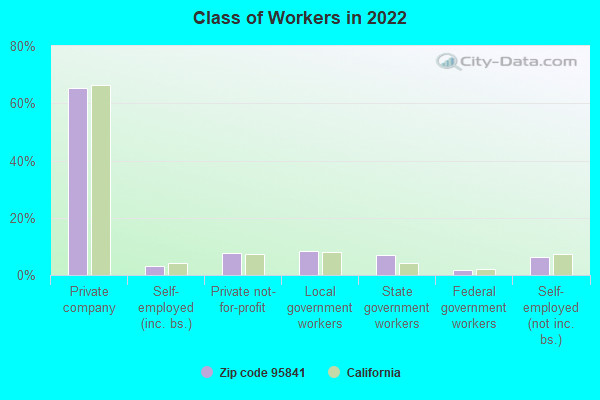
% of renters here:
64%
State:
44%
March 2022 cost of living index in zip code 95841: 102.1 (near average, U.S. average is 100)
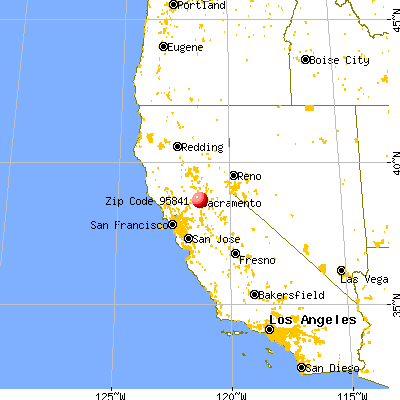
Land area: 4.1 sq. mi. Water area: 0.0 sq. mi.
Population density: 5,241 people per square mile
(average).
OSM Map
General Map
Google Map
MSN Map
OSM Map
General Map
Google Map
MSN Map
OSM Map
General Map
Google Map
MSN Map
OSM Map
General Map
Google Map
MSN Map
Please wait while loading the map...
Real estate property taxes paid for housing units in 2022:
This zip code:
0.7% ($2,777)
California:
0.7% ($4,831)
Median real estate property taxes paid for housing units with mortgages in 2022: $3,322 (0.8%) Median real estate property taxes paid for housing units with no mortgage in 2022: $1,342 (0.4%)
Averages for the 2020 tax year for zip code 95841, filed in 2021:
Average Adjusted Gross Income (AGI) in 2020: $48,702 (Individual Income Tax Returns)
Here:
$48,702
State:
$95,910
Salary/wage: $43,059 (reported on 80.5% of returns)
Here:
$43,059
State:
$77,331
(% of AGI for various income ranges: 1178.5% for AGIs below $25k, 3859.1% for AGIs $25k-50k, 7023.5% for AGIs $50k-75k, 10188.6% for AGIs $75k-100k, 18839.0% for AGIs $100k-200k, 81366.7% for AGIs over 200k)
Taxable interest for individuals: $691 (reported on 25.6% of returns)
This zip code:
$691
California:
$2,294
(% of AGI for various income ranges: 8.2% for AGIs below $25k, 7.1% for AGIs $25k-50k, 21.0% for AGIs $50k-75k, 41.2% for AGIs $75k-100k, 135.2% for AGIs $100k-200k, 1390.0% for AGIs over 200k)
Ordinary dividends: $4,139 (reported on 9.8% of returns)
Here:
$4,139
State:
$10,949
(% of AGI for various income ranges: 11.5% for AGIs below $25k, 13.8% for AGIs $25k-50k, 33.4% for AGIs $50k-75k, 58.6% for AGIs $75k-100k, 313.2% for AGIs $100k-200k, 5040.0% for AGIs over 200k)
Net capital gain/loss in AGI: +$11,156 (reported on 10.0% of returns)
Here:
+$11,156
State:
+$49,306
(% of AGI for various income ranges: 0.8% for AGIs below $25k, 9.6% for AGIs $25k-50k, 41.0% for AGIs $50k-75k, 74.9% for AGIs $75k-100k, 386.8% for AGIs $100k-200k, 28126.7% for AGIs over 200k)
Profit/loss from business: +$10,535 (reported on 18.0% of returns)
Here:
+$10,535
State:
+$15,671
(% of AGI for various income ranges: 182.9% for AGIs below $25k, 232.9% for AGIs $25k-50k, 297.5% for AGIs $50k-75k, 289.2% for AGIs $75k-100k, 391.0% for AGIs $100k-200k, 9520.0% for AGIs over 200k)
Taxable individual retirement arrangement distribution: $16,110 (reported on 5.0% of returns)
95841:
$16,110
California:
$23,505
(% of AGI for various income ranges: 31.0% for AGIs below $25k, 41.3% for AGIs $25k-50k, 103.2% for AGIs $50k-75k, 208.8% for AGIs $75k-100k, 570.2% for AGIs $100k-200k, 6393.3% for AGIs over 200k)
Total itemized deductions: $27,414 (reported on 7.3% of returns)
Here:
$27,414
State:
$39,517
(% of AGI for various income ranges: 37.9% for AGIs below $25k, 103.9% for AGIs $25k-50k, 342.2% for AGIs $50k-75k, 680.2% for AGIs $75k-100k, 1577.0% for AGIs $100k-200k, 10056.7% for AGIs over 200k)
Charity contributions: $5,947 (reported on 5.5% of returns)
Here:
$5,947
State:
$12,598
(% of AGI for various income ranges: 16.7% for AGIs $25k-50k, 38.2% for AGIs $50k-75k, 88.8% for AGIs $75k-100k, 262.2% for AGIs $100k-200k, 3276.7% for AGIs over 200k)
Taxes paid: $7,092 (reported on 7.3% of returns)
95841:
$7,092
State:
$8,807
(% of AGI for various income ranges: 5.6% for AGIs below $25k, 22.7% for AGIs $25k-50k, 89.4% for AGIs $50k-75k, 222.9% for AGIs $75k-100k, 450.5% for AGIs $100k-200k, 1893.3% for AGIs over 200k)
Earned income credit: $2,296 (reported on 20.8% of returns)
Here:
$2,296
State:
$2,074
(% of AGI for various income ranges: 115.1% for AGIs below $25k, 86.0% for AGIs $25k-50k, 1.5% for AGIs $50k-75k)
Percentage of individuals using paid preparers for their 2020 taxes: 92.8%
Here:
93%
State:
92%
(% for various income ranges: 92.4% for AGIs below $25k, 92.8% for AGIs $25k-50k, 93.9% for AGIs $50k-75k, 92.1% for AGIs $75k-100k, 92.3% for AGIs $100k-200k, 100.0% for AGIs over 200k)
Averages for the 2012 tax year for zip code 95841, filed in 2013:
Average Adjusted Gross Income (AGI) in 2012: $39,926 (Individual Income Tax Returns)
Here:
$39,926
State:
$72,726
Salary/wage: $34,088 (reported on 80.5% of returns)
Here:
$34,088
State:
$59,079
(% of AGI for various income ranges: 71.0% for AGIs below $25k, 79.6% for AGIs $25k-50k, 74.3% for AGIs $50k-75k, 68.9% for AGIs $75k-100k, 66.8% for AGIs $100k-200k, 35.3% for AGIs over 200k)
Taxable interest for individuals: $1,110 (reported on 26.8% of returns)
This zip code:
$1,110
California:
$2,146
(% of AGI for various income ranges: 0.5% for AGIs below $25k, 0.4% for AGIs $25k-50k, 0.5% for AGIs $50k-75k, 0.4% for AGIs $75k-100k, 0.8% for AGIs $100k-200k, 2.5% for AGIs over 200k)
Ordinary dividends: $3,353 (reported on 11.0% of returns)
Here:
$3,353
State:
$9,308
(% of AGI for various income ranges: 0.7% for AGIs below $25k, 0.5% for AGIs $25k-50k, 0.8% for AGIs $50k-75k, 0.9% for AGIs $75k-100k, 1.4% for AGIs $100k-200k, 1.8% for AGIs over 200k)
Net capital gain/loss in AGI: +$2,088 (reported on 8.4% of returns)
Here:
+$2,088
State:
+$30,460
(% of AGI for various income ranges: 0.4% for AGIs $75k-100k, 0.8% for AGIs $100k-200k, 2.4% for AGIs over 200k)
Profit/loss from business: +$11,527 (reported on 17.2% of returns)
Here:
+$11,527
State:
+$17,064
(% of AGI for various income ranges: 13.9% for AGIs below $25k, 3.8% for AGIs $25k-50k, 2.4% for AGIs $50k-75k, 1.8% for AGIs $75k-100k, 2.6% for AGIs $100k-200k, 6.7% for AGIs over 200k)
Taxable individual retirement arrangement distribution: $12,821 (reported on 6.5% of returns)
95841:
$12,821
California:
$19,557
(% of AGI for various income ranges: 1.5% for AGIs below $25k, 1.4% for AGIs $25k-50k, 1.9% for AGIs $50k-75k, 2.5% for AGIs $75k-100k, 5.1% for AGIs $100k-200k)
Self-employment retirement plans: $12,533 (reported on 0.4% of returns)
95841:
$12,533
California:
$24,530
Total itemized deductions: $21,867 (25% of AGI, reported on 22.3% of returns)
Here:
$21,867
State:
$34,004
Here:
25.5% of AGI
State:
22.7% of AGI
(% of AGI for various income ranges: 6.0% for AGIs below $25k, 8.3% for AGIs $25k-50k, 12.1% for AGIs $50k-75k, 15.1% for AGIs $75k-100k, 15.3% for AGIs $100k-200k, 21.6% for AGIs over 200k)
Charity contributions: $3,091 (reported on 17.8% of returns)
Here:
$3,091
State:
$4,659
(% of AGI for various income ranges: 0.4% for AGIs below $25k, 0.8% for AGIs $25k-50k, 1.4% for AGIs $50k-75k, 1.9% for AGIs $75k-100k, 1.8% for AGIs $100k-200k, 2.6% for AGIs over 200k)
Taxes paid: $7,061 (reported on 22.2% of returns)
95841:
$7,061
State:
$14,448
(% of AGI for various income ranges: 1.3% for AGIs below $25k, 1.7% for AGIs $25k-50k, 3.1% for AGIs $50k-75k, 4.5% for AGIs $75k-100k, 6.3% for AGIs $100k-200k, 9.5% for AGIs over 200k)
Earned income credit: $2,334 (reported on 27.6% of returns)
Here:
$2,334
State:
$2,286
(% of AGI for various income ranges: 8.7% for AGIs below $25k, 1.2% for AGIs $25k-50k)
Percentage of individuals using paid preparers for their 2012 taxes: 52.0%
Here:
52%
State:
64%
(% for various income ranges: 51.0% for AGIs below $25k, 49.6% for AGIs $25k-50k, 54.2% for AGIs $50k-75k, 55.8% for AGIs $75k-100k, 60.5% for AGIs $100k-200k, 75.0% for AGIs over 200k)
Averages for the 2004 tax year for zip code 95841, filed in 2005:
Average Adjusted Gross Income (AGI) in 2004: $41,421 (Individual Income Tax Returns)
Here:
$41,421
State:
$58,600
Salary/wage: $34,386 (reported on 84.0% of returns)
Here:
$34,386
State:
$49,455
(% of AGI for various income ranges: 117.1% for AGIs below $10k, 77.8% for AGIs $10k-25k, 83.8% for AGIs $25k-50k, 77.5% for AGIs $50k-75k, 75.6% for AGIs $75k-100k, 45.1% for AGIs over 100k)
Taxable interest for individuals: $2,158 (reported on 38.7% of returns)
This zip code:
$2,158
California:
$2,365
(% of AGI for various income ranges: 5.8% for AGIs below $10k, 1.3% for AGIs $10k-25k, 0.9% for AGIs $25k-50k, 1.0% for AGIs $50k-75k, 1.1% for AGIs $75k-100k, 4.1% for AGIs over 100k)
Taxable dividends: $3,182 (reported on 16.1% of returns)
Here:
$3,182
State:
$4,746
(% of AGI for various income ranges: 2.7% for AGIs below $10k, 0.8% for AGIs $10k-25k, 0.6% for AGIs $25k-50k, 0.8% for AGIs $50k-75k, 0.8% for AGIs $75k-100k, 2.3% for AGIs over 100k)
Net capital gain/loss: +$11,921 (reported on 12.9% of returns)
Here:
+$11,921
State:
+$23,418
(% of AGI for various income ranges: -1.7% for AGIs below $10k, -0.1% for AGIs $10k-25k, 0.2% for AGIs $25k-50k, 0.6% for AGIs $50k-75k, 1.3% for AGIs $75k-100k, 11.3% for AGIs over 100k)
Profit/loss from business: +$11,446 (reported on 14.4% of returns)
Here:
+$11,446
State:
+$16,826
(% of AGI for various income ranges: 9.5% for AGIs below $10k, 5.5% for AGIs $10k-25k, 3.1% for AGIs $25k-50k, 2.7% for AGIs $50k-75k, 3.4% for AGIs $75k-100k, 5.0% for AGIs over 100k)
IRA payment deduction: $2,802 (reported on 2.2% of returns)
95841:
$2,802
California:
$3,192
(% of AGI for various income ranges: 0.2% for AGIs $10k-25k, 0.2% for AGIs $25k-50k, 0.1% for AGIs $50k-75k, 0.2% for AGIs $75k-100k, 0.1% for AGIs over 100k)
Self-employed pension: $9,764 (reported on 0.6% of returns)
Here:
$9,764
California:
$17,688
Total itemized deductions: $19,989 (24% of AGI, reported on 29.8% of returns)
Here:
$19,989
State:
$28,113
Here:
24.4% of AGI
State:
25.3% of AGI
(% of AGI for various income ranges: 16.4% for AGIs below $10k, 7.8% for AGIs $10k-25k, 12.0% for AGIs $25k-50k, 16.5% for AGIs $50k-75k, 19.1% for AGIs $75k-100k, 15.7% for AGIs over 100k)
Charity contributions deductions: $2,875 (3% of AGI, reported on 25.8% of returns)
Here:
$2,875
State:
$3,923
Here:
3.3% of AGI
State:
3.3% of AGI
(% of AGI for various income ranges: 0.8% for AGIs below $10k, 0.7% for AGIs $10k-25k, 1.2% for AGIs $25k-50k, 2.0% for AGIs $50k-75k, 2.5% for AGIs $75k-100k, 2.3% for AGIs over 100k)
Total tax: $6,137 (reported on 74.9% of returns)
95841:
$6,137
State:
$10,761
(% of AGI for various income ranges: 4.1% for AGIs below $10k, 4.2% for AGIs $10k-25k, 7.3% for AGIs $25k-50k, 9.8% for AGIs $50k-75k, 10.6% for AGIs $75k-100k, 18.3% for AGIs over 100k)
Earned income credit: $1,639 (reported on 20.3% of returns)
Here:
$1,639
State:
$1,763
Percentage of individuals using paid preparers for their 2004 taxes: 56.6%
Here:
57%
State:
66%
(% for various income ranges: 52.8% for AGIs below $10k, 57.8% for AGIs $10k-25k, 54.3% for AGIs $25k-50k, 57.8% for AGIs $50k-75k, 59.0% for AGIs $75k-100k, 71.7% for AGIs over 100k)
Likely homosexual households (counted as self-reported same-sex unmarried-partner households)
Lesbian couples: 0.1% of all households
Gay men: 0.2% of all households
Household received Food Stamps/SNAP in the past 12 months: 1,816 Household did not receive Food Stamps/SNAP in the past 12 months: 6,892
Women who had a birth in the past 12 months: 407 (314 now married, 92 unmarried) Women who did not have a birth in the past 12 months: 5,481 (2,504 now married, 2,963 unmarried)
Housing units in zip code 95841 with a mortgage: 2,180 (175 second mortgage, 102 both second mortgage and home equity loan) Median monthly owner costs for units with a mortgage: $1,945 Median monthly owner costs for units without a mortgage: $552
Residents with income below the poverty level in 2022:
This zip code:
16.3%
Whole state:
12.2%
Residents with income below 50% of the poverty level in 2022:
This zip code:
8.3%
Whole state:
6.2%
Median number of rooms in houses and condos:
Here:
6.0
State:
6.0
Median number of rooms in apartments:
Here:
4.1
State:
3.9
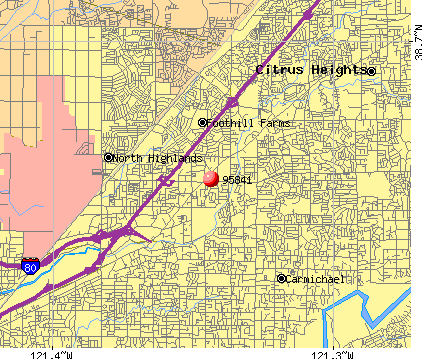
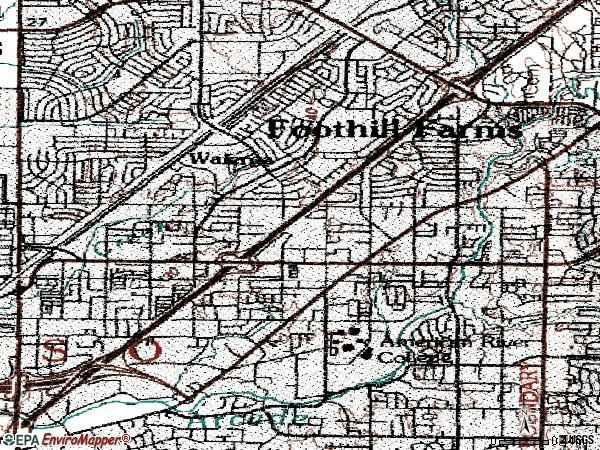
Notable locations in this zip code not listed on our city pages
Notable locations in zip code 95841: Raef Hall (A), Davies Hall (B), Sacramento Metropolitan Fire District Station 24 (C), Sacramento County Sheriff - Garfield Station (D), Federal Bureau of Investigation - Sacramento (E), California Highway Patrol - North Sacramento Office (F). Display/hide their locations on the map
Churches in zip code 95841 include: Christ Community Church (A), First Evangelical Free Church (B), Landmark Baptist Church (C), Shepherd of the Valley Lutheran Church (D), First Baptist Church of Foothill Farms (E), Neighborhood Bible Church (F), Sacramento Christian Life Center (G), Saint Andrews United Methodist Church (H), Tyler Street Church of God (I). Display/hide their locations on the map
Parks in zip code 95841 include: Arcade Creek Park (1), Community Park (2), Manzanita Park (3), Arcade Creek Nature Area (4), Pioneer Park (5), Walerga Park (6). Display/hide their locations on the map
Tourist attraction (not listed on the city page) : Amf Mardi GRAS Lanes (Amusement & Theme Parks; 4800 Madison Avenue).
2,854 married couples with children.
1,439 single-parent households (331 men, 1,108 women).
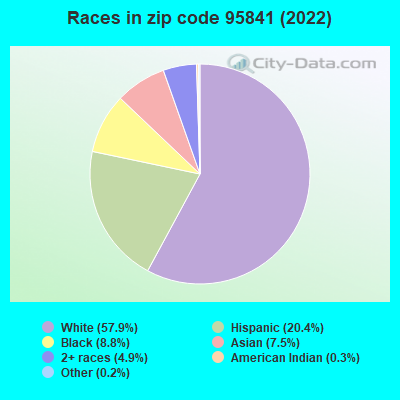
69.2% of residents of 95841 zip code speak English at home.
9.0% of residents speak Spanish at home (74% very well, 18% well, 6% not well, 2% not at all).
15.4% of residents speak other Indo-European language at home (43% very well, 35% well, 18% not well, 4% not at all).
3.9% of residents speak Asian or Pacific Island language at home (40% very well, 29% well, 17% not well, 15% not at all).
2.6% of residents speak other language at home (52% very well, 26% well, 15% not well, 7% not at all).
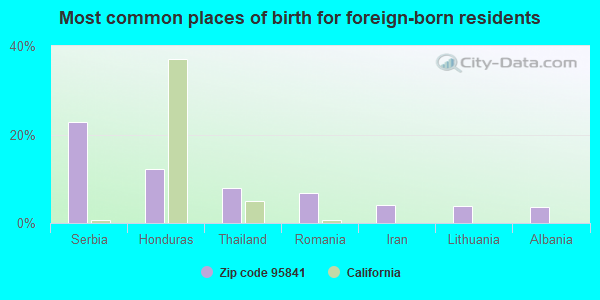
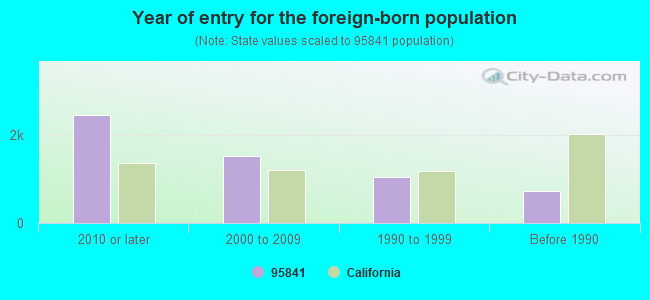
Foreign born population: 5,121 (24.0%) (45.2% of them are naturalized citizens)
Major facilities with environmental interests located in this zip code:
FULTON BODY SHOP (1825 FULTON AVENUE in SACRAMENTO, CA)
STATE MASTER (California - Hazardous Waste Tracking) - HAZARDOU WASTE PROGRAM Small Quantity Generators, between 100 kg and 1000 kg of hazardous waste/month (Resource Conservation and Recovery Act (tracking hazardous waste)) - notification Business NAICS classification: GENERAL AUTOMOTIVE REPAIR. Organizations: SHAW AND SHERMAN INC (CONTACT/OWNER)
NIELLO PORSCHE AUDI (4609 MADISON AVE in SACRAMENTO, CA)
STATE MASTER (California - Hazardous Waste Tracking) - HAZARDOU WASTE PROGRAM Small Quantity Generators, between 100 kg and 1000 kg of hazardous waste/month (Resource Conservation and Recovery Act (tracking hazardous waste)) - notification Organizations: RICK NIELLO (CONTACT/OWNER)
Alternative names: NIELLO ACURA PORSCHE
EQUILON ENTERPRISES (5045 MADISON AVE in SACRAMENTO, CA) . Federal Facility
STATE MASTER (California - Hazardous Waste Tracking) - HAZARDOU WASTE PROGRAM Small Quantity Generators, between 100 kg and 1000 kg of hazardous waste/month (Resource Conservation and Recovery Act (tracking hazardous waste)) - notification Organizations: EQUILON ENTERPRISES, LLC (CONTACT/OWNER)
Alternative names: SHELL OIL CO
LA ENTRADA CONTINUATION HIGH (5320 HEMLOCK ST. in SACRAMENTO, CA)
(National Center for Education Statistics) - STATE ID-3430097 Organizations: SAN JUAN UNIFIED (SCHOOL DISTRICT)
EN RICHMOND TRUST (5412 MADISON AVENUE in SACRAMENTO, CA)
Large Quantity Generators, more that 1000 kg of hazardous waste/month (Resource Conservation and Recovery Act (tracking hazardous waste)) - notification Alternative names: MADISON AVE CLEANERS
JC & SONS INC (4434 AUBURN BLVD in SACRAMENTO, CA)
COMPLIANCE ACTIVITY (Tracking inspections of insecticide, fungicide, and rodenticide, and toxic substances)
ALLENS CLEANERS (5136 MADISON AVE in SACRAMENTO, CA)
CRITERIA AND HAZARDOUS AIR POLLUTANT INVENTORY (Inventory of air pollution sources) Small Quantity Generators, between 100 kg and 1000 kg of hazardous waste/month (Resource Conservation and Recovery Act (tracking hazardous waste)) Business SIC classification: DRYCLEANING PLANTS, EXCEPT RUG CLEANING
FOOTHILL AUTO BODY (4555 AUBURN BLVD #19 in SACRAMENTO, CA)
Small Quantity Generators, between 100 kg and 1000 kg of hazardous waste/month (Resource Conservation and Recovery Act (tracking hazardous waste)) - notification Organizations: KEN GILBERT (CONTACT/OWNER)
LETTERING SYSTEMS (4521-A ORANGE GROVE AVE in SACRAMENTO, CA)
Small Quantity Generators, between 100 kg and 1000 kg of hazardous waste/month (Resource Conservation and Recovery Act (tracking hazardous waste)) - notification Organizations: TERRY BLEVINS (CONTACT/OWNER)
CARTERS AUTOMOTIVE REPAIR (5831 ROSEBUD LANE #K in SACRAMENTO, CA)
Small Quantity Generators, between 100 kg and 1000 kg of hazardous waste/month (Resource Conservation and Recovery Act (tracking hazardous waste)) - notification Organizations: THOMAS O CARTER (CONTACT/OWNER)
GOOD TIMES KAWASAKI (5040 AUBURN BLVD in SACRAMENTO, CA)
Small Quantity Generators, between 100 kg and 1000 kg of hazardous waste/month (Resource Conservation and Recovery Act (tracking hazardous waste)) Business NAICS classification: MOTORCYCLE DEALERS.
HORNS FIAT SVC (5753 AUBURN AVE #20 in SACRAMENTO, CA)
Small Quantity Generators, between 100 kg and 1000 kg of hazardous waste/month (Resource Conservation and Recovery Act (tracking hazardous waste)) Business NAICS classification: GENERAL AUTOMOTIVE REPAIR.
JIFFY LUBE INTERNATIONAL 388 (5154 AUBURN BLVD in SACRAMENTO, CA)
USED OIL PROGRAM (Resource Conservation and Recovery Act (tracking hazardous waste)) Business NAICS classification: ALL OTHER AUTOMOTIVE REPAIR AND MAINTENANCE. Organizations: PENNZOIL CO (CONTACT/OWNER)
Housing units lacking complete plumbing facilities: 0.5% Housing units lacking complete kitchen facilities: 0.6%
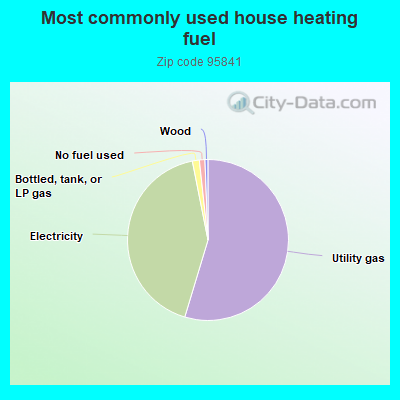
54.5%Utility gas
42.1%Electricity
1.4%Bottled, tank, or LP gas
1.1%No fuel used
0.6%Wood
Population in 1990: 21,161.
Place of birth for U.S.-born residents:
This state: 12,886
Northeast: 526
Midwest: 899
South: 649
West: 848
41% of the 95841 zip code residents lived in the same house 5 years ago. Out of people who lived in different houses, 66% lived in this county. Out of people who lived in different counties, 50% lived in California.
84% of the 95841 zip code residents lived in the same house 1 year ago. Out of people who lived in different houses, 60% moved from this county. Out of people who lived in different houses, 22% moved from different county within same state. Out of people who lived in different houses, 4% moved from different state. Out of people who lived in different houses, 12% moved from abroad.
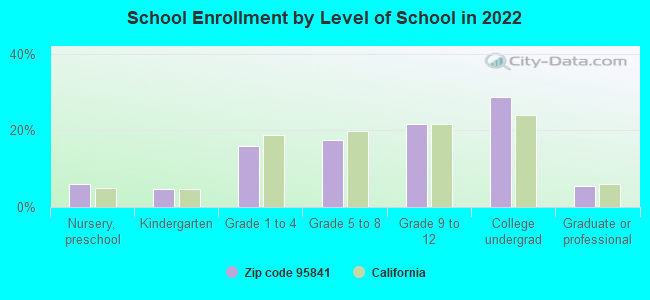
Private vs. public school enrollment:
Students in private schools in grades 1 to 8 (elementary and middle school): 49
Here:
3.0%
California:
10.5%
Students in private schools in grades 9 to 12 (high school): 25
Here:
2.4%
California:
8.5%
Students in private undergraduate colleges: 71
Here:
5.1%
California:
15.9%
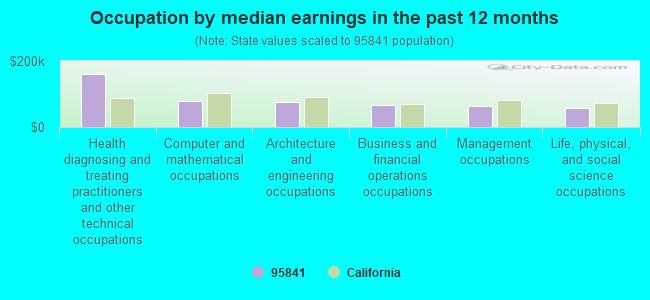
Occupation by median earnings in the past 12 months ($)
160,336Health diagnosing and treating practitioners and other technical occupations
78,229Computer and mathematical occupations
76,265Architecture and engineering occupations
66,737Business and financial operations occupations
64,398Management occupations
58,643Life, physical, and social science occupations
Companies with federal contracts located in this zip code:
MARIA PANTIS (6100 WENDAL LN in SACRAMENTO, CA; small business) : $2,281,397 in 192 contractsfrom 2000 to 2006
Contracts for Aircraft Hydraulic, Vacuum, and De-icing System Components, Aircraft Propellers and Components, Engine Instruments, Blocks, Tackle, Rigging, and Slings, and moreby Defense Logistics Agency, Navy, Army Signed by year:2000: $39,806; 2001: $176,698; 2002: $131,491; 2003: $600; 2004: $471,274; 2005: $812,950; 2006: $648,578.
Biggest contracts:
$75,000 with Defense Logistics Agency for Aircraft Hydraulic, Vacuum, and De-icing System Components. Signed on 2006-04-07. Completion date: 2006-05-07.
$69,000 with Defense Logistics Agency for Aircraft Propellers and Components. Signed on 2006-01-13. Completion date: 2006-02-12.
$66,990 with Defense Logistics Agency for Engine Instruments. Signed on 2001-02-12. Completion date: 2001-05-18.
$65,100 with Defense Logistics Agency for Blocks, Tackle, Rigging, and Slings. Signed on 2004-10-18. Completion date: 2004-11-18.
OAKPOINT BUILDING, LLC ( in Sacramento, CA; small business) : $349,330 in 23 contractsfrom 2003 to 2006
Contracts for Lease or Rental of Facilities -- Office Buildings by Public Buildings Service Signed by year:2000: $0; 2001: $0; 2002: $0; 2003: $17,426; 2004: $52,332; 2005: $139,732; 2006: $139,840.
Biggest contracts:
$17,480 with Public Buildings Service for Lease or Rental of Facilities -- Office Buildings. Signed on 2006-01-01. Completion date: 2006-09-30.
$17,480, same as above.Signed on 2006-07-01. Completion date: 2006-09-30.
$17,480, same as above.Signed on 2006-07-01. Completion date: 2006-09-30.
$17,480, same as above.Signed on 2006-07-01. Completion date: 2006-09-30.
SACRAMENTO WINDOW SHADE MFG (5710 AUBURN BLVD SUITE #2 in SACRAMENTO, CA; small business) : $127,741 in 15 contractsfrom 2002 to 2004
Contracts for Textile Fabrics, Draperies, Awnings, and Shades by Bureau of Prisoners/Federal Prison System, Army, Public Buildings Service Signed by year:2000: $0; 2001: $0; 2002: $79,915; 2003: $6,779; 2004: $41,047; 2005: $0; 2006: $0.
Biggest contracts:
$29,000 with Bureau of Prisoners/Federal Prison System for Textile Fabrics. Taking place in VA. Signed on 2002-10-15. Completion date: 2005-09-15.
$19,157 with Army for Draperies, Awnings, and Shades. Signed on 2004-08-28. Completion date: 2004-10-18.
$15,000 with Bureau of Prisoners/Federal Prison System for Textile Fabrics. Taking place in VA. Signed on 2002-10-15. Completion date: 2005-09-15.
$14,143 with Army for Draperies, Awnings, and Shades. Signed on 2004-09-28. Completion date: 2004-11-01.
CLARKE & RUSH MECHANICAL INC (4411 AUBURN BLVD in SACRAMENTO, CA; small business) : $49,145 in 14 contractsfrom 2001 to 2005
Contracts for Fans, Air Circulators, and Blower Equipment, Other Professional Services, Maintenance, Repair and Rebuilding of Equipment -- Miscellaneous by Bureau of Reclamation, Navy Signed by year:2000: $0; 2001: $41,483; 2002: $2,647; 2003: $784; 2004: $4,205; 2005: $26; 2006: $0.
Biggest contracts:
$35,000 with Bureau of Reclamation for Fans, Air Circulators, and Blower Equipment. Signed on 2001-03-15. Completion date: 2001-06-15.
$6,483 with Navy for Other Professional Services. Signed on 2001-12-04. Completion date: 2002-09-30.
$4,940 with Navy for Maintenance, Repair and Rebuilding of Equipment -- Miscellaneous. Signed on 2005-10-20. Completion date: 2006-09-30.
$4,940, same as above.Signed on 2004-10-01. Completion date: 2003-09-30.
HOLIDAY INN NORTHEAST (5321 DATE AVE in SACRAMENTO, CA; small business) : $30,704 in 3 contractsin 2004
$14,322 with Army for Lodging - Hotel/Motel. Signed on 2004-12-02. Completion date: 2004-12-11.
$9,732, same as above.Signed on 2004-10-03. Completion date: 2004-10-09.
$6,650, same as above.Signed on 2004-10-22. Completion date: 2004-10-29.
FAMAND, INC (5728 GARFIELD AVE STE 11 in SACRAMENTO, CA; small business)
$24,100 with Defense Commissary Agency for Maintenance, Repair and Rebuilding of Equipment -- Miscellaneous. Signed on 2005-04-29. Completion date: 2006-05-01.
SACRAMENTO EXCERCISE EQUIPMENT (5154C AUBURN BLVD in SACRAMENTO, CA; small business) : $11,066 in 2 contractsin 2005
$6,105 with Navy for Miscellaneous Items. Signed on 2005-08-04. Completion date: 2005-09-04.
$4,961 with Department of Defense for Athletic and Sporting Equipment. Signed on 2005-09-01. Completion date: 2005-09-09.
C M S H ELECTRICAL (4331 AUBURN BLVD in SACRAMENTO, CA; small business) : $0 in 2 contractsfrom 2003 to 2005
$7,943 with Army for Indoor and Outdoor Electric Lighting Fixtures. Signed on 2003-04-04. Completion date: 2003-04-10.
-$7,943, same as above.Signed on 2005-07-19. Completion date: 2003-04-10.
Top industries in this zip code by the number of employees in 2005:
2005 - 2018 National Fire Incident Reporting System (NFIRS) incidents
Based on the data from the years 2005 - 2018 the average number of fire incidents per year is 77. The highest number of reported fire incidents - 118 took place in 2018, and the least - 21 in 2007. The data has an increasing trend.
When looking into fire subcategories, the most reports belonged to: Outside Fires (49.9%), and Structure Fires (24.7%).
Fire incident types reported to NFIRS in Zip Code 95841


 Nearest zip codes: 95842, 95660, 95608, 95821, 95621, 95652.


 Based on the data from the years 2005 - 2018 the average number of fire incidents per year is 77. The highest number of reported fire incidents - 118 took place in 2018, and the least - 21 in 2007. The data has an increasing trend.
 When looking into fire subcategories, the most reports belonged to: Outside Fires (49.9%), and Structure Fires (24.7%).