Estimated zip code population in 2022: 22,554 Zip code population in 2010: 21,460 Zip code population in 2000: 20,663
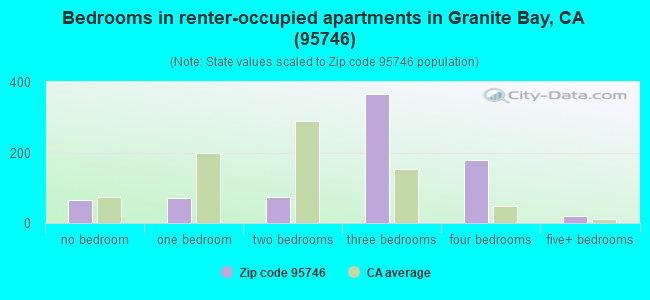
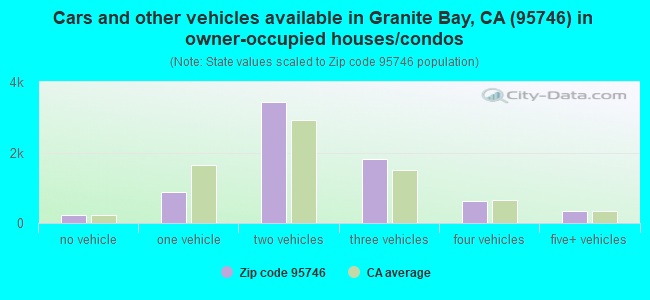
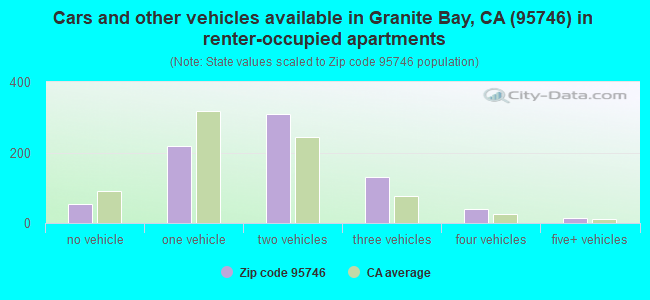
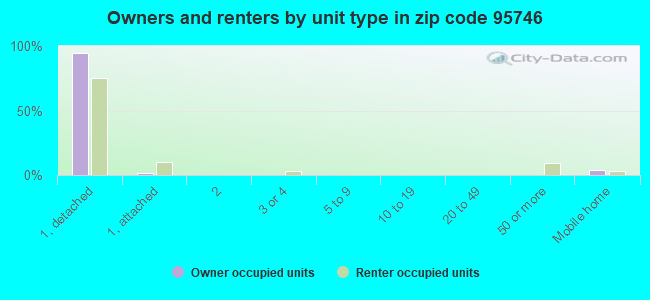
Houses and condos: 8,313 Renter-occupied apartments: 770
% of renters here:
10%
State:
44%
March 2022 cost of living index in zip code 95746: 104.1 (near average, U.S. average is 100)
Land area: 17.7 sq. mi. Water area: 0.0 sq. mi.
Population density: 1,277 people per square mile
(low).
OSM Map
General Map
Google Map
MSN Map
OSM Map
General Map
Google Map
MSN Map
OSM Map
General Map
Google Map
MSN Map
OSM Map
General Map
Google Map
MSN Map
Please wait while loading the map...
Real estate property taxes paid for housing units in 2022:
This zip code:
0.8% ($8,429)
California:
0.7% ($4,831)
Median real estate property taxes paid for housing units with mortgages in 2022: $8,879 (0.8%) Median real estate property taxes paid for housing units with no mortgage in 2022: $7,539 (0.8%)
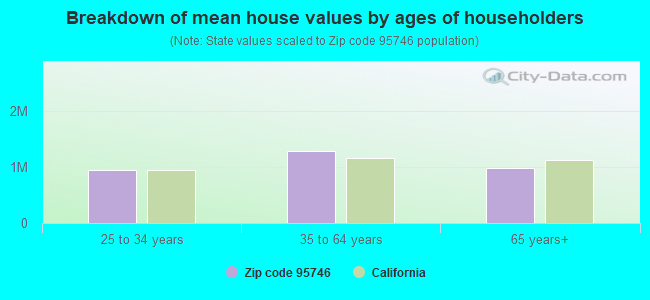
Estimated median house/condo value in 2022: $1,048,387
95746:
$1,048,387
California:
$715,900
According to our research of California and other state lists, there were 5 registered sex offenders living in 95746 zip code as of April 27, 2024. The ratio of all residents to sex offenders in zip code 95746 is 4,795 to 1. The ratio of registered sex offenders to all residents in this zip code is much lower than the state average.
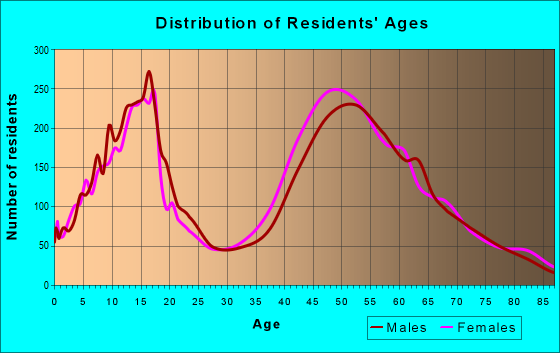
Median resident age:
This zip code:
48.8 years
California median age:
37.9 years
Average household size:
This zip code:
2.8 people
California:
2.8 people
Averages for the 2020 tax year for zip code 95746, filed in 2021:
Average Adjusted Gross Income (AGI) in 2020: $226,304 (Individual Income Tax Returns)
Here:
$226,304
State:
$95,910
Salary/wage: $167,915 (reported on 73.1% of returns)
Here:
$167,915
State:
$77,331
(% of AGI for various income ranges: 1244.0% for AGIs below $25k, 3542.9% for AGIs $25k-50k, 6290.0% for AGIs $50k-75k, 8688.4% for AGIs $75k-100k, 18861.4% for AGIs $100k-200k, 123719.8% for AGIs over 200k)
Taxable interest for individuals: $3,525 (reported on 63.4% of returns)
This zip code:
$3,525
California:
$2,294
(% of AGI for various income ranges: 34.0% for AGIs below $25k, 88.3% for AGIs $25k-50k, 187.6% for AGIs $50k-75k, 321.1% for AGIs $75k-100k, 358.3% for AGIs $100k-200k, 2067.2% for AGIs over 200k)
Ordinary dividends: $15,069 (reported on 45.6% of returns)
Here:
$15,069
State:
$10,949
(% of AGI for various income ranges: 63.1% for AGIs below $25k, 226.8% for AGIs $25k-50k, 386.5% for AGIs $50k-75k, 568.2% for AGIs $75k-100k, 1308.1% for AGIs $100k-200k, 6549.8% for AGIs over 200k)
Net capital gain/loss in AGI: +$68,973 (reported on 44.5% of returns)
Here:
+$68,973
State:
+$49,306
(% of AGI for various income ranges: 66.2% for AGIs below $25k, 142.2% for AGIs $25k-50k, 398.6% for AGIs $50k-75k, 645.2% for AGIs $75k-100k, 1531.4% for AGIs $100k-200k, 37137.2% for AGIs over 200k)
Profit/loss from business: +$44,807 (reported on 20.4% of returns)
Here:
+$44,807
State:
+$15,671
(% of AGI for various income ranges: 99.9% for AGIs below $25k, 352.9% for AGIs $25k-50k, 692.4% for AGIs $50k-75k, 763.0% for AGIs $75k-100k, 1688.0% for AGIs $100k-200k, 8578.9% for AGIs over 200k)
Taxable individual retirement arrangement distribution: $32,484 (reported on 14.2% of returns)
95746:
$32,484
California:
$23,505
(% of AGI for various income ranges: 86.7% for AGIs below $25k, 242.2% for AGIs $25k-50k, 680.6% for AGIs $50k-75k, 846.4% for AGIs $75k-100k, 1960.9% for AGIs $100k-200k, 2508.3% for AGIs over 200k)
Self-employed (Keogh) retirement plans: $35,706 (reported on 3.1% of returns)
95746:
$35,706
California:
$30,163
(% of AGI for various income ranges: 86.9% for AGIs $50k-75k, 142.8% for AGIs $100k-200k, 1201.1% for AGIs over 200k)
Total itemized deductions: $43,455 (reported on 33.5% of returns)
Here:
$43,455
State:
$39,517
(% of AGI for various income ranges: 185.1% for AGIs below $25k, 554.9% for AGIs $25k-50k, 1205.1% for AGIs $50k-75k, 1785.2% for AGIs $75k-100k, 3530.3% for AGIs $100k-200k, 12308.8% for AGIs over 200k)
Charity contributions: $12,791 (reported on 29.2% of returns)
Here:
$12,791
State:
$12,598
(% of AGI for various income ranges: 8.1% for AGIs below $25k, 44.7% for AGIs $25k-50k, 92.5% for AGIs $50k-75k, 210.5% for AGIs $75k-100k, 595.6% for AGIs $100k-200k, 3930.2% for AGIs over 200k)
Taxes paid: $9,348 (reported on 33.5% of returns)
95746:
$9,348
State:
$8,807
(% of AGI for various income ranges: 42.4% for AGIs below $25k, 115.6% for AGIs $25k-50k, 262.2% for AGIs $50k-75k, 480.7% for AGIs $75k-100k, 947.5% for AGIs $100k-200k, 2376.7% for AGIs over 200k)
Earned income credit: $1,360 (reported on 4.2% of returns)
Here:
$1,360
State:
$2,074
(% of AGI for various income ranges: 30.0% for AGIs below $25k, 31.2% for AGIs $25k-50k)
Percentage of individuals using paid preparers for their 2020 taxes: 93.3%
Here:
93%
State:
92%
(% for various income ranges: 90.9% for AGIs below $25k, 94.1% for AGIs $25k-50k, 92.6% for AGIs $50k-75k, 94.0% for AGIs $75k-100k, 92.7% for AGIs $100k-200k, 95.3% for AGIs over 200k)
Averages for the 2012 tax year for zip code 95746, filed in 2013:
Average Adjusted Gross Income (AGI) in 2012: $162,723 (Individual Income Tax Returns)
Here:
$162,723
State:
$72,726
Salary/wage: $122,526 (reported on 75.4% of returns)
Here:
$122,526
State:
$59,079
(% of AGI for various income ranges: 68.5% for AGIs below $25k, 60.0% for AGIs $25k-50k, 54.9% for AGIs $50k-75k, 55.4% for AGIs $75k-100k, 67.3% for AGIs $100k-200k, 53.4% for AGIs over 200k)
Taxable interest for individuals: $3,649 (reported on 61.2% of returns)
This zip code:
$3,649
California:
$2,146
(% of AGI for various income ranges: 2.2% for AGIs below $25k, 1.8% for AGIs $25k-50k, 2.6% for AGIs $50k-75k, 1.4% for AGIs $75k-100k, 0.9% for AGIs $100k-200k, 1.4% for AGIs over 200k)
Ordinary dividends: $17,371 (reported on 44.4% of returns)
Here:
$17,371
State:
$9,308
(% of AGI for various income ranges: 4.9% for AGIs below $25k, 3.4% for AGIs $25k-50k, 3.6% for AGIs $50k-75k, 3.2% for AGIs $75k-100k, 2.5% for AGIs $100k-200k, 5.6% for AGIs over 200k)
Net capital gain/loss in AGI: +$22,609 (reported on 41.7% of returns)
Here:
+$22,609
State:
+$30,460
(% of AGI for various income ranges: 1.4% for AGIs $25k-50k, 1.5% for AGIs $50k-75k, 0.8% for AGIs $75k-100k, 1.6% for AGIs $100k-200k, 8.0% for AGIs over 200k)
Profit/loss from business: +$38,279 (reported on 21.1% of returns)
Here:
+$38,279
State:
+$17,064
(% of AGI for various income ranges: 11.4% for AGIs below $25k, 9.2% for AGIs $25k-50k, 5.9% for AGIs $50k-75k, 5.6% for AGIs $75k-100k, 5.5% for AGIs $100k-200k, 4.4% for AGIs over 200k)
Taxable individual retirement arrangement distribution: $25,860 (reported on 15.5% of returns)
95746:
$25,860
California:
$19,557
(% of AGI for various income ranges: 5.2% for AGIs below $25k, 4.8% for AGIs $25k-50k, 4.6% for AGIs $50k-75k, 7.0% for AGIs $75k-100k, 4.1% for AGIs $100k-200k, 1.4% for AGIs over 200k)
Self-employment retirement plans: $31,010 (reported on 2.9% of returns)
95746:
$31,010
California:
$24,530
(% of AGI for various income ranges: 0.5% for AGIs $50k-75k, 0.6% for AGIs $100k-200k, 0.6% for AGIs over 200k)
Total itemized deductions: $49,315 (20% of AGI, reported on 60.5% of returns)
Here:
$49,315
State:
$34,004
Here:
19.8% of AGI
State:
22.7% of AGI
(% of AGI for various income ranges: 27.4% for AGIs below $25k, 23.8% for AGIs $25k-50k, 23.1% for AGIs $50k-75k, 22.5% for AGIs $75k-100k, 22.4% for AGIs $100k-200k, 16.1% for AGIs over 200k)
Charity contributions: $6,396 (reported on 54.3% of returns)
Here:
$6,396
State:
$4,659
(% of AGI for various income ranges: 1.2% for AGIs below $25k, 2.0% for AGIs $25k-50k, 2.3% for AGIs $50k-75k, 2.5% for AGIs $75k-100k, 2.5% for AGIs $100k-200k, 2.0% for AGIs over 200k)
Taxes paid: $24,336 (reported on 60.3% of returns)
95746:
$24,336
State:
$14,448
(% of AGI for various income ranges: 6.0% for AGIs below $25k, 6.0% for AGIs $25k-50k, 6.5% for AGIs $50k-75k, 7.2% for AGIs $75k-100k, 8.9% for AGIs $100k-200k, 9.5% for AGIs over 200k)
Earned income credit: $1,578 (reported on 5.8% of returns)
Here:
$1,578
State:
$2,286
(% of AGI for various income ranges: 2.6% for AGIs below $25k, 0.5% for AGIs $25k-50k)
Percentage of individuals using paid preparers for their 2012 taxes: 61.0%
Here:
61%
State:
64%
(% for various income ranges: 49.3% for AGIs below $25k, 57.1% for AGIs $25k-50k, 60.6% for AGIs $50k-75k, 64.4% for AGIs $75k-100k, 63.4% for AGIs $100k-200k, 75.4% for AGIs over 200k)
Averages for the 2004 tax year for zip code 95746, filed in 2005:
Average Adjusted Gross Income (AGI) in 2004: $134,894 (Individual Income Tax Returns)
Here:
$134,894
State:
$58,600
Salary/wage: $107,468 (reported on 76.3% of returns)
Here:
$107,468
State:
$49,455
(% of AGI for various income ranges: 61.6% for AGIs $10k-25k, 56.8% for AGIs $25k-50k, 57.5% for AGIs $50k-75k, 63.2% for AGIs $75k-100k, 59.7% for AGIs over 100k)
Taxable interest for individuals: $3,236 (reported on 71.2% of returns)
This zip code:
$3,236
California:
$2,365
(% of AGI for various income ranges: 4.5% for AGIs $10k-25k, 4.1% for AGIs $25k-50k, 2.7% for AGIs $50k-75k, 1.9% for AGIs $75k-100k, 1.4% for AGIs over 100k)
Taxable dividends: $5,209 (reported on 51.9% of returns)
Here:
$5,209
State:
$4,746
(% of AGI for various income ranges: 5.2% for AGIs $10k-25k, 4.1% for AGIs $25k-50k, 2.9% for AGIs $50k-75k, 2.4% for AGIs $75k-100k, 1.7% for AGIs over 100k)
Net capital gain/loss: +$30,891 (reported on 47.5% of returns)
Here:
+$30,891
State:
+$23,418
(% of AGI for various income ranges: 2.9% for AGIs $10k-25k, 0.9% for AGIs $25k-50k, 1.8% for AGIs $50k-75k, 2.6% for AGIs $75k-100k, 12.3% for AGIs over 100k)
Profit/loss from business: +$41,675 (reported on 23.0% of returns)
Here:
+$41,675
State:
+$16,826
(% of AGI for various income ranges: 9.1% for AGIs $10k-25k, 9.7% for AGIs $25k-50k, 10.6% for AGIs $50k-75k, 8.4% for AGIs $75k-100k, 6.7% for AGIs over 100k)
IRA payment deduction: $3,883 (reported on 4.0% of returns)
95746:
$3,883
California:
$3,192
(% of AGI for various income ranges: 0.4% for AGIs $10k-25k, 0.4% for AGIs $25k-50k, 0.3% for AGIs $50k-75k, 0.3% for AGIs $75k-100k, 0.1% for AGIs over 100k)
Self-employed pension: $23,372 (reported on 4.8% of returns)
Here:
$23,372
California:
$17,688
(% of AGI for various income ranges: 0.4% for AGIs $25k-50k, 0.6% for AGIs $50k-75k, 0.7% for AGIs $75k-100k, 0.9% for AGIs over 100k)
Total itemized deductions: $43,406 (21% of AGI, reported on 62.6% of returns)
Here:
$43,406
State:
$28,113
Here:
21.0% of AGI
State:
25.3% of AGI
(% of AGI for various income ranges: 30.9% for AGIs $10k-25k, 28.1% for AGIs $25k-50k, 30.0% for AGIs $50k-75k, 28.5% for AGIs $75k-100k, 18.2% for AGIs over 100k)
Charity contributions deductions: $5,967 (3% of AGI, reported on 58.5% of returns)
Here:
$5,967
State:
$3,923
Here:
2.8% of AGI
State:
3.3% of AGI
(% of AGI for various income ranges: 2.1% for AGIs $10k-25k, 2.6% for AGIs $25k-50k, 3.0% for AGIs $50k-75k, 3.1% for AGIs $75k-100k, 2.5% for AGIs over 100k)
Total tax: $31,330 (reported on 82.8% of returns)
95746:
$31,330
State:
$10,761
(% of AGI for various income ranges: 5.3% for AGIs $10k-25k, 7.8% for AGIs $25k-50k, 8.6% for AGIs $50k-75k, 9.5% for AGIs $75k-100k, 20.9% for AGIs over 100k)
Earned income credit: $1,340 (reported on 3.6% of returns)
Here:
$1,340
State:
$1,763
Percentage of individuals using paid preparers for their 2004 taxes: 63.8%
Here:
64%
State:
66%
(% for various income ranges: 51.1% for AGIs below $10k, 57.3% for AGIs $10k-25k, 61.3% for AGIs $25k-50k, 68.8% for AGIs $50k-75k, 66.2% for AGIs $75k-100k, 71.3% for AGIs over 100k)
Household received Food Stamps/SNAP in the past 12 months: 249 Household did not receive Food Stamps/SNAP in the past 12 months: 7,639
Women who had a birth in the past 12 months: 162 (81 now married, 82 unmarried) Women who did not have a birth in the past 12 months: 4,224 (2,108 now married, 2,098 unmarried)
Housing units in zip code 95746 with a mortgage: 4,801 (660 second mortgage, 28 home equity loan, 566 both second mortgage and home equity loan) Houses without a mortgage: 65
Median monthly owner costs for units with a mortgage: $3,876 Median monthly owner costs for units without a mortgage: $1,132
Residents with income below the poverty level in 2022:
This zip code:
5.2%
Whole state:
12.2%
Residents with income below 50% of the poverty level in 2022:
This zip code:
2.7%
Whole state:
6.2%
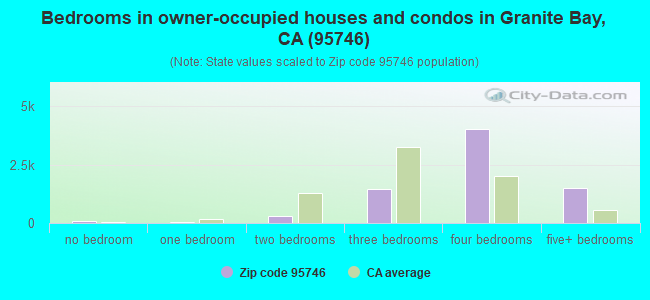
Median number of rooms in houses and condos:
Here:
7.9
State:
6.0
Median number of rooms in apartments:
Here:
5.4
State:
3.9
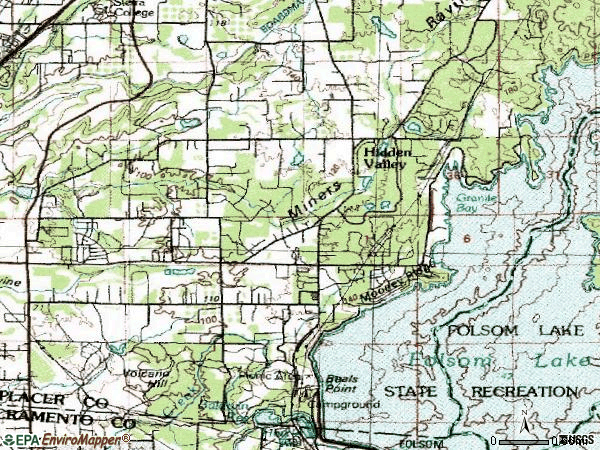
Notable locations in this zip code not listed on our city pages
Notable locations in zip code 95746: Granite Bay Golf Course (A), Stallman Corners (B), Rolling Greens Golf Course (C), Beals Point Campground (D), South Placer Fire Station (E), Placer County Fire Department Station 19 / South Placer Fire Department Station 3 (F), Placer County Fire Department Station 16 / South Placer Fire Department Station 4 (G), Placer County Fire Department Station 17 / South Placer Fire Department Station 1 (H), Placer County Fire Department Station 15 / South Placer Fire Department Station 6 (I). Display/hide their locations on the map
In group quarters: 140 (-1 institutionalized population)
Size of family households: 2,919 2-persons, 1,613 3-persons, 1,339 4-persons, 529 5-persons, 238 6-persons, 30 7-or-more-persons
Size of nonfamily households: 1,095 1-person, 220 2-persons, 39 3-persons
4,111 married couples with children.
589 single-parent households (287 men, 302 women).
85.4% of residents of 95746 zip code speak English at home.
4.6% of residents speak Spanish at home (88% very well, 3% well, 9% not well).
5.3% of residents speak other Indo-European language at home (87% very well, 6% well, 5% not well, 2% not at all).
3.6% of residents speak Asian or Pacific Island language at home (83% very well, 16% well, 1% not well).
1.0% of residents speak other language at home (83% very well, 17% well).
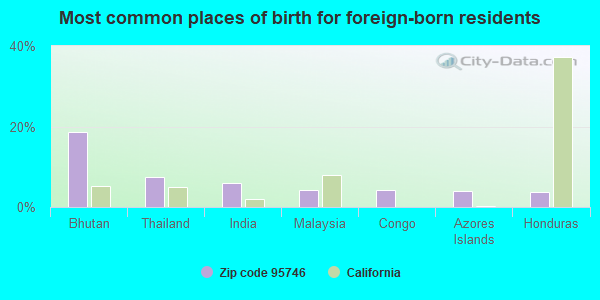
Foreign born population: 2,373 (10.5%) (74.8% of them are naturalized citizens)
This zip code:
10.5%
Whole state:
26.7%
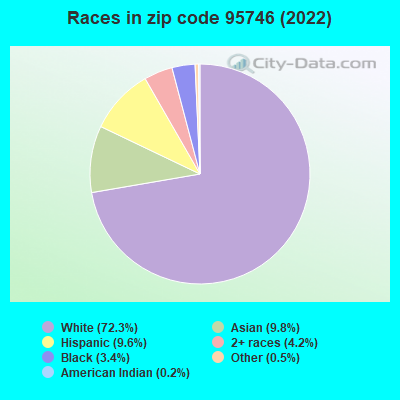
19%Bhutan
7%Thailand
6%India
4%Malaysia
4%Congo
4%Azores Islands
4%Honduras
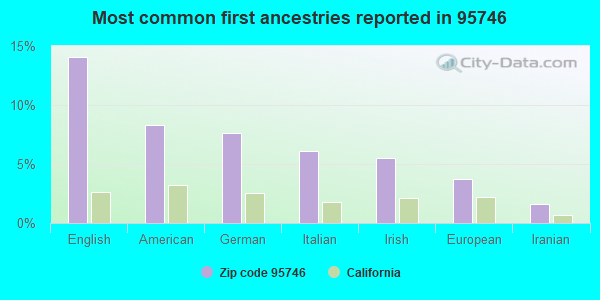
14%English
8%American
8%German
6%Italian
6%Irish
4%European
2%Iranian
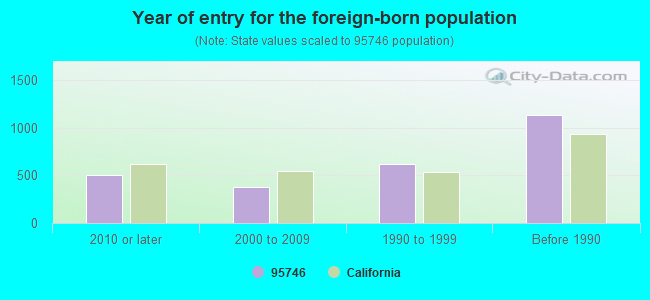
Year of entry for the foreign-born population
5002010 or later
3832000 to 2009
6231990 to 1999
1,136Before 1990
Facilities with environmental interests located in this zip code:
EUREKA ELEMENTARY (5477 EUREKA ROAD in GRANITE BAY, CA)
(National Center for Education Statistics) - STATE ID-6031090 Organizations: EUREKA UNION ELEMENTARY (SCHOOL DISTRICT)
GRANITE BAY HIGH (1 GRIZZLY WAY in GRANITE BAY, CA)
(National Center for Education Statistics) - STATE ID-3130184 Organizations: ROSEVILLE JOINT UNION HIGH (SCHOOL DISTRICT)
GREENHILLS ELEMENTARY (8200 GREENHILLS WAY in GRANITE BAY, CA)
(National Center for Education Statistics) - STATE ID-6031108 Organizations: EUREKA UNION ELEMENTARY (SCHOOL DISTRICT)
CAVITT (WILLMA) JUNIOR HIGH SCHOOL (7200 FULLER DR. in GRANITE BAY, CA)
(National Center for Education Statistics) - STATE ID-6101778 Organizations: EUREKA UNION ELEMENTARY (SCHOOL DISTRICT)
JOSEPH D LOPEZ (6812 BRANDY CIRCLE in GRANITE BAY, CA)
TRANSPORTER (Resource Conservation and Recovery Act (tracking hazardous waste))
KITS CAMERAS 1 HOUR NO 136 (2030 DOUGLAS BLVD STE 16 in ROSEVILLE, CA)
Small Quantity Generators, between 100 kg and 1000 kg of hazardous waste/month (Resource Conservation and Recovery Act (tracking hazardous waste)) - notification Organizations: RITZ CAMERA CENTERS INC (CONTACT/OWNER)
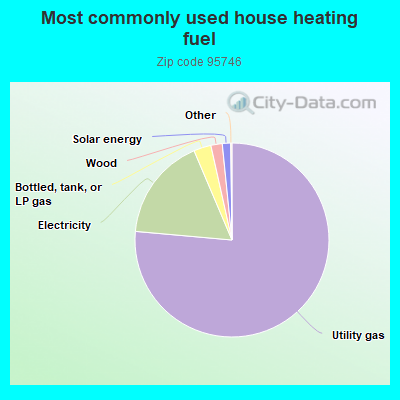
Housing units lacking complete kitchen facilities: 0.6%
76.5%Utility gas
17.2%Electricity
2.9%Bottled, tank, or LP gas
1.9%Wood
1.4%Solar energy
Place of birth for U.S.-born residents:
This state: 13,869
Northeast: 1,716
Midwest: 1,866
South: 993
West: 1,322
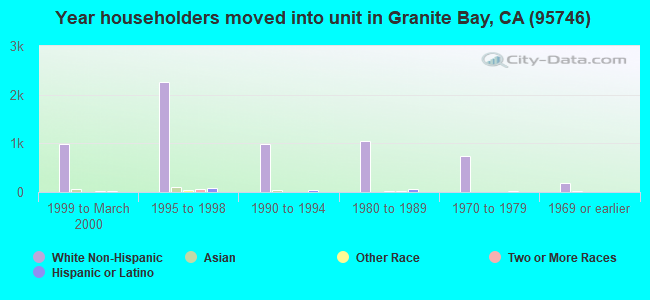
46% of the 95746 zip code residents lived in the same house 5 years ago. Out of people who lived in different houses, 27% lived in this county. Out of people who lived in different counties, 50% lived in California.
91% of the 95746 zip code residents lived in the same house 1 year ago. Out of people who lived in different houses, 27% moved from this county. Out of people who lived in different houses, 64% moved from different county within same state. Out of people who lived in different houses, 7% moved from different state. Out of people who lived in different houses, 5% moved from abroad.
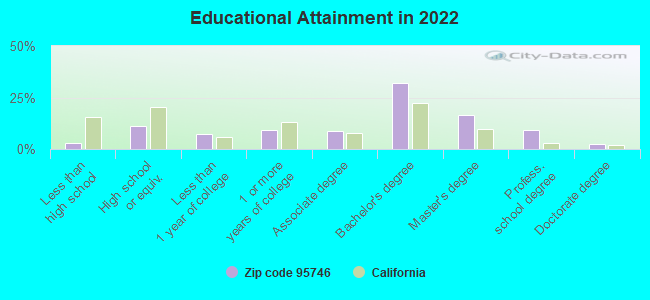
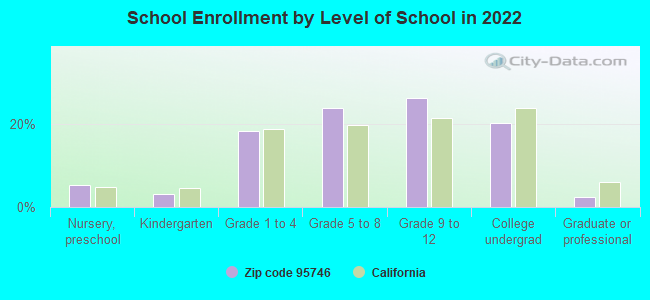
Private vs. public school enrollment:
Students in private schools in grades 1 to 8 (elementary and middle school): 210
Here:
8.3%
California:
10.5%
Students in private schools in grades 9 to 12 (high school): 241
Here:
15.2%
California:
8.5%
Students in private undergraduate colleges: 349
Here:
28.4%
California:
15.9%
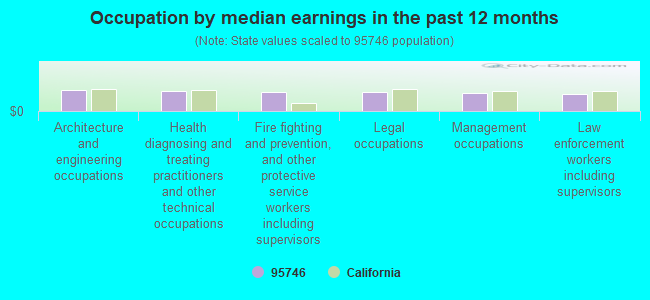
Occupation by median earnings in the past 12 months ($)
159,027Architecture and engineering occupations
153,760Health diagnosing and treating practitioners and other technical occupations
144,567Fire fighting and prevention, and other protective service workers including supervisors
143,682Legal occupations
139,306Management occupations
127,230Law enforcement workers including supervisors
Companies with federal contracts located in this zip code (GRANITE BAY, CA):
CODESOURCERY LLC (9978 GRANITE PT CT; small business) : $845,003 in 3 contractsfrom 2003 to 2006
$375,000 with Air Force for Other Defense -- Applied Research and Exploratory Development (R&D). Signed on 2004-12-22. Completion date: 2007-03-22.
$371,282, same as above.Signed on 2006-01-30. Completion date: 2006-12-22.
$98,721, same as above.Signed on 2003-12-04. Completion date: 2004-09-05.
ENVIROQUEST AND ASSOCIATES (4513 CAMDEN COURT; small business)
$71,887 with Army for Other Environmental Services, Studies, and Analytical Support. Signed on 2002-02-05. Completion date: 2002-12-30.
CANNON WATER TECHNOLOGY INC (8412 HILLGROVE ST; small business) : $38,285 in 5 contractsfrom 2004 to 2006
Contracts for Facilities Operations Support Services, Water Purification Equipment by Department of Defense, Defense Microelectronics Activity, Navy Signed by year:2000: $0; 2001: $0; 2002: $0; 2003: $0; 2004: $11,904; 2005: $15,701; 2006: $10,680.
Biggest contracts:
$12,504 with Department of Defense for Facilities Operations Support Services. Signed on 2005-03-15. Completion date: 2005-03-31.
$11,904 with Defense Microelectronics Activity for Facilities Operations Support Services. Signed on 2004-03-02. Completion date: 2005-03-31.
$10,680, same as above.Signed on 2006-04-05. Completion date: 2007-03-31.
$3,197 with Navy for Water Purification Equipment. Signed on 2005-08-08. Completion date: 2005-12-31.
AMERICAN DESIGN & ASSEMBLY COR (4120 DOUGLAS BLVD STE 306; small business)
$37,044 with Defense Logistics Agency for Capacitors. Signed on 2005-04-14. Completion date: 2005-05-24.
Top industries in this zip code by the number of employees in 2005:
2005 - 2018 National Fire Incident Reporting System (NFIRS) incidents
Based on the data from the years 2005 - 2018 the average number of fire incidents per year is 40. The highest number of reported fire incidents - 68 took place in 2007, and the least - 0 in 2008. The data has an increasing trend.
When looking into fire subcategories, the most reports belonged to: Outside Fires (50.6%), and Structure Fires (34.6%).
Fire incident types reported to NFIRS in Zip Code 95746


 Nearest zip codes: 95650, 95661, 95677, 95662, 95630, 95610.


 Based on the data from the years 2005 - 2018 the average number of fire incidents per year is 40. The highest number of reported fire incidents - 68 took place in 2007, and the least - 0 in 2008. The data has an increasing trend.
 When looking into fire subcategories, the most reports belonged to: Outside Fires (50.6%), and Structure Fires (34.6%).