Estimated zip code population in 2022: 35,819 Zip code population in 2010: 31,314 Zip code population in 2000: 38,072
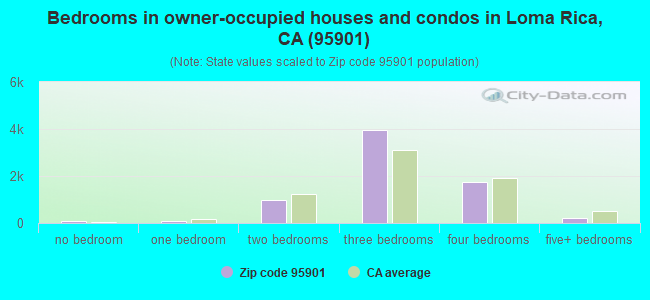
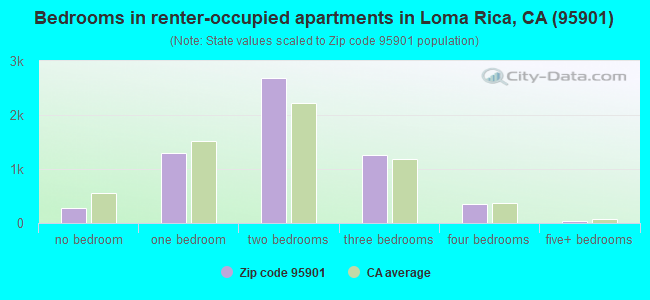
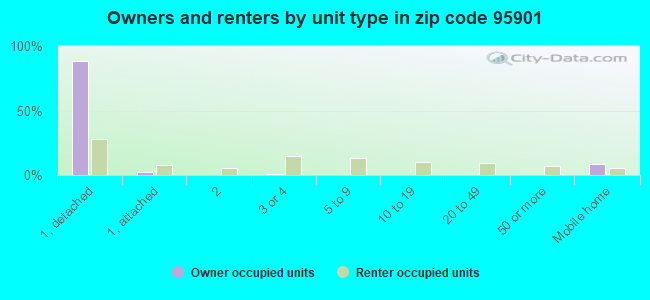
Houses and condos: 13,846 Renter-occupied apartments: 5,960
% of renters here:
46%
State:
44%
March 2022 cost of living index in zip code 95901: 93.5 (less than average, U.S. average is 100)
Land area: 196.6 sq. mi. Water area: 1.6 sq. mi.
Population density: 182 people per square mile
(very low).
OSM Map
General Map
Google Map
MSN Map
OSM Map
General Map
Google Map
MSN Map
OSM Map
General Map
Google Map
MSN Map
OSM Map
General Map
Google Map
MSN Map
Please wait while loading the map...
Real estate property taxes paid for housing units in 2022:
This zip code:
0.7% ($2,396)
California:
0.7% ($4,831)
Median real estate property taxes paid for housing units with mortgages in 2022: $2,724 (0.7%) Median real estate property taxes paid for housing units with no mortgage in 2022: $1,918 (0.6%)
Averages for the 2020 tax year for zip code 95901, filed in 2021:
Average Adjusted Gross Income (AGI) in 2020: $50,338 (Individual Income Tax Returns)
Here:
$50,338
State:
$95,910
Salary/wage: $45,714 (reported on 83.5% of returns)
Here:
$45,714
State:
$77,331
(% of AGI for various income ranges: 1243.0% for AGIs below $25k, 3786.3% for AGIs $25k-50k, 6998.8% for AGIs $50k-75k, 10335.5% for AGIs $75k-100k, 18363.2% for AGIs $100k-200k, 54174.3% for AGIs over 200k)
Taxable interest for individuals: $594 (reported on 27.8% of returns)
This zip code:
$594
California:
$2,294
(% of AGI for various income ranges: 5.2% for AGIs below $25k, 9.2% for AGIs $25k-50k, 22.9% for AGIs $50k-75k, 44.8% for AGIs $75k-100k, 84.0% for AGIs $100k-200k, 718.6% for AGIs over 200k)
Ordinary dividends: $4,106 (reported on 8.3% of returns)
Here:
$4,106
State:
$10,949
(% of AGI for various income ranges: 8.1% for AGIs below $25k, 12.2% for AGIs $25k-50k, 37.6% for AGIs $50k-75k, 58.3% for AGIs $75k-100k, 175.2% for AGIs $100k-200k, 2598.6% for AGIs over 200k)
Net capital gain/loss in AGI: +$9,282 (reported on 8.7% of returns)
Here:
+$9,282
State:
+$49,306
(% of AGI for various income ranges: 9.0% for AGIs below $25k, 11.0% for AGIs $25k-50k, 55.8% for AGIs $50k-75k, 97.6% for AGIs $75k-100k, 439.4% for AGIs $100k-200k, 8408.6% for AGIs over 200k)
Profit/loss from business: +$9,523 (reported on 11.9% of returns)
Here:
+$9,523
State:
+$15,671
(% of AGI for various income ranges: 101.7% for AGIs below $25k, 100.5% for AGIs $25k-50k, 166.1% for AGIs $50k-75k, 196.2% for AGIs $75k-100k, 330.4% for AGIs $100k-200k, 3800.0% for AGIs over 200k)
Taxable individual retirement arrangement distribution: $13,938 (reported on 4.0% of returns)
95901:
$13,938
California:
$23,505
(% of AGI for various income ranges: 23.8% for AGIs below $25k, 28.0% for AGIs $25k-50k, 70.6% for AGIs $50k-75k, 173.8% for AGIs $75k-100k, 363.5% for AGIs $100k-200k, 1182.9% for AGIs over 200k)
Total itemized deductions: $27,136 (reported on 7.1% of returns)
Here:
$27,136
State:
$39,517
(% of AGI for various income ranges: 33.8% for AGIs below $25k, 92.9% for AGIs $25k-50k, 319.4% for AGIs $50k-75k, 571.7% for AGIs $75k-100k, 1223.4% for AGIs $100k-200k, 5920.0% for AGIs over 200k)
Charity contributions: $6,386 (reported on 5.3% of returns)
Here:
$6,386
State:
$12,598
(% of AGI for various income ranges: 1.8% for AGIs below $25k, 8.1% for AGIs $25k-50k, 39.0% for AGIs $50k-75k, 87.4% for AGIs $75k-100k, 246.7% for AGIs $100k-200k, 1761.4% for AGIs over 200k)
Taxes paid: $7,581 (reported on 7.1% of returns)
95901:
$7,581
State:
$8,807
(% of AGI for various income ranges: 6.3% for AGIs below $25k, 20.9% for AGIs $25k-50k, 86.1% for AGIs $50k-75k, 184.5% for AGIs $75k-100k, 383.8% for AGIs $100k-200k, 1341.4% for AGIs over 200k)
Earned income credit: $2,371 (reported on 21.9% of returns)
Here:
$2,371
State:
$2,074
(% of AGI for various income ranges: 126.3% for AGIs below $25k, 90.6% for AGIs $25k-50k, 2.5% for AGIs $50k-75k)
Percentage of individuals using paid preparers for their 2020 taxes: 94.7%
Here:
95%
State:
92%
(% for various income ranges: 93.5% for AGIs below $25k, 95.5% for AGIs $25k-50k, 94.5% for AGIs $50k-75k, 96.1% for AGIs $75k-100k, 94.8% for AGIs $100k-200k, 95.8% for AGIs over 200k)
Averages for the 2012 tax year for zip code 95901, filed in 2013:
Average Adjusted Gross Income (AGI) in 2012: $40,732 (Individual Income Tax Returns)
Here:
$40,732
State:
$72,726
Salary/wage: $35,665 (reported on 84.9% of returns)
Here:
$35,665
State:
$59,079
(% of AGI for various income ranges: 75.9% for AGIs below $25k, 80.8% for AGIs $25k-50k, 76.8% for AGIs $50k-75k, 77.0% for AGIs $75k-100k, 76.5% for AGIs $100k-200k, 31.6% for AGIs over 200k)
Taxable interest for individuals: $984 (reported on 29.6% of returns)
This zip code:
$984
California:
$2,146
(% of AGI for various income ranges: 0.5% for AGIs below $25k, 0.4% for AGIs $25k-50k, 0.7% for AGIs $50k-75k, 0.7% for AGIs $75k-100k, 0.3% for AGIs $100k-200k, 3.3% for AGIs over 200k)
Ordinary dividends: $3,245 (reported on 10.7% of returns)
Here:
$3,245
State:
$9,308
(% of AGI for various income ranges: 0.7% for AGIs below $25k, 0.5% for AGIs $25k-50k, 0.6% for AGIs $50k-75k, 1.1% for AGIs $75k-100k, 1.0% for AGIs $100k-200k, 2.0% for AGIs over 200k)
Net capital gain/loss in AGI: +$10,676 (reported on 8.3% of returns)
Here:
+$10,676
State:
+$30,460
(% of AGI for various income ranges: 0.5% for AGIs $50k-75k, 0.3% for AGIs $75k-100k, 1.1% for AGIs $100k-200k, 25.1% for AGIs over 200k)
Profit/loss from business: +$8,528 (reported on 11.9% of returns)
Here:
+$8,528
State:
+$17,064
(% of AGI for various income ranges: 6.3% for AGIs below $25k, 2.0% for AGIs $25k-50k, 1.4% for AGIs $50k-75k, 2.3% for AGIs $75k-100k, 2.5% for AGIs $100k-200k)
Taxable individual retirement arrangement distribution: $11,148 (reported on 5.8% of returns)
95901:
$11,148
California:
$19,557
(% of AGI for various income ranges: 1.4% for AGIs below $25k, 1.3% for AGIs $25k-50k, 1.5% for AGIs $50k-75k, 1.2% for AGIs $75k-100k, 1.6% for AGIs $100k-200k, 3.8% for AGIs over 200k)
Total itemized deductions: $20,950 (26% of AGI, reported on 24.7% of returns)
Here:
$20,950
State:
$34,004
Here:
26.1% of AGI
State:
22.7% of AGI
(% of AGI for various income ranges: 6.4% for AGIs below $25k, 8.9% for AGIs $25k-50k, 13.5% for AGIs $50k-75k, 16.1% for AGIs $75k-100k, 17.0% for AGIs $100k-200k, 16.8% for AGIs over 200k)
Charity contributions: $2,704 (reported on 18.7% of returns)
Here:
$2,704
State:
$4,659
(% of AGI for various income ranges: 0.5% for AGIs below $25k, 0.8% for AGIs $25k-50k, 1.3% for AGIs $50k-75k, 1.6% for AGIs $75k-100k, 1.8% for AGIs $100k-200k, 1.8% for AGIs over 200k)
Taxes paid: $6,289 (reported on 24.7% of returns)
95901:
$6,289
State:
$14,448
(% of AGI for various income ranges: 1.2% for AGIs below $25k, 1.9% for AGIs $25k-50k, 3.4% for AGIs $50k-75k, 4.9% for AGIs $75k-100k, 6.5% for AGIs $100k-200k, 6.9% for AGIs over 200k)
Earned income credit: $2,327 (reported on 28.5% of returns)
Here:
$2,327
State:
$2,286
(% of AGI for various income ranges: 8.1% for AGIs below $25k, 1.8% for AGIs $25k-50k)
Percentage of individuals using paid preparers for their 2012 taxes: 58.0%
Here:
58%
State:
64%
(% for various income ranges: 53.4% for AGIs below $25k, 59.8% for AGIs $25k-50k, 61.4% for AGIs $50k-75k, 63.4% for AGIs $75k-100k, 68.4% for AGIs $100k-200k, 88.9% for AGIs over 200k)
Averages for the 2004 tax year for zip code 95901, filed in 2005:
Average Adjusted Gross Income (AGI) in 2004: $33,960 (Individual Income Tax Returns)
Here:
$33,960
State:
$58,600
Salary/wage: $30,445 (reported on 87.1% of returns)
Here:
$30,445
State:
$49,455
(% of AGI for various income ranges: 204.0% for AGIs below $10k, 82.0% for AGIs $10k-25k, 84.5% for AGIs $25k-50k, 82.9% for AGIs $50k-75k, 82.3% for AGIs $75k-100k, 46.7% for AGIs over 100k)
Taxable interest for individuals: $1,590 (reported on 32.3% of returns)
This zip code:
$1,590
California:
$2,365
(% of AGI for various income ranges: 8.3% for AGIs below $10k, 1.1% for AGIs $10k-25k, 0.9% for AGIs $25k-50k, 0.7% for AGIs $50k-75k, 1.0% for AGIs $75k-100k, 3.7% for AGIs over 100k)
Taxable dividends: $2,474 (reported on 11.4% of returns)
Here:
$2,474
State:
$4,746
(% of AGI for various income ranges: 3.0% for AGIs below $10k, 0.5% for AGIs $10k-25k, 0.5% for AGIs $25k-50k, 0.5% for AGIs $50k-75k, 0.8% for AGIs $75k-100k, 2.0% for AGIs over 100k)
Net capital gain/loss: +$14,278 (reported on 9.7% of returns)
Here:
+$14,278
State:
+$23,418
(% of AGI for various income ranges: 7.7% for AGIs below $10k, 0.2% for AGIs $10k-25k, 0.4% for AGIs $25k-50k, 0.8% for AGIs $50k-75k, 1.9% for AGIs $75k-100k, 18.5% for AGIs over 100k)
Profit/loss from business: +$10,388 (reported on 11.8% of returns)
Here:
+$10,388
State:
+$16,826
(% of AGI for various income ranges: 9.1% for AGIs below $10k, 3.5% for AGIs $10k-25k, 2.2% for AGIs $25k-50k, 2.3% for AGIs $50k-75k, 2.7% for AGIs $75k-100k, 7.8% for AGIs over 100k)
IRA payment deduction: $2,905 (reported on 1.6% of returns)
95901:
$2,905
California:
$3,192
(% of AGI for various income ranges: 0.3% for AGIs below $10k, 0.1% for AGIs $10k-25k, 0.2% for AGIs $25k-50k, 0.1% for AGIs $50k-75k, 0.1% for AGIs $75k-100k, 0.1% for AGIs over 100k)
Self-employed pension: $12,394 (reported on 0.5% of returns)
Here:
$12,394
California:
$17,688
(% of AGI for various income ranges: 0.1% for AGIs $25k-50k, 0.1% for AGIs $50k-75k, 0.2% for AGIs $75k-100k, 0.6% for AGIs over 100k)
Total itemized deductions: $17,497 (26% of AGI, reported on 26.2% of returns)
Here:
$17,497
State:
$28,113
Here:
26.2% of AGI
State:
25.3% of AGI
(% of AGI for various income ranges: 24.5% for AGIs below $10k, 7.1% for AGIs $10k-25k, 11.4% for AGIs $25k-50k, 16.5% for AGIs $50k-75k, 17.6% for AGIs $75k-100k, 14.6% for AGIs over 100k)
Charity contributions deductions: $2,338 (3% of AGI, reported on 22.0% of returns)
Here:
$2,338
State:
$3,923
Here:
3.3% of AGI
State:
3.3% of AGI
(% of AGI for various income ranges: 0.9% for AGIs below $10k, 0.6% for AGIs $10k-25k, 1.1% for AGIs $25k-50k, 1.7% for AGIs $50k-75k, 2.2% for AGIs $75k-100k, 2.2% for AGIs over 100k)
Total tax: $4,380 (reported on 65.6% of returns)
95901:
$4,380
State:
$10,761
(% of AGI for various income ranges: 4.6% for AGIs below $10k, 3.4% for AGIs $10k-25k, 5.7% for AGIs $25k-50k, 7.9% for AGIs $50k-75k, 9.9% for AGIs $75k-100k, 17.2% for AGIs over 100k)
Earned income credit: $1,825 (reported on 23.9% of returns)
Here:
$1,825
State:
$1,763
Percentage of individuals using paid preparers for their 2004 taxes: 63.0%
Here:
63%
State:
66%
(% for various income ranges: 53.9% for AGIs below $10k, 63.5% for AGIs $10k-25k, 64.4% for AGIs $25k-50k, 68.1% for AGIs $50k-75k, 67.0% for AGIs $75k-100k, 75.6% for AGIs over 100k)
Likely homosexual households (counted as self-reported same-sex unmarried-partner households)
Lesbian couples: 0.2% of all households
Gay men: 0.3% of all households
Household received Food Stamps/SNAP in the past 12 months: 3,332 Household did not receive Food Stamps/SNAP in the past 12 months: 10,026
Women who had a birth in the past 12 months: 493 (194 now married, 302 unmarried) Women who did not have a birth in the past 12 months: 7,631 (3,366 now married, 4,250 unmarried)
Housing units in zip code 95901 with a mortgage: 4,508 (414 second mortgage, 357 both second mortgage and home equity loan) Houses without a mortgage: 107
Median monthly owner costs for units with a mortgage: $1,908 Median monthly owner costs for units without a mortgage: $630
Residents with income below the poverty level in 2022:
This zip code:
20.5%
Whole state:
12.2%
Residents with income below 50% of the poverty level in 2022:
This zip code:
12.2%
Whole state:
6.2%
Median number of rooms in houses and condos:
Here:
6.3
State:
6.0
Median number of rooms in apartments:
Here:
4.1
State:
3.9
Notable locations in this zip code not listed on our city pages
Notable locations in zip code 95901: Stone House (A), Sixmile Station (B), Sevenmile House (C), Rupert Siding (D), Pacific Ranch (E), District Ten Store (F), La Finca Orchards (G), Fruitland Union School (H), Peach Tree Golf and Country Club (I), Dantoni Junction (J), Yuba Gold Field (K), Section Seven Gun Club (L), Boardman Ranch (M), Bonanza Ranch (N), Yuba County Library (O), Yuba County Jail (P), Yuba County Courthouse (Q), Veterans Memorial Auditorium (R), The Castle (S), Packard Library (T). Display/hide their locations on the map
Churches in zip code 95901 include: Zion Church in Jesus Christ Number 2 (A), Word of Life Church (B), Saint Joseph Catholic Church (C), Saint Johns Episcopal Church (D), Mount Olivet Baptist Church (E), Hall Street Baptist Church (F), First Presbyterian Church (G), First Methodist Church (H), First Church of Christ Scientist (I). Display/hide their locations on the map
Streams, rivers, and creeks: Early Creek (A), McGinn Creek (B), Wellman Creek (C), Tennessee Creek (D), Jack Slough (E), Simmerly Slough (F), Prairie Creek (G). Display/hide their locations on the map
Parks in zip code 95901 include: Miners Square (1), Yuba Square (2), Basin Park (3), Bryant Field (4), Ellis Lake Park (5), Market Square (6), Memorial Stadium (7), Napoleon Square (8), Plaza Park (9). Display/hide their locations on the map
5,011 married couples with children.
3,399 single-parent households (630 men, 2,769 women).
74.0% of residents of 95901 zip code speak English at home.
16.9% of residents speak Spanish at home (62% very well, 15% well, 13% not well, 10% not at all).
1.8% of residents speak other Indo-European language at home (52% very well, 22% well, 17% not well, 9% not at all).
6.5% of residents speak Asian or Pacific Island language at home (59% very well, 30% well, 6% not well, 6% not at all).
0.3% of residents speak other language at home (92% well, 8% not at all).
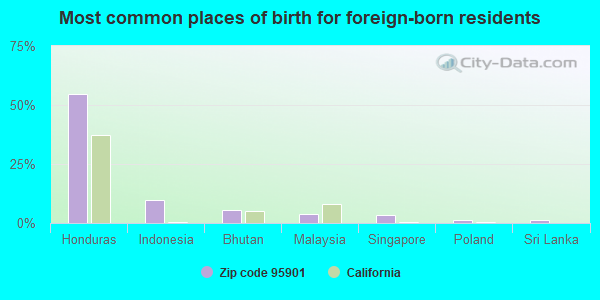
Foreign born population: 4,972 (13.9%) (55.9% of them are naturalized citizens)
This zip code:
13.9%
Whole state:
26.7%
55%Honduras
10%Indonesia
5%Bhutan
4%Malaysia
3%Singapore
1%Poland
1%Sri Lanka
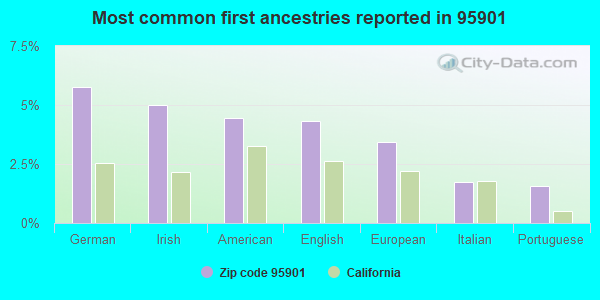
6%German
5%Irish
4%American
4%English
3%European
2%Italian
2%Portuguese
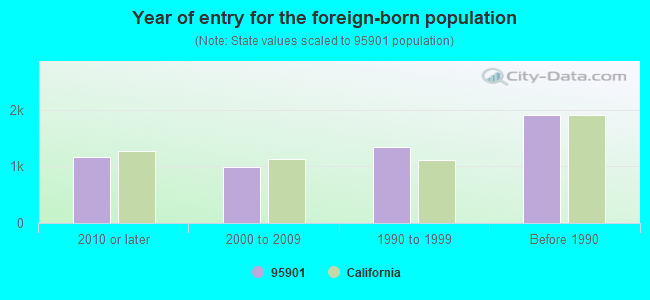
Year of entry for the foreign-born population
1,1632010 or later
9932000 to 2009
1,3401990 to 1999
1,910Before 1990
Major facilities with environmental interests located in this zip code:
AMERICAN COMPOSITE INCORPORATED (1394 SKY HARBOR DR. in MARYSVILLE, CA)
STATE MASTER (California - Hazardous Waste Tracking) - HAZARDOU WASTE PROGRAM CRITERIA AND HAZARDOUS AIR POLLUTANT INVENTORY (Inventory of air pollution sources) Small Quantity Generators, between 100 kg and 1000 kg of hazardous waste/month (Resource Conservation and Recovery Act (tracking hazardous waste)) - notification TRI REPORTER (Tracking of toxic chemicals releasing facilities) Business SIC classification: PLASTICS PRODUCTS Organizations: MELVIN MCCRACKEN (CONTACT/OWNER)
Alternative names: ACME REINFORCED PLASTICS, INC
FAST FABRICATOR INCORPORATED DBA WATER WORKS MANUFACTURING (3387 PLUMAS ARBOGA ROAD in MARYSVILLE, CA)
STATE MASTER (California - Hazardous Waste Tracking) - HAZARDOU WASTE PROGRAM CRITERIA AND HAZARDOUS AIR POLLUTANT INVENTORY (Inventory of air pollution sources) Small Quantity Generators, between 100 kg and 1000 kg of hazardous waste/month (Resource Conservation and Recovery Act (tracking hazardous waste)) - notification Business SIC classification: FABRICATED PIPE AND PIPE FITTINGS Organizations: FAST FABRICATORS INC (CONTACT/OWNER)
Alternative names: FAST FABRICATORS INC
CAL SIERRA DEVELOPMENT INC (4738 HAMMONTON RD in MARYSVILLE, CA)
STATE MASTER (California - Hazardous Waste Tracking) - HAZARDOU WASTE PROGRAM Small Quantity Generators, between 100 kg and 1000 kg of hazardous waste/month (Resource Conservation and Recovery Act (tracking hazardous waste)) Business NAICS classification: GOLD ORE MINING.
CALTRANS DISTRICT 3 (1001 N BEALE RD in MARYSVILLE, CA)
STATE MASTER (California - Hazardous Waste Tracking) - HAZARDOU WASTE PROGRAM Large Quantity Generators, more that 1000 kg of hazardous waste/month (Resource Conservation and Recovery Act (tracking hazardous waste))
EMMPAK DIV EXCELFOODS SOLUTION COMPANY (1109 CHESTNUT ST in MARYSVILLE, CA) . Federal Facility
STATE MASTER (California - Hazardous Waste Tracking) - HAZARDOU WASTE PROGRAM Small Quantity Generators, between 100 kg and 1000 kg of hazardous waste/month (Resource Conservation and Recovery Act (tracking hazardous waste)) - notification TRI REPORTER (Tracking of toxic chemicals releasing facilities) Business SIC classification: SAUSAGES AND OTHER PREPARED MEAT PRODUCTS Business NAICS classification: RENDERING AND MEAT BYPRODUCT PROCESSING. Organizations: CARGILL INC (CONTACT/OWNER)
Alternative names: CARGILL PROCESSED MEAT PRODUCTS, EXCEL SPECIALTY PRODS.
JIFFY LUBE #2610 (229 E ST in MARYSVILLE, CA)
Small Quantity Generators, between 100 kg and 1000 kg of hazardous waste/month (Resource Conservation and Recovery Act (tracking hazardous waste)) - notification STATE MASTER (California - Used Oil Recycling System ) - USED OIL RECYCLING Organizations: JAMES R ETHINGTON (CONTACT/OWNER)
Alternative names: MINIT LUBE 1289
GEWEKE COLLISION CENTER (1404 F ST in MARYSVILLE, CA)
STATE MASTER (California - Hazardous Waste Tracking) - HAZARDOU WASTE PROGRAM Small Quantity Generators, between 100 kg and 1000 kg of hazardous waste/month (Resource Conservation and Recovery Act (tracking hazardous waste)) - notification
CALTRANS DISTRICT 3 (703 B ST in MARYSVILLE, CA)
STATE MASTER (California - Hazardous Waste Tracking) - HAZARDOU WASTE PROGRAM Small Quantity Generators, between 100 kg and 1000 kg of hazardous waste/month (Resource Conservation and Recovery Act (tracking hazardous waste))
EQUILON ENTERPRISES (501 5TH ST in MARYSVILLE, CA) . Federal Facility
STATE MASTER (California - Hazardous Waste Tracking) - HAZARDOU WASTE PROGRAM Small Quantity Generators, between 100 kg and 1000 kg of hazardous waste/month (Resource Conservation and Recovery Act (tracking hazardous waste)) - notification Organizations: EQUILON ENTERPRISES LLIC (CONTACT/OWNER)
Alternative names: SHELL OIL CO
ALICIA INTERMEDIATE (1208 PASADO AVE. in MARYSVILLE, CA)
(National Center for Education Statistics) - STATE ID-6056618 Organizations: MARYSVILLE JOINT UNIFIED (SCHOOL DISTRICT)
LINCOLN (ABRAHAM) (ALTER.) (1919 B ST. in MARYSVILLE, CA)
(National Center for Education Statistics) - STATE ID-5830054 Organizations: MARYSVILLE JOINT UNIFIED (SCHOOL DISTRICT)
ALTERNATIVE/OPPORTUNITY (131 F ST. in MARYSVILLE, CA)
(National Center for Education Statistics) - STATE ID-5830104 Organizations: YUBA CO. OFFICE OF EDUCATION (SCHOOL DISTRICT)
ARBOGA ELEMENTARY (1686 BROADWAY in MARYSVILLE, CA)
(National Center for Education Statistics) - STATE ID-6056634 Organizations: MARYSVILLE JOINT UNIFIED (SCHOOL DISTRICT)
Housing units lacking complete plumbing facilities: 2.0% Housing units lacking complete kitchen facilities: 2.5%
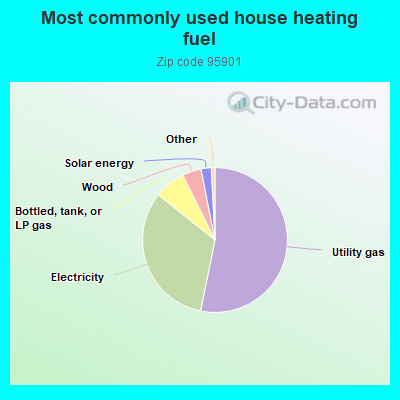
53.2%Utility gas
32.5%Electricity
7.0%Bottled, tank, or LP gas
4.2%Wood
2.3%Solar energy
Population in 1990: 43,785.
Place of birth for U.S.-born residents:
This state: 25,284
Northeast: 795
Midwest: 1,045
South: 1,464
West: 1,786
51% of the 95901 zip code residents lived in the same house 5 years ago. Out of people who lived in different houses, 54% lived in this county. Out of people who lived in different counties, 50% lived in California.
89% of the 95901 zip code residents lived in the same house 1 year ago. Out of people who lived in different houses, 30% moved from this county. Out of people who lived in different houses, 61% moved from different county within same state. Out of people who lived in different houses, 9% moved from different state. Out of people who lived in different houses, 3% moved from abroad.
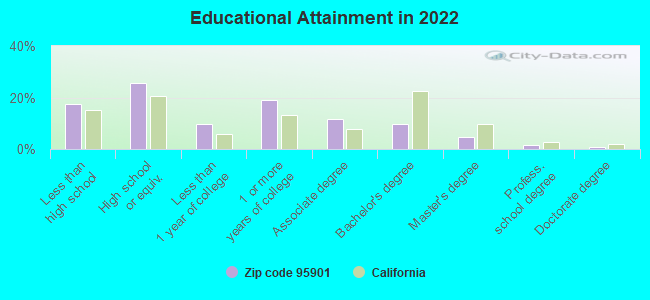
Private vs. public school enrollment:
Students in private schools in grades 1 to 8 (elementary and middle school): 268
Here:
6.5%
California:
10.5%
Students in private schools in grades 9 to 12 (high school): 308
Here:
15.1%
California:
8.5%
Students in private undergraduate colleges: 266
Here:
12.3%
California:
15.9%
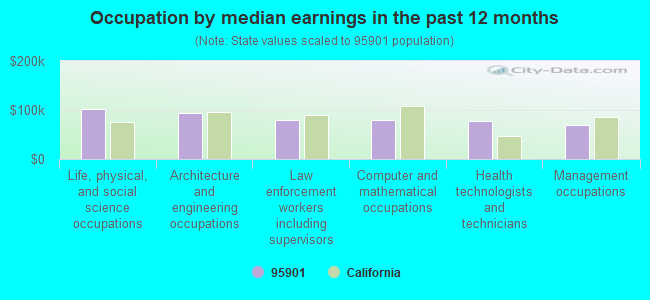
Occupation by median earnings in the past 12 months ($)
101,477Life, physical, and social science occupations
93,694Architecture and engineering occupations
79,513Law enforcement workers including supervisors
79,132Computer and mathematical occupations
77,724Health technologists and technicians
69,318Management occupations
Companies with biggest federal contracts located in this zip code (MARYSVILLE, CA):
KIN ENTERPRISES, INC (500 OLIVE STREET, SUITE 2; small business) : $27,317,169 in 133 contractsfrom 2000 to 2006
Contracts for Maintenance, Repair or Alteration of Real Property -- Other Non-Building Facilities, Landscaping/Groundskeeping Services, Mineral Construction Materials, Bulk, Construction of Structures and Facilities -- Water Supply Facilities, and moreby Army, U.S. Army Corps of Engineers - civil program financing only, Bureau of Reclamation, Forest Service (disused code: now 12C2), and others Signed by year:2000: $1,101,799; 2001: $24,902; 2002: $2,576,232; 2003: $5,607,659; 2004: $8,259,131; 2005: $8,718,650; 2006: $1,028,796.
Biggest contracts:
$2,700,000 with Army for Maintenance, Repair or Alteration of Real Property -- Other Non-Building Facilities. Signed on 2005-06-14. Completion date: 2006-01-30.
$2,700,000 with U.S. Army Corps of Engineers - civil program financing only for Maintenance, Repair or Alteration of Real Property -- Other Non-Building Facilities. Signed on 2005-06-14. Completion date: 2006-01-30.
$2,408,000 with Army for Maintenance, Repair or Alteration of Real Property -- Other Non-Building Facilities. Signed on 2003-10-27. Completion date: 2004-09-06.
$2,408,000 with U.S. Army Corps of Engineers - civil program financing only for Maintenance, Repair or Alteration of Real Property -- Other Non-Building Facilities. Signed on 2003-10-27. Completion date: 2004-09-06.
NORDIC INDUSTRIES INC (1437 FURNEAUX RD; small business) : $13,818,786 in 34 contractsfrom 1999 to 2006
Contracts for Construction of Structures and Facilities -- Highways, Roads, Streets, Bridges, and Railways (includes resurfacing), Construction of Structures and Facilities -- Other Non-Building Facilities, Miscellaneous Construction Materials, Maintenance, Repair or Alteration of Real Property -- Other Non-Building Facilities by Federal Highway Administration, U.S. Army Corps of Engineers - civil program financing only, Army, Air Force, and others Signed by year:2000: $4,510,000; 2001: $3,165,000; 2002: $431,028; 2003: $948,503; 2004: $0; 2005: $0; 2006: $2,255.
Biggest contracts:
$4,762,000 with Federal Highway Administration for Construction of Structures and Facilities -- Highways, Roads, Streets, Bridges, and Railways (includes resurfacing). Signed on 1999-12-15. Completion date: 2000-07-15.
$4,500,000 with U.S. Army Corps of Engineers - civil program financing only for Construction of Structures and Facilities -- Other Non-Building Facilities. Signed on 2000-04-18. Completion date: 2001-03-31.
$3,486,000 with Federal Highway Administration for Construction of Structures and Facilities -- Highways, Roads, Streets, Bridges, and Railways (includes resurfacing). Taking place in ID. Signed on 2001-05-15. Completion date: 2003-12-15.
$703,055, same as above.Signed on 2003-03-15. Completion date: 2003-07-15.
YUBA SUTTER DISPOSAL INC (3001 N LEVEE RD) : $6,567,319 in 26 contractsfrom 1999 to 2006
Contracts for Trash/Garbage Collection Services - Including Portable Sanitation Services by Air Force Signed by year:2000: $0; 2001: $906,967; 2002: $1,847,942; 2003: $944,507; 2004: $680,627; 2005: $1,026,112; 2006: $212,968.
Biggest contracts:
$948,196 with Air Force for Trash/Garbage Collection Services - Including Portable Sanitation Services. Signed on 1999-10-26. Completion date: 2000-09-30.
$944,507, same as above.Signed on 2003-10-01. Completion date: 2004-09-30.
$923,971, same as above.Signed on 2002-10-01. Completion date: 2003-09-30.
$923,971, same as above.Signed on 2002-09-30. Completion date: 2003-09-30.
BIRDWELL BROS PAINTING (444 LAURELLEN; small business) : $1,816,456 in 8 contractsfrom 2000 to 2003
Contracts for Maintenance, Repair or Alteration of Real Property -- Troop Housing Facilities, Installation of Equipment -- Service and Trade Equipment, Installation of Equipment -- Furniture, Maintenance, Repair or Alteration of Real Property -- Office Buildings by Air Force Signed by year:2000: $1,710,912; 2001: $6,000; 2002: $94,977; 2003: $4,567; 2004: $0; 2005: $0; 2006: $0.
Biggest contracts:
$1,657,517 with Air Force for Maintenance, Repair or Alteration of Real Property -- Troop Housing Facilities. Signed on 2000-11-16. Completion date: 2001-10-19.
$1,657,517, same as above.Signed on 2000-12-06. Completion date: 2001-10-19.
$53,395 with Air Force for Installation of Equipment -- Service and Trade Equipment. Signed on 2000-09-27. Completion date: 2000-12-22.
$50,480 with Air Force for Installation of Equipment -- Furniture. Signed on 2002-02-14. Completion date: 2002-05-01.
BOSSEN LAUNDRY & LINEN SUPPLY, (221 B ST; small business) : $744,303 in 12 contractsfrom 2001 to 2005
Contracts for Laundry and DryCleaning Services by Air Force Signed by year:2000: $0; 2001: $244,396; 2002: $207,476; 2003: $246,450; 2004: -$7,419; 2005: $53,400; 2006: $0.
Biggest contracts:
$285,450 with Air Force for Laundry and DryCleaning Services. Signed on 2003-10-01. Completion date: 2004-09-30.
$244,396, same as above.Signed on 2001-10-01. Completion date: 2002-09-30.
$244,356, same as above.Signed on 2002-10-01. Completion date: 2003-09-30.
$50,700, same as above.Signed on 2005-03-10. Completion date: 2005-02-28.
NORTH TREE FIRE INC (STATION 20; small business) 12 employees, $0 revenue. : $632,950 in 6 contractsfrom 2002 to 2003
Contracts for Lease or Rental of Equipment -- Miscellaneous, Forest/Range Fire Suppression/Presuppression Services, Other Natural Resources and Conservation Services by Forest Service (disused code: now 12C2), Forest Service Signed by year:2000: $0; 2001: $0; 2002: $558,520; 2003: $74,430; 2004: $0; 2005: $0; 2006: $0.
Biggest contracts:
$237,000 with Forest Service (disused code: now 12C2) for Lease or Rental of Equipment -- Miscellaneous. Taking place in OR. Signed on 2002-09-15. Completion date: 2002-09-15.
$186,000 with Forest Service (disused code: now 12C2) for Forest/Range Fire Suppression/Presuppression Services. Taking place in OR. Signed on 2002-08-15. Completion date: 2005-04-15.
$135,520 with Forest Service for Other Natural Resources and Conservation Services. Signed on 2002-10-15. Completion date: 2004-05-15.
$43,203 with Forest Service for Forest/Range Fire Suppression/Presuppression Services. Taking place in OR. Signed on 2003-07-15. Completion date: 2003-07-15.
TRU-BRITE ENERGY MANAGEMENT IN (321 D ST) : $155,593 in 3 contractsfrom 2003 to 2004
$72,757 with Army for Indoor and Outdoor Electric Lighting Fixtures. Signed on 2003-09-25. Completion date: 2003-10-31.
$62,590 with Army for Nonelectrical Lighting Fixtures. Signed on 2003-08-15. Completion date: 2003-07-28.
$20,246 with Army for Electric Vehicular Lights and Fixtures. Signed on 2004-03-23. Completion date: 2004-04-09.
RED CARPET AVIATION SERVICES I (1489 SKY HARBOR DR STE A; small business)
$19,043 with Air Force for Liquid Propellants and Fuels, Petroleum Base. Signed on 2006-05-22. Completion date: 2006-06-04.
ANDERSON, JORETTA (1547 CLEARWATER COURT; small business) : $12,720 in 3 contractsfrom 2004 to 2005
$6,840 with Air Force for Chaplain Services. Signed on 2005-10-01. Completion date: 2006-09-30.
$6,840, same as above.Signed on 2004-10-01. Completion date: 2005-09-30.
-$960, same as above.Signed on 2005-07-20. Completion date: 2005-09-30.
P D Q VAN & STORAGE INC (930 YUBA ST; small business)
$11,200 with Air Force for Other Transportation Travel and Relocation Services. Signed on 2005-01-19. Completion date: 2005-01-28.
Top industries in this zip code by the number of employees in 2005:
Health Care and Social Assistance: General Medical and Surgical Hospitals (500-999 employees: 1 establishment, 1-4 employees: 1 establishment)
2005 - 2018 National Fire Incident Reporting System (NFIRS) incidents
Based on the data from the years 2005 - 2018 the average number of fires per year is 268. The highest number of fire incidents - 536 took place in 2007, and the least - 37 in 2016. The data has a dropping trend.
When looking into fire subcategories, the most incidents belonged to: Outside Fires (66.5%), and Structure Fires (16.4%).
Fire incident types reported to NFIRS in Zip Code 95901

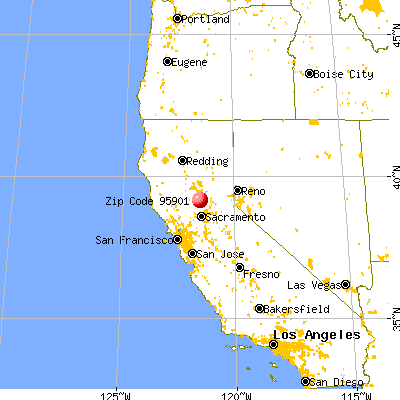


 Nearest zip codes: 95903, 95918, 95961, 95692, 95977, 95968.


 Based on the data from the years 2005 - 2018 the average number of fires per year is 268. The highest number of fire incidents - 536 took place in 2007, and the least - 37 in 2016. The data has a dropping trend.
 When looking into fire subcategories, the most incidents belonged to: Outside Fires (66.5%), and Structure Fires (16.4%).