Estimated zip code population in 2022: 18,092 Zip code population in 2010: 17,838 Zip code population in 2000: 17,267
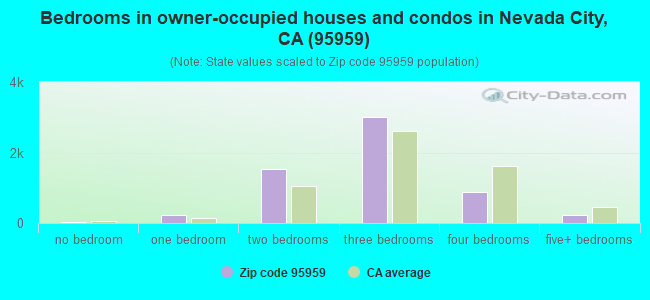
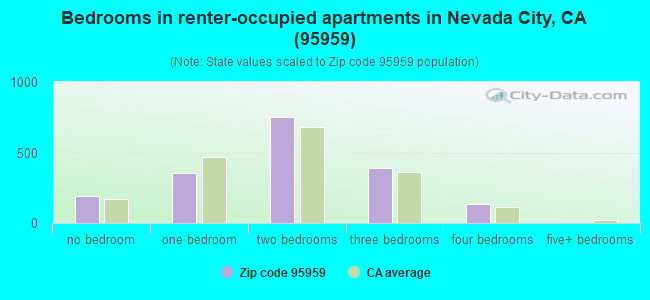
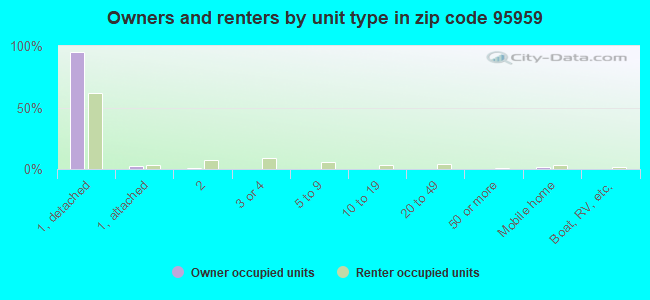
Houses and condos: 9,019 Renter-occupied apartments: 1,825
% of renters here:
24%
State:
44%
March 2022 cost of living index in zip code 95959: 100.1 (near average, U.S. average is 100)
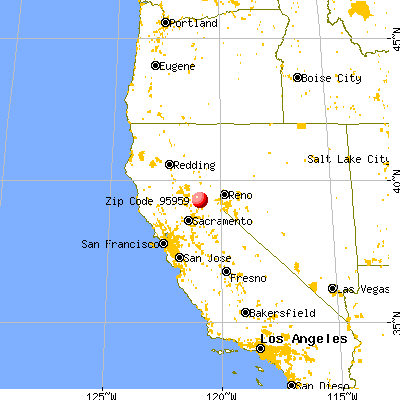
Land area: 247.9 sq. mi. Water area: 1.4 sq. mi.
Population density: 73 people per square mile
(very low).
OSM Map
General Map
Google Map
MSN Map
OSM Map
General Map
Google Map
MSN Map
OSM Map
General Map
Google Map
MSN Map
OSM Map
General Map
Google Map
MSN Map
Please wait while loading the map...
Real estate property taxes paid for housing units in 2022:
This zip code:
0.7% ($4,071)
California:
0.7% ($4,831)
Median real estate property taxes paid for housing units with mortgages in 2022: $4,263 (0.7%) Median real estate property taxes paid for housing units with no mortgage in 2022: $3,690 (0.6%)
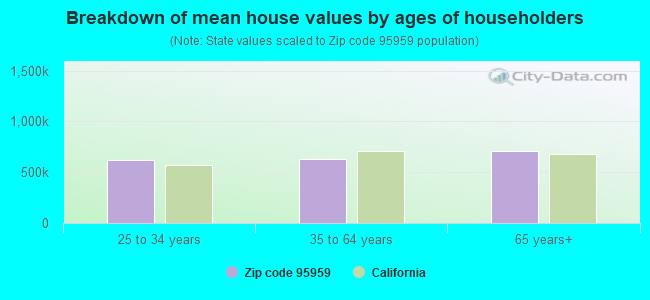
Estimated median house/condo value in 2022: $611,224
95959:
$611,224
California:
$715,900
According to our research of California and other state lists, there were 18 registered sex offenders living in 95959 zip code as of April 27, 2024. The ratio of all residents to sex offenders in zip code 95959 is 988 to 1. The ratio of registered sex offenders to all residents in this zip code is lower than the state average.
Median resident age:
This zip code:
55.8 years
California median age:
37.9 years
Average household size:
This zip code:
2.3 people
California:
2.8 people
Averages for the 2020 tax year for zip code 95959, filed in 2021:
Average Adjusted Gross Income (AGI) in 2020: $85,213 (Individual Income Tax Returns)
Here:
$85,213
State:
$95,910
Salary/wage: $66,509 (reported on 59.5% of returns)
Here:
$66,509
State:
$77,331
(% of AGI for various income ranges: 961.0% for AGIs below $25k, 3346.0% for AGIs $25k-50k, 5844.6% for AGIs $50k-75k, 7802.6% for AGIs $75k-100k, 16540.7% for AGIs $100k-200k, 75113.1% for AGIs over 200k)
Taxable interest for individuals: $2,208 (reported on 49.3% of returns)
This zip code:
$2,208
California:
$2,294
(% of AGI for various income ranges: 53.0% for AGIs below $25k, 89.7% for AGIs $25k-50k, 131.0% for AGIs $50k-75k, 203.0% for AGIs $75k-100k, 291.0% for AGIs $100k-200k, 2710.0% for AGIs over 200k)
Ordinary dividends: $9,945 (reported on 32.0% of returns)
Here:
$9,945
State:
$10,949
(% of AGI for various income ranges: 83.5% for AGIs below $25k, 180.0% for AGIs $25k-50k, 319.6% for AGIs $50k-75k, 589.1% for AGIs $75k-100k, 943.9% for AGIs $100k-200k, 8975.0% for AGIs over 200k)
Net capital gain/loss in AGI: +$28,539 (reported on 31.7% of returns)
Here:
+$28,539
State:
+$49,306
(% of AGI for various income ranges: 51.7% for AGIs below $25k, 101.8% for AGIs $25k-50k, 372.5% for AGIs $50k-75k, 731.6% for AGIs $75k-100k, 2013.4% for AGIs $100k-200k, 37448.1% for AGIs over 200k)
Profit/loss from business: +$23,977 (reported on 27.1% of returns)
Here:
+$23,977
State:
+$15,671
(% of AGI for various income ranges: 335.4% for AGIs below $25k, 732.5% for AGIs $25k-50k, 970.1% for AGIs $50k-75k, 1412.6% for AGIs $75k-100k, 1655.9% for AGIs $100k-200k, 13756.2% for AGIs over 200k)
Taxable individual retirement arrangement distribution: $24,420 (reported on 15.0% of returns)
95959:
$24,420
California:
$23,505
(% of AGI for various income ranges: 105.8% for AGIs below $25k, 292.9% for AGIs $25k-50k, 551.3% for AGIs $50k-75k, 1128.4% for AGIs $75k-100k, 1864.4% for AGIs $100k-200k, 4221.2% for AGIs over 200k)
Self-employed (Keogh) retirement plans: $19,820 (reported on 1.7% of returns)
95959:
$19,820
California:
$30,163
(% of AGI for various income ranges: 10.8% for AGIs below $25k, 67.5% for AGIs $50k-75k, 156.9% for AGIs $100k-200k, 776.2% for AGIs over 200k)
Total itemized deductions: $34,046 (reported on 16.9% of returns)
Here:
$34,046
State:
$39,517
(% of AGI for various income ranges: 183.7% for AGIs below $25k, 389.2% for AGIs $25k-50k, 798.5% for AGIs $50k-75k, 1397.7% for AGIs $75k-100k, 2226.6% for AGIs $100k-200k, 11271.9% for AGIs over 200k)
Charity contributions: $9,067 (reported on 13.3% of returns)
Here:
$9,067
State:
$12,598
(% of AGI for various income ranges: 8.5% for AGIs below $25k, 31.7% for AGIs $25k-50k, 83.7% for AGIs $50k-75k, 138.4% for AGIs $75k-100k, 350.7% for AGIs $100k-200k, 4250.0% for AGIs over 200k)
Taxes paid: $8,272 (reported on 16.7% of returns)
95959:
$8,272
State:
$8,807
(% of AGI for various income ranges: 35.0% for AGIs below $25k, 77.0% for AGIs $25k-50k, 199.4% for AGIs $50k-75k, 403.3% for AGIs $75k-100k, 656.1% for AGIs $100k-200k, 2180.0% for AGIs over 200k)
Earned income credit: $1,543 (reported on 10.5% of returns)
Here:
$1,543
State:
$2,074
(% of AGI for various income ranges: 63.7% for AGIs below $25k, 51.1% for AGIs $25k-50k)
Percentage of individuals using paid preparers for their 2020 taxes: 92.1%
Here:
92%
State:
92%
(% for various income ranges: 88.4% for AGIs below $25k, 92.4% for AGIs $25k-50k, 94.5% for AGIs $50k-75k, 94.3% for AGIs $75k-100k, 93.9% for AGIs $100k-200k, 95.6% for AGIs over 200k)
Averages for the 2012 tax year for zip code 95959, filed in 2013:
Average Adjusted Gross Income (AGI) in 2012: $68,538 (Individual Income Tax Returns)
Here:
$68,538
State:
$72,726
Salary/wage: $51,535 (reported on 63.4% of returns)
Here:
$51,535
State:
$59,079
(% of AGI for various income ranges: 53.4% for AGIs below $25k, 50.6% for AGIs $25k-50k, 53.2% for AGIs $50k-75k, 49.0% for AGIs $75k-100k, 53.5% for AGIs $100k-200k, 37.3% for AGIs over 200k)
Taxable interest for individuals: $2,272 (reported on 51.4% of returns)
This zip code:
$2,272
California:
$2,146
(% of AGI for various income ranges: 2.6% for AGIs below $25k, 1.6% for AGIs $25k-50k, 1.7% for AGIs $50k-75k, 1.8% for AGIs $75k-100k, 1.5% for AGIs $100k-200k, 1.7% for AGIs over 200k)
Ordinary dividends: $9,270 (reported on 33.0% of returns)
Here:
$9,270
State:
$9,308
(% of AGI for various income ranges: 4.9% for AGIs below $25k, 3.2% for AGIs $25k-50k, 3.7% for AGIs $50k-75k, 3.8% for AGIs $75k-100k, 3.9% for AGIs $100k-200k, 6.0% for AGIs over 200k)
Net capital gain/loss in AGI: +$18,118 (reported on 31.8% of returns)
Here:
+$18,118
State:
+$30,460
(% of AGI for various income ranges: 0.7% for AGIs $25k-50k, 1.2% for AGIs $50k-75k, 2.9% for AGIs $75k-100k, 3.6% for AGIs $100k-200k, 22.9% for AGIs over 200k)
Profit/loss from business: +$20,355 (reported on 29.7% of returns)
Here:
+$20,355
State:
+$17,064
(% of AGI for various income ranges: 22.7% for AGIs below $25k, 15.0% for AGIs $25k-50k, 8.2% for AGIs $50k-75k, 7.2% for AGIs $75k-100k, 5.8% for AGIs $100k-200k, 7.3% for AGIs over 200k)
Taxable individual retirement arrangement distribution: $19,346 (reported on 16.9% of returns)
95959:
$19,346
California:
$19,557
(% of AGI for various income ranges: 5.7% for AGIs below $25k, 4.8% for AGIs $25k-50k, 4.6% for AGIs $50k-75k, 6.2% for AGIs $75k-100k, 6.8% for AGIs $100k-200k, 2.3% for AGIs over 200k)
Self-employment retirement plans: $16,777 (reported on 1.6% of returns)
95959:
$16,777
California:
$24,530
(% of AGI for various income ranges: 0.5% for AGIs below $25k, 0.5% for AGIs $50k-75k, 0.4% for AGIs $100k-200k, 0.6% for AGIs over 200k)
Total itemized deductions: $28,263 (25% of AGI, reported on 45.0% of returns)
Here:
$28,263
State:
$34,004
Here:
24.8% of AGI
State:
22.7% of AGI
(% of AGI for various income ranges: 25.4% for AGIs below $25k, 18.7% for AGIs $25k-50k, 18.7% for AGIs $50k-75k, 19.2% for AGIs $75k-100k, 18.7% for AGIs $100k-200k, 16.6% for AGIs over 200k)
Charity contributions: $4,113 (reported on 36.8% of returns)
Here:
$4,113
State:
$4,659
(% of AGI for various income ranges: 1.1% for AGIs below $25k, 1.3% for AGIs $25k-50k, 1.5% for AGIs $50k-75k, 2.2% for AGIs $75k-100k, 2.1% for AGIs $100k-200k, 3.2% for AGIs over 200k)
Taxes paid: $10,487 (reported on 44.9% of returns)
95959:
$10,487
State:
$14,448
(% of AGI for various income ranges: 4.9% for AGIs below $25k, 4.4% for AGIs $25k-50k, 5.1% for AGIs $50k-75k, 5.9% for AGIs $75k-100k, 7.3% for AGIs $100k-200k, 8.9% for AGIs over 200k)
Earned income credit: $1,620 (reported on 13.5% of returns)
Here:
$1,620
State:
$2,286
(% of AGI for various income ranges: 4.0% for AGIs below $25k, 0.6% for AGIs $25k-50k)
Percentage of individuals using paid preparers for their 2012 taxes: 58.4%
Here:
58%
State:
64%
(% for various income ranges: 49.8% for AGIs below $25k, 57.2% for AGIs $25k-50k, 61.2% for AGIs $50k-75k, 64.6% for AGIs $75k-100k, 69.0% for AGIs $100k-200k, 78.4% for AGIs over 200k)
Averages for the 2004 tax year for zip code 95959, filed in 2005:
Average Adjusted Gross Income (AGI) in 2004: $57,203 (Individual Income Tax Returns)
Here:
$57,203
State:
$58,600
Salary/wage: $43,664 (reported on 68.4% of returns)
Here:
$43,664
State:
$49,455
(% of AGI for various income ranges: 242.5% for AGIs below $10k, 59.6% for AGIs $10k-25k, 61.3% for AGIs $25k-50k, 59.2% for AGIs $50k-75k, 57.3% for AGIs $75k-100k, 43.6% for AGIs over 100k)
Taxable interest for individuals: $2,773 (reported on 58.5% of returns)
This zip code:
$2,773
California:
$2,365
(% of AGI for various income ranges: 34.5% for AGIs below $10k, 4.1% for AGIs $10k-25k, 3.2% for AGIs $25k-50k, 2.3% for AGIs $50k-75k, 2.3% for AGIs $75k-100k, 2.6% for AGIs over 100k)
Taxable dividends: $6,176 (reported on 37.7% of returns)
Here:
$6,176
State:
$4,746
(% of AGI for various income ranges: 27.8% for AGIs below $10k, 3.9% for AGIs $10k-25k, 2.8% for AGIs $25k-50k, 3.1% for AGIs $50k-75k, 2.4% for AGIs $75k-100k, 5.0% for AGIs over 100k)
Net capital gain/loss: +$17,142 (reported on 34.8% of returns)
Here:
+$17,142
State:
+$23,418
(% of AGI for various income ranges: -15.4% for AGIs below $10k, 1.6% for AGIs $10k-25k, 1.2% for AGIs $25k-50k, 2.2% for AGIs $50k-75k, 3.8% for AGIs $75k-100k, 18.5% for AGIs over 100k)
Profit/loss from business: +$22,244 (reported on 28.3% of returns)
Here:
+$22,244
State:
+$16,826
(% of AGI for various income ranges: 23.5% for AGIs below $10k, 16.8% for AGIs $10k-25k, 12.1% for AGIs $25k-50k, 10.3% for AGIs $50k-75k, 10.9% for AGIs $75k-100k, 10.1% for AGIs over 100k)
IRA payment deduction: $3,417 (reported on 4.5% of returns)
95959:
$3,417
California:
$3,192
(% of AGI for various income ranges: 1.5% for AGIs below $10k, 0.6% for AGIs $10k-25k, 0.5% for AGIs $25k-50k, 0.4% for AGIs $50k-75k, 0.3% for AGIs $75k-100k, 0.1% for AGIs over 100k)
Self-employed pension: $14,563 (reported on 3.2% of returns)
Here:
$14,563
California:
$17,688
(% of AGI for various income ranges: 0.2% for AGIs $10k-25k, 0.5% for AGIs $25k-50k, 0.7% for AGIs $50k-75k, 1.1% for AGIs $75k-100k, 0.9% for AGIs over 100k)
Total itemized deductions: $25,170 (26% of AGI, reported on 46.7% of returns)
Here:
$25,170
State:
$28,113
Here:
26.0% of AGI
State:
25.3% of AGI
(% of AGI for various income ranges: 111.5% for AGIs below $10k, 24.7% for AGIs $10k-25k, 20.5% for AGIs $25k-50k, 22.1% for AGIs $50k-75k, 21.1% for AGIs $75k-100k, 18.5% for AGIs over 100k)
Charity contributions deductions: $3,429 (3% of AGI, reported on 40.1% of returns)
Here:
$3,429
State:
$3,923
Here:
3.3% of AGI
State:
3.3% of AGI
(% of AGI for various income ranges: 3.6% for AGIs below $10k, 1.5% for AGIs $10k-25k, 1.7% for AGIs $25k-50k, 2.6% for AGIs $50k-75k, 2.2% for AGIs $75k-100k, 2.7% for AGIs over 100k)
Total tax: $9,700 (reported on 80.0% of returns)
95959:
$9,700
State:
$10,761
(% of AGI for various income ranges: 15.7% for AGIs below $10k, 6.2% for AGIs $10k-25k, 8.0% for AGIs $25k-50k, 9.8% for AGIs $50k-75k, 11.1% for AGIs $75k-100k, 17.8% for AGIs over 100k)
Earned income credit: $1,259 (reported on 10.9% of returns)
Here:
$1,259
State:
$1,763
Percentage of individuals using paid preparers for their 2004 taxes: 62.4%
Here:
62%
State:
66%
(% for various income ranges: 52.8% for AGIs below $10k, 57.2% for AGIs $10k-25k, 61.9% for AGIs $25k-50k, 66.6% for AGIs $50k-75k, 69.5% for AGIs $75k-100k, 77.7% for AGIs over 100k)
Likely homosexual households (counted as self-reported same-sex unmarried-partner households)
Lesbian couples: 0.4% of all households
Gay men: 0.0% of all households
Household received Food Stamps/SNAP in the past 12 months: 495 Household did not receive Food Stamps/SNAP in the past 12 months: 7,138
Women who had a birth in the past 12 months: 196 (137 now married, 59 unmarried) Women who did not have a birth in the past 12 months: 2,753 (959 now married, 1,799 unmarried)
Housing units in zip code 95959 with a mortgage: 3,171 (291 second mortgage, 14 home equity loan, 231 both second mortgage and home equity loan) Houses without a mortgage: 96
Median monthly owner costs for units with a mortgage: $2,545 Median monthly owner costs for units without a mortgage: $802
Residents with income below the poverty level in 2022:
This zip code:
12.0%
Whole state:
12.2%
Residents with income below 50% of the poverty level in 2022:
This zip code:
6.0%
Whole state:
6.2%
Median number of rooms in houses and condos:
Here:
6.0
State:
6.0
Median number of rooms in apartments:
Here:
4.1
State:
3.9
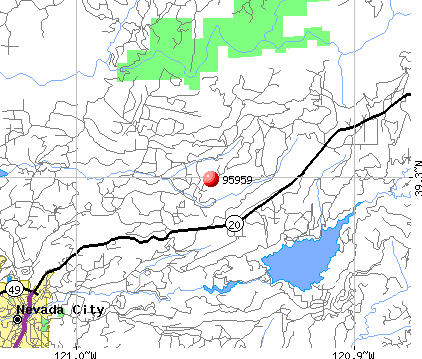
Notable locations in this zip code not listed on our city pages
Notable locations in zip code 95959: Marten Ranch (A), Chute Hill Campground (B), White Cloud Guard Station (C), Stockdale Ranch (D), Williams Ranch (E), CYA Camp (F), Tull Ranch (G), Rock Creek Trail Picnic Area (H), Columbia Hill CDF Fire Station (I), White Cloud Campground (J), White Cloud Picnic Area (K), Skillman Campground (L), B-Four Ranch (M), Badger Hill Diggings (N), Buck Ranch (O), Casci Ranch (P), Central House (Q), Cherokee Diggings (R), Fivemile House (S), Four-T Ranch (T). Display/hide their locations on the map
Churches in zip code 95959 include: First Methodist Church (A), First Baptist Church (B), Trinity Episcopal Church (C). Display/hide their locations on the map
Reservoirs: Banner Reservoir (A), Lake Vera (B), Blair Lake (C), Diggins Pond (D), Herring Reservoir (E), Scotts Flat Reservoir (F), Morris Reservoir (G), Deer Creek Reservoir (H). Display/hide their locations on the map
Streams, rivers, and creeks: Deadman Creek (A), Fish Creek (B), Jefferson Creek (C), McKilligan Creek (D), Spring Creek (E), South Fork Poorman Creek (F), Gold Run (G), Rush Creek (H), Rock Creek (I). Display/hide their locations on the map
Parks in zip code 95959 include: Malakoff Diggins State Historic Park (1), Malakoff Diggins-North Bloomfield Historic District (2), Nevada City Downtown Historic District (3), Pioneer Park (4), Rock Creek Nature Study Area (5). Display/hide their locations on the map
1,580 married couples with children.
605 single-parent households (183 men, 422 women).
94.3% of residents of 95959 zip code speak English at home.
1.9% of residents speak Spanish at home (40% very well, 19% well, 39% not well, 2% not at all).
2.6% of residents speak other Indo-European language at home (95% very well, 5% well).
1.5% of residents speak Asian or Pacific Island language at home (43% very well, 30% well, 27% not at all).
0.1% of residents speak other language at home (100% very well).
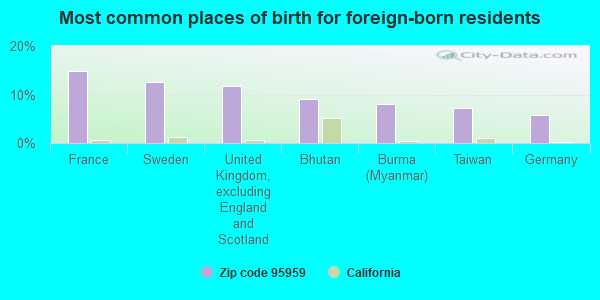
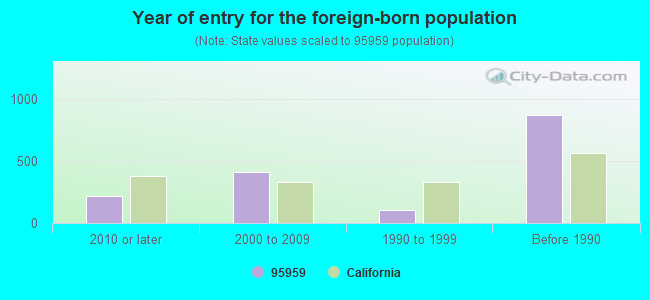
Foreign born population: 1,382 (7.6%) (45.2% of them are naturalized citizens)
This zip code:
7.6%
Whole state:
26.7%
15%France
12%Sweden
12%United Kingdom, excluding England and Scotland
9%Bhutan
8%Burma (Myanmar)
7%Taiwan
6%Germany
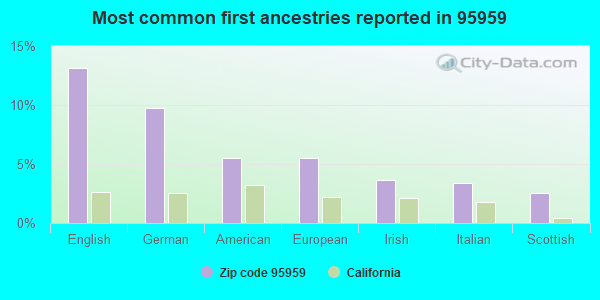
13%English
10%German
5%American
5%European
4%Irish
3%Italian
3%Scottish
Year of entry for the foreign-born population
2192010 or later
4122000 to 2009
1061990 to 1999
872Before 1990
Major facilities with environmental interests located in this zip code:
HIGH COUNTRY TEK (208 GOLD FLAT CT, UNIT A in NEVADA CITY, CA)
STATE MASTER (California - Hazardous Waste Tracking) - HAZARDOU WASTE PROGRAM (Integrated Compliance Information System) - ICIS-09-2003-0048, FORMAL ENFORCEMENT ACTION HAZARDOUS WASTE BIENNIAL REPORTER (Resource Conservation and Recovery Act (tracking hazardous waste)) Large Quantity Generators, more that 1000 kg of hazardous waste/month (Resource Conservation and Recovery Act (tracking hazardous waste)) TRI REPORTER (Tracking of toxic chemicals releasing facilities) Business SIC classification: PRINTED CIRCUIT BOARDS Business NAICS classification: BARE PRINTED CIRCUIT BOARD MANUFACTURING.
3 R COMMUNITY DAY (13061 NEVADA CITY HWY. in NEVADA CITY, CA)
(National Center for Education Statistics) - STATE ID-6116784 Organizations: NEVADA CO. OFFICE OF EDUCATION (SCHOOL DISTRICT)
EMPIRE CONTINUATION HIGH (11425 CONSERVATION ROAD in NEVADA CITY, CA)
(National Center for Education Statistics) - STATE ID-2932507 Organizations: NEVADA JOINT UNION HIGH (SCHOOL DISTRICT)
FOREST SCHOOL INDEPENDENT STUDY PROGRAM (18847 OAK TREE ROAD in NEVADA CITY, CA)
(National Center for Education Statistics) - STATE ID-6118996 Organizations: TWIN RIDGES ELEMENTARY (SCHOOL DISTRICT)
GOLD RUN ELEMENTARY (470 SEARLS AVE. in NEVADA CITY, CA)
(National Center for Education Statistics) - STATE ID-6109391 Organizations: NEVADA CITY ELEMENTARY (SCHOOL DISTRICT)
GRIZZLY HILL (16661 OLD MILL ROAD in NEVADA CITY, CA)
(National Center for Education Statistics) - STATE ID-6089403 Organizations: TWIN RIDGES ELEMENTARY (SCHOOL DISTRICT)
NEVADA CITY CHARTER (ALTER.) (700 HOOVER LANE in NEVADA CITY, CA)
(National Center for Education Statistics) - STATE ID-6112593 Organizations: NEVADA CITY ELEMENTARY (SCHOOL DISTRICT)
NEVADA CITY ELEMENTARY (505 MAIN ST. in NEVADA CITY, CA)
(National Center for Education Statistics) - STATE ID-6027130
NEVADA CITY SCHOOL OF THE ARTS (CHARTER) (13032 BITNEY SPRINGS ROAD in NEVADA CITY, CA)
(National Center for Education Statistics) - STATE ID-6111413 Organizations: TWIN RIDGES ELEMENTARY (SCHOOL DISTRICT)
CASCADE SHORES WWTP (14326 GAS CANYON ROAD in NEVADA CITY, CA)
National Pollutant Discharge Elimination System NON-MAJOR (Tracking pollutant discharge elimination systems) - permit National Pollutant Discharge Elimination System NON-MAJOR (Tracking pollutant discharge elimination systems) - permit Business SIC classification: SEWERAGE SYSTEMS Organizations: NEVADA CO SAN DIST NO 1 (CONTACT/OWNER)
Alternative names: CASCADE SHORES WATER CO, NEVADA CO SAN DIST NO 1
GRASS VALLEY GROUP INCORPORATED (104 NEW MOHAWK RD. in NEVADA CITY, CA)
(Resource Conservation and Recovery Act (tracking hazardous waste)) TRI REPORTER (Tracking of toxic chemicals releasing facilities) Organizations: TEKTRONIX (CONTACT/OWNER)
, DON WALCUTT (CONTACT/OWNER)
NEVADA CITY WWTP (650 JORDAN STREET in NEVADA CITY, CA)
National Pollutant Discharge Elimination System NON-MAJOR (Tracking pollutant discharge elimination systems) - permit Business SIC classification: SEWERAGE SYSTEMS Organizations: NEVADA CITY, CITY OF (CONTACT/OWNER)
Alternative names: NEVADA CITY, CITY OF, NEVADA CITY WASTEWATER TREATMENT PLANT
CALIF DEPT FORESTRY (10242 RIDGE RD in NEVADA CITY, CA)
Small Quantity Generators, between 100 kg and 1000 kg of hazardous waste/month (Resource Conservation and Recovery Act (tracking hazardous waste)) - notification Organizations: STATE OF CALIFORNIA DEPT FORESTRY (CONTACT/OWNER)
Housing units lacking complete plumbing facilities: 0.3% Housing units lacking complete kitchen facilities: 2.1%
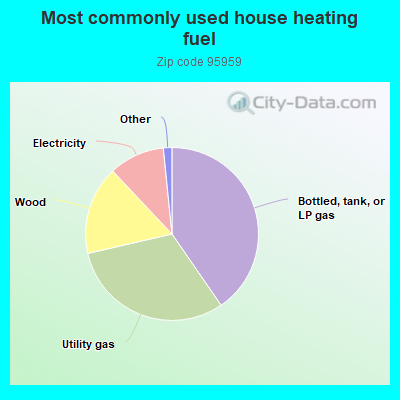
40.4%Bottled, tank, or LP gas
31.0%Utility gas
16.6%Wood
10.4%Electricity
0.5%Solar energy
0.5%Other fuel
Population in 1990: 16,670. Population change in the 1990s: +597 (+3.6%).
Place of birth for U.S.-born residents:
This state: 11,741
Northeast: 1,272
Midwest: 1,494
South: 973
West: 877
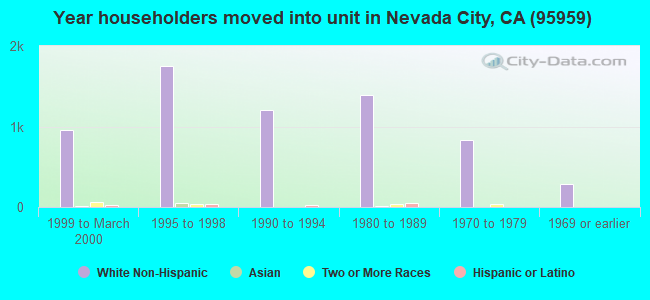
58% of the 95959 zip code residents lived in the same house 5 years ago. Out of people who lived in different houses, 51% lived in this county. Out of people who lived in different counties, 50% lived in California.
92% of the 95959 zip code residents lived in the same house 1 year ago. Out of people who lived in different houses, 43% moved from this county. Out of people who lived in different houses, 29% moved from different county within same state. Out of people who lived in different houses, 25% moved from different state. Out of people who lived in different houses, 6% moved from abroad.
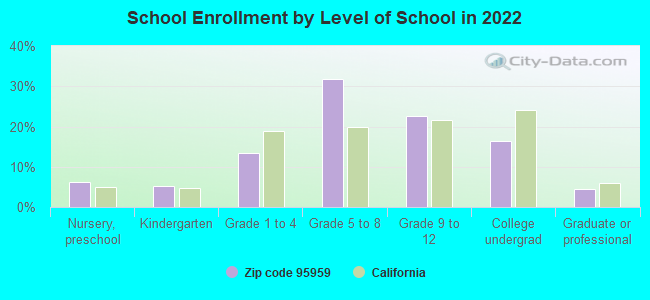
Private vs. public school enrollment:
Students in private schools in grades 1 to 8 (elementary and middle school): 22
Here:
2.2%
California:
10.5%
Students in private schools in grades 9 to 12 (high school): 34
Here:
6.7%
California:
8.5%
Students in private undergraduate colleges: 33
Here:
9.2%
California:
15.9%
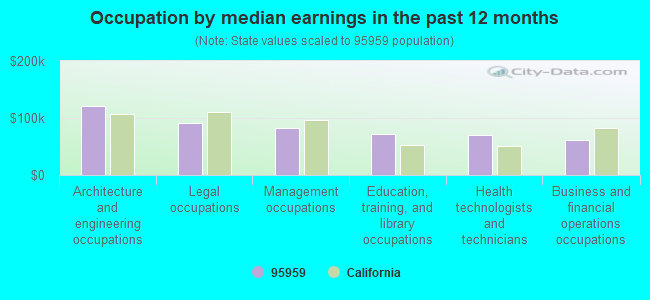
Occupation by median earnings in the past 12 months ($)
120,962Architecture and engineering occupations
91,460Legal occupations
82,405Management occupations
71,717Education, training, and library occupations
70,735Health technologists and technicians
61,263Business and financial operations occupations
Companies with federal contracts located in this zip code:
TELESTREAM, INC (848 GOLD FLAT RD # 1 in NEVADA CITY, CA; small business) : $958,169 in 23 contractsfrom 2000 to 2006
Contracts for Radio and Television Communication Equipment, Except Airborne, Video Recording and Reproducing Equipment, Miscellaneous Communication Equipment, ADP Software, and moreby Department of Defense, Navy, American Forces Information Service, Air Force, and others Signed by year:2000: $324,984; 2001: $297,902; 2002: $202,060; 2003: $27,082; 2004: $13,813; 2005: $38,453; 2006: $53,875.
Biggest contracts:
$94,787 with Department of Defense for Radio and Television Communication Equipment, Except Airborne. Signed on 2000-04-11. Completion date: 2000-05-18.
$94,787, same as above.Signed on 2000-04-11. Completion date: 2000-05-18.
$81,246, same as above.Signed on 2001-09-21. Completion date: 2001-10-05.
$81,246, same as above.Signed on 2001-07-18. Completion date: 2001-07-17.
COUNTY OF NEVADA (950 MAIDU AVE in NEVADA CITY, CA) : $31,262 in 8 contractsfrom 2004 to 2006
Contracts for Legal Services, Other Professional Services, Guard Services by Army, U.S. Army Corps of Engineers - civil program financing only Signed by year:2000: $0; 2001: $0; 2002: $0; 2003: $0; 2004: $4,349; 2005: $17,942; 2006: $8,971.
Biggest contracts:
$8,971 with Army for Legal Services. Signed on 2006-04-27. Completion date: 2006-09-03.
$8,971 with Army for Other Professional Services. Signed on 2005-04-19. Completion date: 2005-09-04.
$8,971 with U.S. Army Corps of Engineers - civil program financing only for Other Professional Services. Signed on 2005-04-19. Completion date: 2005-09-04.
$8,971 with Army for Other Professional Services. Signed on 2004-06-22. Completion date: 2004-09-05.
Top industries in this zip code by the number of employees in 2005:
Health Care and Social Assistance: Other Residential Care Facilities (100-249: 1)
Accommodation and Food Services: Hotels (except Casino Hotels) and Motels (50-99: 1, 20-49: 2, 10-19: 1)
Other Services (except Public Administration): Religious Organizations (50-99: 1, 20-49: 1, 10-19: 1, 5-9: 2, 1-4: 3)
Construction: New Single-Family Housing Construction (except Operative Builders) (10-19: 2, 5-9: 5, 1-4: 33)
Health Care and Social Assistance: Offices of Physicians (except Mental Health Specialists) (20-49: 3, 10-19: 1, 1-4: 7)
Arts, Entertainment, and Recreation: Fitness and Recreational Sports Centers (50-99: 1, 10-19: 1, 1-4: 1)
People in group quarters in 2010:
183 people in local jails and other municipal confinement facilities
170 people in workers' group living quarters and job corps centers
96 people in state prisons
35 people in other noninstitutional facilities
32 people in residential treatment centers for juveniles (non-correctional)
21 people in residential treatment centers for adults
7 people in group homes intended for adults
People in group quarters in 2000:
164 people in local jails and other confinement facilities (including police lockups)
97 people in short-term care, detention or diagnostic centers for delinquent children
29 people in other group homes
23 people in homes for the mentally retarded
15 people in homes or halfway houses for drug/alcohol abuse
12 people in hospitals/wards and hospices for chronically ill
12 people in other hospitals or wards for chronically ill
12 people in homes for the physically handicapped
12 people in other noninstitutional group quarters
8 people in homes for the mentally ill
6 people in religious group quarters
Fatal accident statistics in 2014:
Fatal accident count: 1
Vehicles involved in fatal accidents: 2
Fatal accidents caused by drunken drivers: 1
Fatalities: 1
Persons involved in fatal accidents: 2
Pedestrians involved in fatal accidents: 0
Fatal accident statistics in 2013:
Fatal accident count: 4
Vehicles involved in fatal accidents: 5
Fatal accidents caused by drunken drivers: 3
Fatalities: 4
Persons involved in fatal accidents: 11
Pedestrians involved in fatal accidents: 0
2002 - 2018 National Fire Incident Reporting System (NFIRS) incidents
Based on the data from the years 2002 - 2018 the average number of fires per year is 53. The highest number of fires - 108 took place in 2008, and the least - 0 in 2003. The data has an increasing trend.
When looking into fire subcategories, the most reports belonged to: Outside Fires (61.2%), and Structure Fires (20.8%).
Fire incident types reported to NFIRS in Zip Code 95959


 Nearest zip codes: 95960, 95986, 95944, 95945, 95714, 95910.


 Based on the data from the years 2002 - 2018 the average number of fires per year is 53. The highest number of fires - 108 took place in 2008, and the least - 0 in 2003. The data has an increasing trend.
 When looking into fire subcategories, the most reports belonged to: Outside Fires (61.2%), and Structure Fires (20.8%).