Averages for the 2020 tax year for zip code 96041, filed in 2021:
Average Adjusted Gross Income (AGI) in 2020: $43,152 (Individual Income Tax Returns)
Here:
$43,152
State:
$95,910
Salary/wage: $32,725 (reported on 58.7% of returns)
Here:
$32,725
State:
$77,331
(% of AGI for various income ranges: 1104.2% for AGIs below $25k, 3076.2% for AGIs $25k-50k, 7486.7% for AGIs $50k-75k, 8955.0% for AGIs $75k-100k, 21325.0% for AGIs $100k-200k)
Taxable interest for individuals: $1,245 (reported on 29.3% of returns)
This zip code:
$1,245
California:
$2,294
(% of AGI for various income ranges: 17.4% for AGIs below $25k, 89.2% for AGIs $25k-50k, 26.7% for AGIs $50k-75k, 35.0% for AGIs $75k-100k, 550.0% for AGIs $100k-200k)
Ordinary dividends: $7,512 (reported on 10.7% of returns)
Here:
$7,512
State:
$10,949
(% of AGI for various income ranges: 12.6% for AGIs below $25k, 72.3% for AGIs $25k-50k, 2415.0% for AGIs $100k-200k)
Net capital gain/loss in AGI: +$30,012 (reported on 10.7% of returns)
Here:
+$30,012
State:
+$49,306
(% of AGI for various income ranges: 17.9% for AGIs below $25k, 60.0% for AGIs $25k-50k, 11445.0% for AGIs $100k-200k)
Profit/loss from business: +$18,894 (reported on 22.7% of returns)
Here:
+$18,894
State:
+$15,671
(% of AGI for various income ranges: 370.0% for AGIs below $25k, 921.5% for AGIs $25k-50k, 2203.3% for AGIs $50k-75k, 3250.0% for AGIs $75k-100k)
Taxable individual retirement arrangement distribution: $6,925 (reported on 5.3% of returns)
96041:
$6,925
California:
$23,505
(% of AGI for various income ranges: 213.1% for AGIs $25k-50k)
Total itemized deductions: $25,467 (reported on 4.0% of returns)
Here:
$25,467
State:
$39,517
(% of AGI for various income ranges: 402.1% for AGIs below $25k)
Taxes paid: $6,700 (reported on 4.0% of returns)
96041:
$6,700
State:
$8,807
(% of AGI for various income ranges: 154.6% for AGIs $25k-50k)
Earned income credit: $2,073 (reported on 29.3% of returns)
Here:
$2,073
State:
$2,074
(% of AGI for various income ranges: 156.8% for AGIs below $25k, 121.5% for AGIs $25k-50k)
Percentage of individuals using paid preparers for their 2020 taxes: 89.3%
Here:
89%
State:
92%
(% for various income ranges: 86.1% for AGIs below $25k, 90.0% for AGIs $25k-50k, 87.5% for AGIs $50k-75k, 100.0% for AGIs $75k-100k, 100.0% for AGIs $100k-200k)
Averages for the 2012 tax year for zip code 96041, filed in 2013:
Average Adjusted Gross Income (AGI) in 2012: $34,462 (Individual Income Tax Returns)
Here:
$34,462
State:
$72,726
Salary/wage: $28,002 (reported on 66.2% of returns)
Here:
$28,002
State:
$59,079
(% of AGI for various income ranges: 50.0% for AGIs below $25k, 56.7% for AGIs $25k-50k, 56.6% for AGIs $50k-75k, 57.3% for AGIs $75k-100k, 49.1% for AGIs $100k-200k)
Taxable interest for individuals: $1,468 (reported on 33.8% of returns)
This zip code:
$1,468
California:
$2,146
(% of AGI for various income ranges: 2.5% for AGIs below $25k, 1.2% for AGIs $25k-50k, 1.3% for AGIs $50k-75k, 0.5% for AGIs $75k-100k, 1.5% for AGIs $100k-200k)
Ordinary dividends: $3,411 (reported on 12.2% of returns)
Here:
$3,411
State:
$9,308
(% of AGI for various income ranges: 2.3% for AGIs below $25k, 0.6% for AGIs $50k-75k, 4.6% for AGIs $75k-100k)
Net capital gain/loss in AGI: +$2,711 (reported on 12.2% of returns)
Here:
+$2,711
State:
+$30,460
(% of AGI for various income ranges: 7.4% for AGIs $75k-100k)
Profit/loss from business: +$9,533 (reported on 24.3% of returns)
Here:
+$9,533
State:
+$17,064
(% of AGI for various income ranges: 14.9% for AGIs below $25k, 12.9% for AGIs $25k-50k, 3.3% for AGIs $50k-75k)
Taxable individual retirement arrangement distribution: $10,117 (reported on 8.1% of returns)
96041:
$10,117
California:
$19,557
Total itemized deductions: $19,240 (29% of AGI, reported on 20.3% of returns)
Here:
$19,240
State:
$34,004
Here:
29.1% of AGI
State:
22.7% of AGI
(% of AGI for various income ranges: 10.8% for AGIs below $25k, 9.9% for AGIs $25k-50k, 7.5% for AGIs $50k-75k, 12.7% for AGIs $75k-100k, 15.7% for AGIs $100k-200k)
Charity contributions: $2,000 (reported on 14.9% of returns)
Here:
$2,000
State:
$4,659
(% of AGI for various income ranges: 0.8% for AGIs below $25k, 0.6% for AGIs $25k-50k, 1.0% for AGIs $50k-75k, 1.7% for AGIs $100k-200k)
Taxes paid: $5,613 (reported on 20.3% of returns)
96041:
$5,613
State:
$14,448
(% of AGI for various income ranges: 2.1% for AGIs below $25k, 1.7% for AGIs $25k-50k, 2.0% for AGIs $50k-75k, 3.3% for AGIs $75k-100k, 7.2% for AGIs $100k-200k)
Earned income credit: $2,184 (reported on 25.7% of returns)
Here:
$2,184
State:
$2,286
(% of AGI for various income ranges: 6.8% for AGIs below $25k, 1.4% for AGIs $25k-50k)
Percentage of individuals using paid preparers for their 2012 taxes: 52.7%
Here:
53%
State:
64%
(% for various income ranges: 42.5% for AGIs below $25k, 61.1% for AGIs $25k-50k, 100.0% for AGIs $50k-75k, 75.0% for AGIs $100k-200k)
Averages for the 2004 tax year for zip code 96041, filed in 2005:
Average Adjusted Gross Income (AGI) in 2004: $29,672 (Individual Income Tax Returns)
Here:
$29,672
State:
$58,600
Salary/wage: $24,102 (reported on 76.8% of returns)
Here:
$24,102
State:
$49,455
(% of AGI for various income ranges: 104.5% for AGIs below $10k, 60.9% for AGIs $10k-25k, 72.7% for AGIs $25k-50k, 68.0% for AGIs $50k-75k, 47.3% for AGIs $75k-100k, 39.4% for AGIs over 100k)
Taxable interest for individuals: $1,653 (reported on 40.7% of returns)
This zip code:
$1,653
California:
$2,365
(% of AGI for various income ranges: 8.5% for AGIs below $10k, 2.7% for AGIs $10k-25k, 1.1% for AGIs $25k-50k, 2.6% for AGIs $50k-75k, 1.5% for AGIs $75k-100k, 3.0% for AGIs over 100k)
Taxable dividends: $2,796 (reported on 17.1% of returns)
Here:
$2,796
State:
$4,746
(% of AGI for various income ranges: 3.8% for AGIs below $10k, 1.5% for AGIs $10k-25k, 0.5% for AGIs $25k-50k, 1.0% for AGIs $50k-75k, 1.3% for AGIs $75k-100k, 4.5% for AGIs over 100k)
Net capital gain/loss: +$6,100 (reported on 17.5% of returns)
Here:
+$6,100
State:
+$23,418
(% of AGI for various income ranges: 12.5% for AGIs below $10k, 0.2% for AGIs $10k-25k, 0.4% for AGIs $25k-50k, 4.6% for AGIs $50k-75k, 1.0% for AGIs $75k-100k, 11.6% for AGIs over 100k)
Profit/loss from business: +$6,817 (reported on 20.5% of returns)
Here:
+$6,817
State:
+$16,826
(% of AGI for various income ranges: -23.7% for AGIs below $10k, 10.0% for AGIs $10k-25k, 5.0% for AGIs $25k-50k, 1.6% for AGIs $50k-75k, 16.6% for AGIs $75k-100k)
IRA payment deduction: $3,000 (reported on 2.1% of returns)
96041:
$3,000
California:
$3,192
Total itemized deductions: $17,287 (28% of AGI, reported on 17.9% of returns)
Here:
$17,287
State:
$28,113
Here:
28.0% of AGI
State:
25.3% of AGI
(% of AGI for various income ranges: 7.7% for AGIs $10k-25k, 7.6% for AGIs $25k-50k, 10.2% for AGIs $50k-75k, 15.4% for AGIs $75k-100k, 17.1% for AGIs over 100k)
Charity contributions deductions: $3,530 (5% of AGI, reported on 14.6% of returns)
Here:
$3,530
State:
$3,923
Here:
5.3% of AGI
State:
3.3% of AGI
(% of AGI for various income ranges: 0.3% for AGIs $10k-25k, 0.7% for AGIs $25k-50k, 1.4% for AGIs $50k-75k, 5.8% for AGIs $75k-100k, 3.2% for AGIs over 100k)
Total tax: $3,715 (reported on 65.7% of returns)
96041:
$3,715
State:
$10,761
(% of AGI for various income ranges: 2.6% for AGIs below $10k, 4.0% for AGIs $10k-25k, 6.3% for AGIs $25k-50k, 8.5% for AGIs $50k-75k, 12.2% for AGIs $75k-100k, 14.1% for AGIs over 100k)
Earned income credit: $1,786 (reported on 24.0% of returns)
Here:
$1,786
State:
$1,763
Percentage of individuals using paid preparers for their 2004 taxes: 50.2%
Here:
50%
State:
66%
(% for various income ranges: 40.0% for AGIs below $10k, 46.4% for AGIs $10k-25k, 53.0% for AGIs $25k-50k, 63.2% for AGIs $50k-75k, 70.0% for AGIs $75k-100k, 76.9% for AGIs over 100k)
Notable locations in zip code 96041: Salt Creek Campground (A), Camp Springtime (B), Hayfork Bally Lookout (C), Big Creek Ranch (D), Cold Springs Campground (E), Seven Up Cedars (F), Saint Jacques Place (G), Trinity Pines (H), Philpot Campground (I), Foss Camp (J), Fourth of July Camp (K), Naufus Spike Camp (L), Salt Creek School (M), Hayfork Branch Trinity County Library (N), Hayfork Ranger District Station (O), Post Mountain Volunteer Fire Department (P), Hayfork Volunteer Fire Department (Q). Display/hide their locations on the map
Creeks: East Fork Hayfork Creek (A), East Fork Smoky Creek (B), North Fork Hayfork Creek (C), Summit Creek (D), Spot Creek (E), Sims Creek (F), Shock Creek (G), Salt Creek (H), Rusch Creek (I). Display/hide their locations on the map
In group quarters: 41 (-1 institutionalized population)
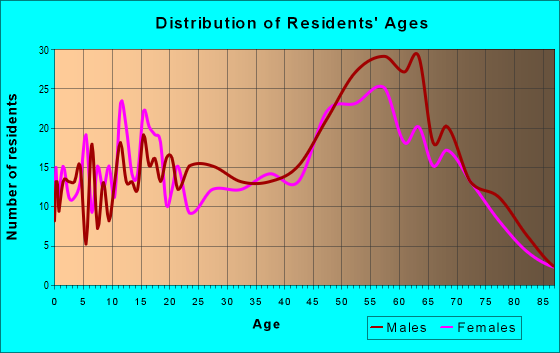
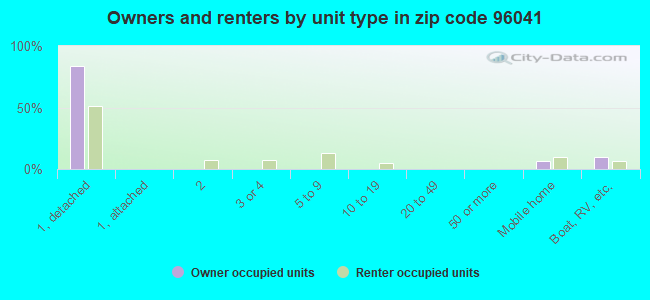
Size of family households: 368 2-persons, 19 4-persons, 52 5-persons
Size of nonfamily households: 544 1-person, 120 2-persons, 52 3-persons
118 married couples with children.
273 single-parent households (273 men).
81.1% of residents of 96041 zip code speak English at home.
12.4% of residents speak Spanish at home (4% very well, 12% well, 83% not well).
2.0% of residents speak other Indo-European language at home (71% very well, 29% not well).
4.2% of residents speak Asian or Pacific Island language at home (100% very well).
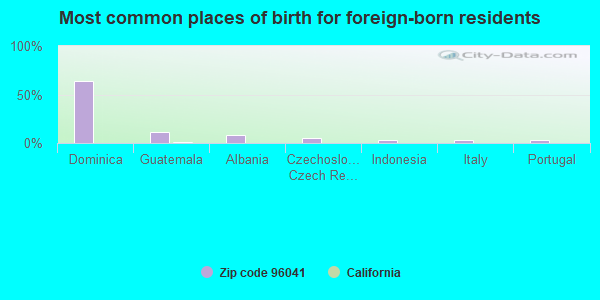
Foreign born population: 635 (18.3%) (34.8% of them are naturalized citizens)
This zip code:
18.3%
Whole state:
26.7%
64%Dominica
11%Guatemala
8%Albania
5%Czechoslovakia (includes Czech Republic and Slovakia)
3%Indonesia
3%Italy
3%Portugal
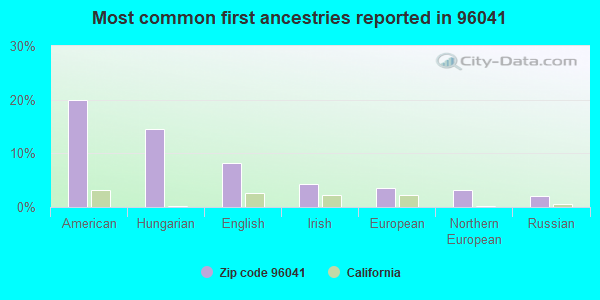
20%American
15%Hungarian
8%English
4%Irish
4%European
3%Northern European
2%Russian
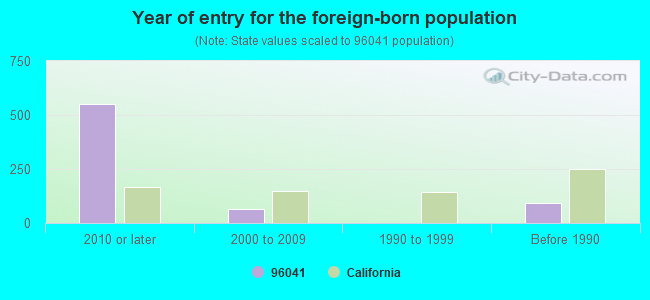
Year of entry for the foreign-born population
5492010 or later
672000 to 2009
21990 to 1999
91Before 1990
Facilities with environmental interests located in this zip code:
HAYFORK HIGH (10 OAK ST. in HAYFORK, CA)
(National Center for Education Statistics) - STATE ID-5337407 Organizations: MOUNTAIN VALLEY UNIFIED (SCHOOL DISTRICT)
HAYFORK VALLEY ELEMENTARY (HWY. 3 MAIN ST. in HAYFORK, CA)
(National Center for Education Statistics) - STATE ID-6053730 Organizations: MOUNTAIN VALLEY UNIFIED (SCHOOL DISTRICT)
MOUNTAIN VALLEY COMMUNITY DAY (HWY. THREE AND SCHOOL ST. in HAYFORK, CA)
(National Center for Education Statistics) - STATE ID-5330089 Organizations: MOUNTAIN VALLEY UNIFIED (SCHOOL DISTRICT)
CAL TRANS HAYFORK MAINT STATION (3 MILES NORTH OF RT 3 AT MORGAN HILL RD in HAYFORK, CA)
Small Quantity Generators, between 100 kg and 1000 kg of hazardous waste/month (Resource Conservation and Recovery Act (tracking hazardous waste))
HAYFORK DISPOSAL SITE (EAST OF HWY 3; SOUTH OF FAIRGROUNDS in HAYFORK, CA)
CRITERIA AND HAZARDOUS AIR POLLUTANT INVENTORY (Inventory of air pollution sources) Business SIC classification: REFUSE SYSTEMS Business NAICS classification: SOLID WASTE LANDFILL.
KINGSBURY CREEK MINE LAB (SHASTA TRINITY NATL. FOREST in HAYFORK, CA)
SUPERFUND (Superfund database)
CALTRANS FOREST GLEN SITE (HWY 36 POST MILE 18 1 in HAYFORK, CA)
Small Quantity Generators, between 100 kg and 1000 kg of hazardous waste/month (Resource Conservation and Recovery Act (tracking hazardous waste))
Housing units lacking complete plumbing facilities: 8.9% Housing units lacking complete kitchen facilities: 6.4%
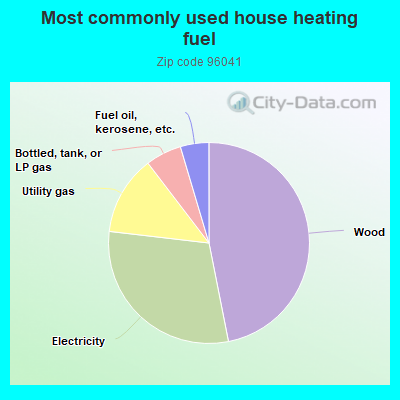
47.0%Wood
30.0%Electricity
12.8%Utility gas
5.8%Bottled, tank, or LP gas
4.6%Fuel oil, kerosene, etc.
Population in 1990: 2,671.
Place of birth for U.S.-born residents:
This state: 2,316
Northeast: 105
Midwest: 160
South: 117
West: 140
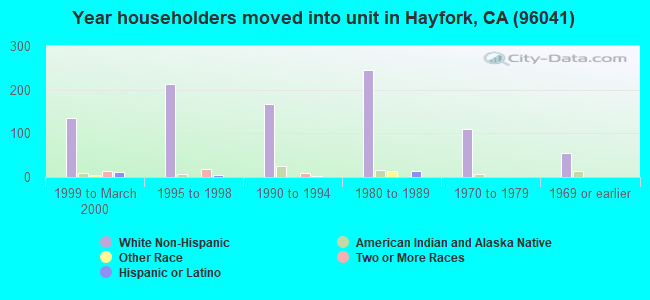
64% of the 96041 zip code residents lived in the same house 5 years ago. Out of people who lived in different houses, 50% lived in this county. Out of people who lived in different counties, 50% lived in California.
65% of the 96041 zip code residents lived in the same house 1 year ago. Out of people who lived in different houses, 76% moved from this county. Out of people who lived in different houses, 18% moved from different state.
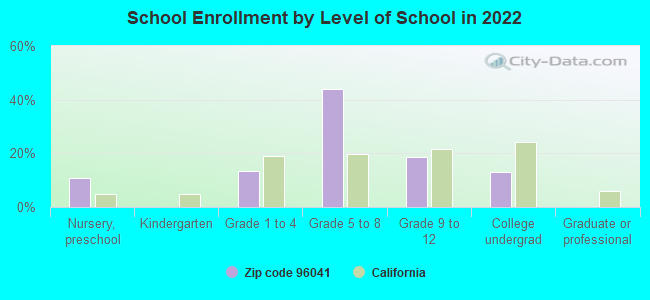
Private vs. public school enrollment:
Students in private schools in grades 1 to 8 (elementary and middle school):
Here:
0.0%
California:
10.5%
Students in private schools in grades 9 to 12 (high school):
Here:
0.0%
California:
8.5%
Students in private undergraduate colleges: 10
Here:
22.7%
California:
15.9%
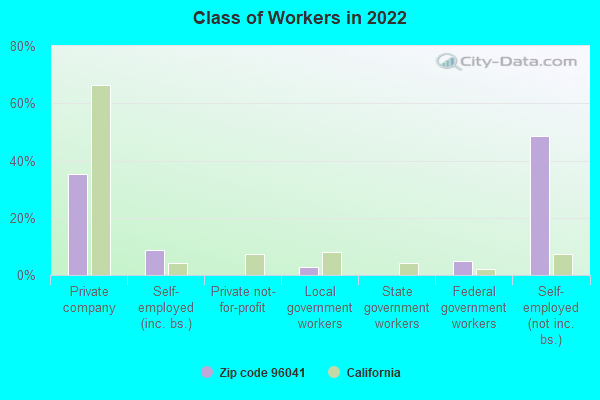
Occupation by median earnings in the past 12 months ($)
83,721Management occupations
2,501Food preparation and serving related occupations
Companies with federal contracts located in this zip code:
ALLIED WATER SERVICE (122 TRINITY PNE in HAYFORK, CA; small business) 5 employees, $250000 revenue.
$65,000 with Forest Service (disused code: now 12C2) for Lease or Rental of Equipment -- Miscellaneous. Taking place in OR. Signed on 2002-09-15. Completion date: 2002-09-15.
MTB (69 EAST RD in HAYFORK, CA; small business) 3 employees, $280000 revenue. Woman Owned Business
$34,000 with Forest Service (disused code: now 12C2) for Forest/Range Fire Suppression/Presuppression Services. Taking place in OR. Signed on 2002-09-15. Completion date: 2002-09-15.
Top industries in this zip code by the number of employees in 2005:
Health Care and Social Assistance: Family Planning Centers (10-19 employees: 1 establishment)
Educational Services: Educational Support Services (10-19: 1)
Professional, Scientific, and Technical Services: Environmental Consulting Services (10-19: 1)
Arts, Entertainment, and Recreation: All Other Amusement and Recreation Industries (10-19: 1)
Health Care and Social Assistance: Offices of Dentists (5-9: 1)
People in group quarters in 2010:
42 people in other noninstitutional facilities
Fatal accident statistics in 2014:
Fatal accident count: 1
Vehicles involved in fatal accidents: 1
Fatal accidents caused by drunken drivers: 1
Fatalities: 1
Persons involved in fatal accidents: 2
Pedestrians involved in fatal accidents: 0
Fatal accident statistics in 2013:
Fatal accident count: 1
Vehicles involved in fatal accidents: 1
Fatal accidents caused by drunken drivers: 1
Fatalities: 1
Persons involved in fatal accidents: 2
Pedestrians involved in fatal accidents: 0
2006 - 2018 National Fire Incident Reporting System (NFIRS) incidents
According to the data from the years 2006 - 2018 the average number of fire incidents per year is 27. The highest number of reported fires - 73 took place in 2015, and the least - 3 in 2006. The data has an increasing trend.
When looking into fire subcategories, the most reports belonged to: Outside Fires (73.9%), and Structure Fires (13.6%).
Fire incident types reported to NFIRS in Zip Code 96041
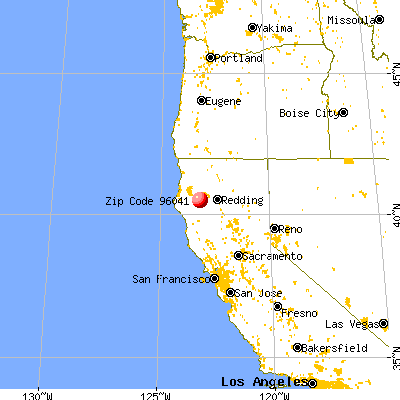


 Nearest zip codes: 96046, 96076, 96024, 95552, 96093, 96048.


 According to the data from the years 2006 - 2018 the average number of fire incidents per year is 27. The highest number of reported fires - 73 took place in 2015, and the least - 3 in 2006. The data has an increasing trend.
 When looking into fire subcategories, the most reports belonged to: Outside Fires (73.9%), and Structure Fires (13.6%).