Estimated zip code population in 2022: 10,069 Zip code population in 2010: 10,031 Zip code population in 2000: 9,528
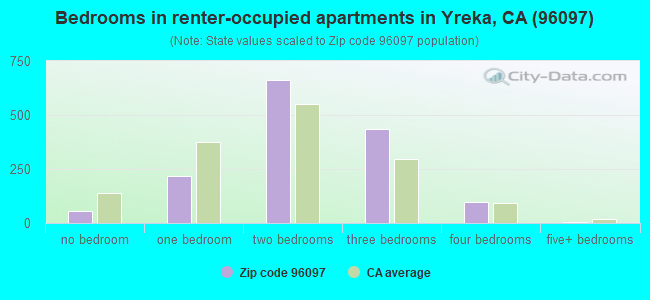
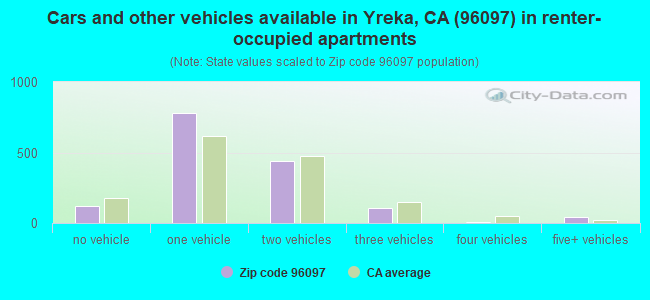
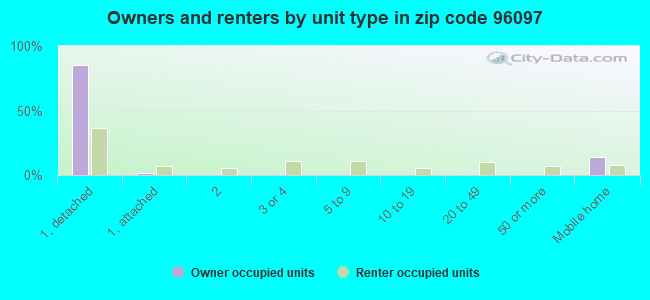
Houses and condos: 4,710 Renter-occupied apartments: 1,478
% of renters here:
34%
State:
44%
March 2022 cost of living index in zip code 96097: 89.7 (less than average, U.S. average is 100)
Land area: 190.7 sq. mi. Water area: 0.4 sq. mi.
Population density: 53 people per square mile
(very low).
OSM Map
General Map
Google Map
MSN Map
OSM Map
General Map
Google Map
MSN Map
OSM Map
General Map
Google Map
MSN Map
OSM Map
General Map
Google Map
MSN Map
Please wait while loading the map...
Real estate property taxes paid for housing units in 2022:
This zip code:
0.6% ($1,529)
California:
0.7% ($4,831)
Median real estate property taxes paid for housing units with mortgages in 2022: $1,990 (0.7%) Median real estate property taxes paid for housing units with no mortgage in 2022: $1,328 (0.6%)
Business Search- 14 Million verified businesses
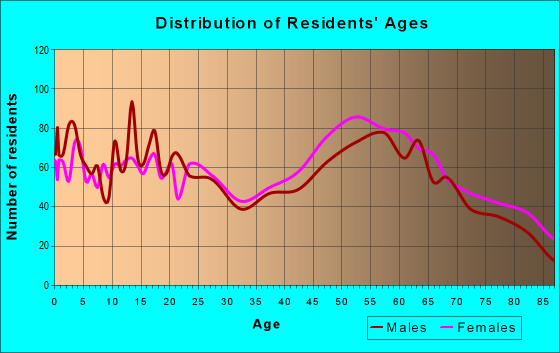
Males: 4,927
(48.9%)
Females: 5,142
(51.1%)
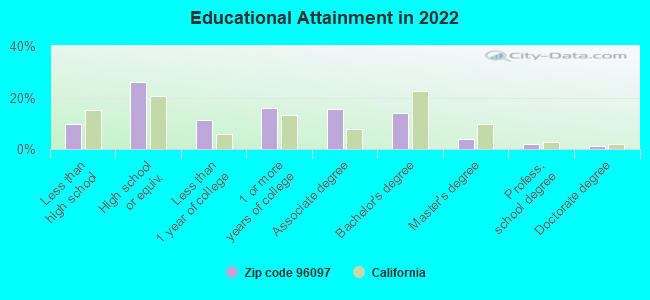
For population 25 years and over in 96097:
High school or higher: 89.2%
Bachelor's degree or higher: 20.9%
Graduate or professional degree: 7.2%
Unemployed: 4.1%
Mean travel time to work (commute): 15.4 minutes
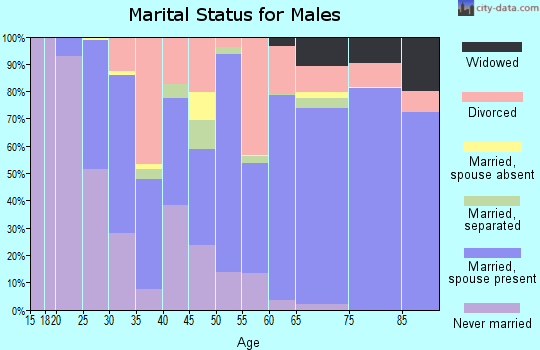
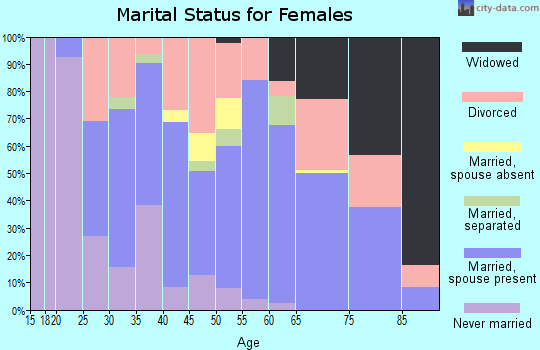
For population 15 years and over in 96097:
Never married: 32.6%
Now married: 43.4%
Separated: 1.6%
Widowed: 7.4%
Divorced: 15.0%
Zip code 96097 compared to state average:
Median household income below state average.
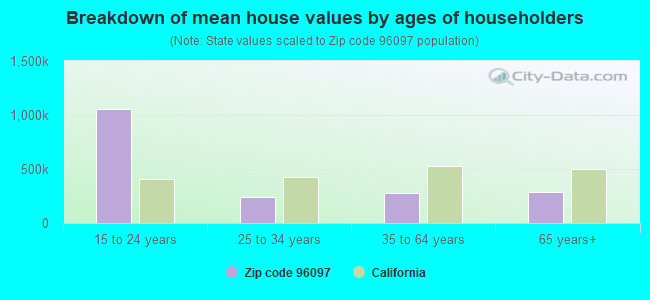
Median house value significantly below state average.
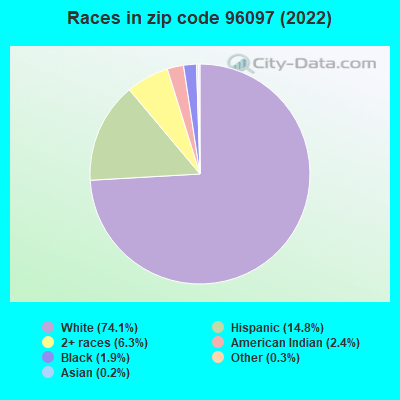
Black race population percentage below state average.
Hispanic race population percentage below state average.
Foreign-born population percentage significantly below state average.
Percentage of population with a bachelor's degree or higher below state average.
Averages for the 2020 tax year for zip code 96097, filed in 2021:
Average Adjusted Gross Income (AGI) in 2020: $54,239 (Individual Income Tax Returns)
Here:
$54,239
State:
$95,910
Salary/wage: $43,280 (reported on 76.2% of returns)
Here:
$43,280
State:
$77,331
(% of AGI for various income ranges: 1151.5% for AGIs below $25k, 3630.8% for AGIs $25k-50k, 6217.4% for AGIs $50k-75k, 9516.4% for AGIs $75k-100k, 15366.4% for AGIs $100k-200k)
Taxable interest for individuals: $1,161 (reported on 32.5% of returns)
This zip code:
$1,161
California:
$2,294
(% of AGI for various income ranges: 20.6% for AGIs below $25k, 31.4% for AGIs $25k-50k, 49.1% for AGIs $50k-75k, 102.3% for AGIs $75k-100k, 200.4% for AGIs $100k-200k)
Ordinary dividends: $3,950 (reported on 16.0% of returns)
Here:
$3,950
State:
$10,949
(% of AGI for various income ranges: 31.0% for AGIs below $25k, 41.8% for AGIs $25k-50k, 73.5% for AGIs $50k-75k, 189.5% for AGIs $75k-100k, 302.4% for AGIs $100k-200k)
Net capital gain/loss in AGI: +$9,129 (reported on 15.1% of returns)
Here:
+$9,129
State:
+$49,306
(% of AGI for various income ranges: 6.7% for AGIs below $25k, 37.5% for AGIs $25k-50k, 95.2% for AGIs $50k-75k, 312.3% for AGIs $75k-100k, 905.6% for AGIs $100k-200k)
Profit/loss from business: +$18,837 (reported on 14.0% of returns)
Here:
+$18,837
State:
+$15,671
(% of AGI for various income ranges: 85.9% for AGIs below $25k, 135.7% for AGIs $25k-50k, 209.3% for AGIs $50k-75k, 628.2% for AGIs $75k-100k, 1025.2% for AGIs $100k-200k)
Taxable individual retirement arrangement distribution: $15,708 (reported on 8.0% of returns)
96097:
$15,708
California:
$23,505
(% of AGI for various income ranges: 51.9% for AGIs below $25k, 74.5% for AGIs $25k-50k, 159.3% for AGIs $50k-75k, 355.9% for AGIs $75k-100k, 1144.0% for AGIs $100k-200k)
Total itemized deductions: $30,808 (reported on 5.8% of returns)
Here:
$30,808
State:
$39,517
(% of AGI for various income ranges: 51.8% for AGIs below $25k, 74.8% for AGIs $25k-50k, 191.3% for AGIs $50k-75k, 571.4% for AGIs $75k-100k, 921.2% for AGIs $100k-200k)
Charity contributions: $8,963 (reported on 4.2% of returns)
Here:
$8,963
State:
$12,598
(% of AGI for various income ranges: 15.3% for AGIs $25k-50k, 21.1% for AGIs $50k-75k, 55.5% for AGIs $75k-100k, 257.2% for AGIs $100k-200k)
Taxes paid: $6,600 (reported on 5.8% of returns)
96097:
$6,600
State:
$8,807
(% of AGI for various income ranges: 7.1% for AGIs below $25k, 13.5% for AGIs $25k-50k, 37.8% for AGIs $50k-75k, 125.0% for AGIs $75k-100k, 276.0% for AGIs $100k-200k)
Earned income credit: $2,293 (reported on 19.4% of returns)
Here:
$2,293
State:
$2,074
(% of AGI for various income ranges: 109.8% for AGIs below $25k, 82.8% for AGIs $25k-50k)
Percentage of individuals using paid preparers for their 2020 taxes: 94.0%
Here:
94%
State:
92%
(% for various income ranges: 92.9% for AGIs below $25k, 95.3% for AGIs $25k-50k, 95.6% for AGIs $50k-75k, 90.0% for AGIs $75k-100k, 93.9% for AGIs $100k-200k, 100.0% for AGIs over 200k)
Averages for the 2012 tax year for zip code 96097, filed in 2013:
Average Adjusted Gross Income (AGI) in 2012: $42,895 (Individual Income Tax Returns)
Here:
$42,895
State:
$72,726
Salary/wage: $35,282 (reported on 78.1% of returns)
Here:
$35,282
State:
$59,079
(% of AGI for various income ranges: 70.3% for AGIs below $25k, 72.1% for AGIs $25k-50k, 64.9% for AGIs $50k-75k, 66.4% for AGIs $75k-100k, 62.2% for AGIs $100k-200k, 34.2% for AGIs over 200k)
Taxable interest for individuals: $1,479 (reported on 37.2% of returns)
This zip code:
$1,479
California:
$2,146
(% of AGI for various income ranges: 1.9% for AGIs below $25k, 1.2% for AGIs $25k-50k, 1.1% for AGIs $50k-75k, 1.2% for AGIs $75k-100k, 0.9% for AGIs $100k-200k, 2.2% for AGIs over 200k)
Ordinary dividends: $3,507 (reported on 17.7% of returns)
Here:
$3,507
State:
$9,308
(% of AGI for various income ranges: 1.8% for AGIs below $25k, 1.2% for AGIs $25k-50k, 1.4% for AGIs $50k-75k, 1.0% for AGIs $75k-100k, 1.3% for AGIs $100k-200k, 2.8% for AGIs over 200k)
Net capital gain/loss in AGI: +$3,738 (reported on 16.0% of returns)
Here:
+$3,738
State:
+$30,460
(% of AGI for various income ranges: 0.8% for AGIs $50k-75k, 0.4% for AGIs $75k-100k, 1.2% for AGIs $100k-200k, 11.3% for AGIs over 200k)
Profit/loss from business: +$13,994 (reported on 15.7% of returns)
Here:
+$13,994
State:
+$17,064
(% of AGI for various income ranges: 4.5% for AGIs below $25k, 3.1% for AGIs $25k-50k, 4.0% for AGIs $50k-75k, 2.1% for AGIs $75k-100k, 4.8% for AGIs $100k-200k, 20.0% for AGIs over 200k)
Taxable individual retirement arrangement distribution: $11,084 (reported on 10.7% of returns)
96097:
$11,084
California:
$19,557
(% of AGI for various income ranges: 3.2% for AGIs below $25k, 2.0% for AGIs $25k-50k, 2.1% for AGIs $50k-75k, 3.1% for AGIs $75k-100k, 4.9% for AGIs $100k-200k)
Self-employment retirement plans: $18,950 (reported on 0.5% of returns)
96097:
$18,950
California:
$24,530
Total itemized deductions: $21,355 (26% of AGI, reported on 25.9% of returns)
Here:
$21,355
State:
$34,004
Here:
26.5% of AGI
State:
22.7% of AGI
(% of AGI for various income ranges: 9.2% for AGIs below $25k, 11.0% for AGIs $25k-50k, 12.5% for AGIs $50k-75k, 14.5% for AGIs $75k-100k, 15.6% for AGIs $100k-200k, 15.1% for AGIs over 200k)
Charity contributions: $3,668 (reported on 20.9% of returns)
Here:
$3,668
State:
$4,659
(% of AGI for various income ranges: 0.6% for AGIs below $25k, 1.1% for AGIs $25k-50k, 1.7% for AGIs $50k-75k, 2.0% for AGIs $75k-100k, 2.8% for AGIs $100k-200k, 2.8% for AGIs over 200k)
Taxes paid: $6,010 (reported on 25.9% of returns)
96097:
$6,010
State:
$14,448
(% of AGI for various income ranges: 1.3% for AGIs below $25k, 2.1% for AGIs $25k-50k, 3.0% for AGIs $50k-75k, 3.9% for AGIs $75k-100k, 5.5% for AGIs $100k-200k, 7.4% for AGIs over 200k)
Earned income credit: $2,207 (reported on 23.4% of returns)
Here:
$2,207
State:
$2,286
(% of AGI for various income ranges: 7.4% for AGIs below $25k, 1.3% for AGIs $25k-50k)
Percentage of individuals using paid preparers for their 2012 taxes: 54.6%
Here:
55%
State:
64%
(% for various income ranges: 47.7% for AGIs below $25k, 53.8% for AGIs $25k-50k, 61.7% for AGIs $50k-75k, 69.0% for AGIs $75k-100k, 64.3% for AGIs $100k-200k, 100.0% for AGIs over 200k)
Averages for the 2004 tax year for zip code 96097, filed in 2005:
Average Adjusted Gross Income (AGI) in 2004: $36,353 (Individual Income Tax Returns)
Here:
$36,353
State:
$58,600
Salary/wage: $29,966 (reported on 77.0% of returns)
Here:
$29,966
State:
$49,455
(% of AGI for various income ranges: 145.3% for AGIs below $10k, 68.3% for AGIs $10k-25k, 70.8% for AGIs $25k-50k, 69.8% for AGIs $50k-75k, 69.0% for AGIs $75k-100k, 39.1% for AGIs over 100k)
Taxable interest for individuals: $1,728 (reported on 49.0% of returns)
This zip code:
$1,728
California:
$2,365
(% of AGI for various income ranges: 11.7% for AGIs below $10k, 3.0% for AGIs $10k-25k, 2.3% for AGIs $25k-50k, 1.4% for AGIs $50k-75k, 1.5% for AGIs $75k-100k, 2.7% for AGIs over 100k)
Taxable dividends: $2,458 (reported on 23.8% of returns)
Here:
$2,458
State:
$4,746
(% of AGI for various income ranges: 5.0% for AGIs below $10k, 1.9% for AGIs $10k-25k, 1.4% for AGIs $25k-50k, 1.4% for AGIs $50k-75k, 1.4% for AGIs $75k-100k, 1.7% for AGIs over 100k)
Net capital gain/loss: +$9,325 (reported on 21.8% of returns)
Here:
+$9,325
State:
+$23,418
(% of AGI for various income ranges: 1.6% for AGIs below $10k, 0.4% for AGIs $10k-25k, 1.2% for AGIs $25k-50k, 2.0% for AGIs $50k-75k, 2.5% for AGIs $75k-100k, 18.0% for AGIs over 100k)
Profit/loss from business: +$15,963 (reported on 18.5% of returns)
Here:
+$15,963
State:
+$16,826
(% of AGI for various income ranges: -17.3% for AGIs below $10k, 6.0% for AGIs $10k-25k, 4.1% for AGIs $25k-50k, 5.7% for AGIs $50k-75k, 7.1% for AGIs $75k-100k, 17.8% for AGIs over 100k)
IRA payment deduction: $2,921 (reported on 3.3% of returns)
96097:
$2,921
California:
$3,192
(% of AGI for various income ranges: 0.2% for AGIs $10k-25k, 0.4% for AGIs $25k-50k, 0.3% for AGIs $50k-75k, 0.2% for AGIs $75k-100k, 0.2% for AGIs over 100k)
Self-employed pension: $17,673 (reported on 1.2% of returns)
Here:
$17,673
California:
$17,688
Total itemized deductions: $17,229 (24% of AGI, reported on 26.5% of returns)
Here:
$17,229
State:
$28,113
Here:
24.5% of AGI
State:
25.3% of AGI
(% of AGI for various income ranges: 18.8% for AGIs below $10k, 10.0% for AGIs $10k-25k, 10.7% for AGIs $25k-50k, 13.0% for AGIs $50k-75k, 14.5% for AGIs $75k-100k, 13.8% for AGIs over 100k)
Charity contributions deductions: $3,165 (4% of AGI, reported on 22.1% of returns)
Here:
$3,165
State:
$3,923
Here:
4.3% of AGI
State:
3.3% of AGI
(% of AGI for various income ranges: 1.3% for AGIs below $10k, 0.9% for AGIs $10k-25k, 1.5% for AGIs $25k-50k, 1.8% for AGIs $50k-75k, 2.3% for AGIs $75k-100k, 2.8% for AGIs over 100k)
Total tax: $5,224 (reported on 72.6% of returns)
96097:
$5,224
State:
$10,761
(% of AGI for various income ranges: 5.0% for AGIs below $10k, 4.1% for AGIs $10k-25k, 6.9% for AGIs $25k-50k, 9.5% for AGIs $50k-75k, 11.0% for AGIs $75k-100k, 18.4% for AGIs over 100k)
Earned income credit: $1,684 (reported on 18.8% of returns)
Here:
$1,684
State:
$1,763
Percentage of individuals using paid preparers for their 2004 taxes: 60.6%
Here:
61%
State:
66%
(% for various income ranges: 52.1% for AGIs below $10k, 59.2% for AGIs $10k-25k, 62.6% for AGIs $25k-50k, 65.9% for AGIs $50k-75k, 69.4% for AGIs $75k-100k, 73.5% for AGIs over 100k)
Likely homosexual households (counted as self-reported same-sex unmarried-partner households)
Lesbian couples: 0.4% of all households
Gay men: 0.2% of all households
Household received Food Stamps/SNAP in the past 12 months: 992 Household did not receive Food Stamps/SNAP in the past 12 months: 3,405
Women who had a birth in the past 12 months: 69 (59 now married, 10 unmarried) Women who did not have a birth in the past 12 months: 2,132 (684 now married, 1,455 unmarried)
Housing units in zip code 96097 with a mortgage: 1,355 (68 second mortgage, 55 both second mortgage and home equity loan) Houses without a mortgage: 24
Median monthly owner costs for units with a mortgage: $1,491 Median monthly owner costs for units without a mortgage: $553
Residents with income below the poverty level in 2022:
This zip code:
19.3%
Whole state:
12.2%
Residents with income below 50% of the poverty level in 2022:
This zip code:
11.7%
Whole state:
6.2%
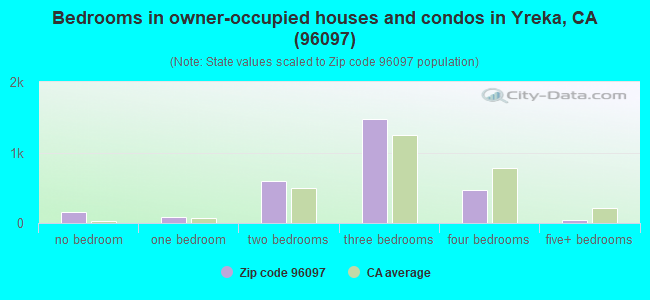
Median number of rooms in houses and condos:
Here:
5.5
State:
6.0
Median number of rooms in apartments:
Here:
4.5
State:
3.9
Notable locations in this zip code not listed on our city pages
Notable locations in zip code 96097: P.P. and L. Radio Repeater Station (A), Klamath National Forest Supervisor Headquarters (B), Forest House (C), Humbug Recreation Site (D), Humbug Picnic Area (E), Pythian Cave Microwave Relay Station (F), Greenhorn School (G), Deadwood (H), Cayuse River Access (I), Cinnabar Camp (J), Humbug Guard Station (K), Yreka City Hall (L), Siskiyou County Public Library (M), Siskiyou County Museum (N), Siskiyou County Law Library (O), Siskiyou County Courthouse (P), Northern Siskiyou Ambulance (Q), South Yreka Fire Protection District (R), California Department of Forestry and Fire Protection Yreka (S), Yreka Volunteer Fire Department (T). Display/hide their locations on the map
Churches in zip code 96097 include: Berean Fundamental Church (A), Bethel Assembly of God Church (B), Church of Christ (C), The Church of Jesus Christ of Latter Day Saints (D), Church of the Nazarene (E), Faith Center Foursquare Church (F), First Baptist Church (G), First Church of Christ Scientist (H), First Southern Baptist Church (I). Display/hide their locations on the map
Streams, rivers, and creeks: Greenhorn Creek (A), Mill Creek (B), Juniper Creek (C), Sucker Creek (D), Skunk Creek (E), Shasta River (F), Punch Creek (G), Keeler Creek (H), Humbug Creek (I). Display/hide their locations on the map
Parks in zip code 96097 include: Randolf Collier Safety Roadside Rest Area (1), Discovery Park (2), Greenhorn Park (3), Yreka Park (4), Newton Park (5), Ringe Park (6), Siskiyou County Fairgrounds (7), West Miner Street-Third Street Historic District (8). Display/hide their locations on the map
In group quarters: 103 (-1 institutionalized population)
Size of family households: 1,184 2-persons, 413 3-persons, 333 4-persons, 249 5-persons, 67 6-persons, 79 7-or-more-persons
Size of nonfamily households: 1,641 1-person, 330 2-persons, 35 3-persons
1,053 married couples with children.
1,031 single-parent households (126 men, 905 women).
93.5% of residents of 96097 zip code speak English at home.
5.1% of residents speak Spanish at home (98% very well, 2% well).
0.7% of residents speak other Indo-European language at home (88% very well, 12% well).
0.1% of residents speak Asian or Pacific Island language at home (88% very well, 12% well).
0.3% of residents speak other language at home (100% very well).
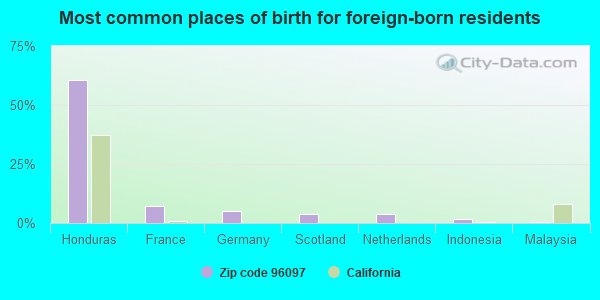
Foreign born population: 164 (1.6%) (65.0% of them are naturalized citizens)
This zip code:
1.6%
Whole state:
26.7%
61%Honduras
7%France
5%Germany
4%Scotland
4%Netherlands
2%Indonesia
1%Malaysia
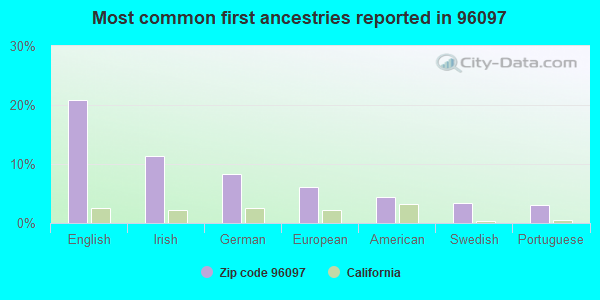
21%English
11%Irish
8%German
6%European
4%American
3%Swedish
3%Portuguese
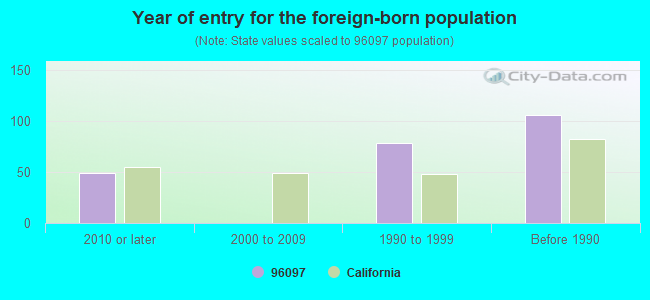
Year of entry for the foreign-born population
492010 or later
02000 to 2009
791990 to 1999
106Before 1990
Major facilities with environmental interests located in this zip code:
ELLIS BROOKS MOTORS INC (1113 S MAIN ST in YREKA, CA)
STATE MASTER (California - Hazardous Waste Tracking) - HAZARDOU WASTE PROGRAM Small Quantity Generators, between 100 kg and 1000 kg of hazardous waste/month (Resource Conservation and Recovery Act (tracking hazardous waste)) - notification Organizations: ELLIS C BROOKS JR (CONTACT/OWNER)
HI RIDGE LUMBER COMPANY (329 NORTH PHILLIPE LANE in YREKA, CA)
STATE MASTER (California - Hazardous Waste Tracking) - HAZARDOU WASTE PROGRAM Small Quantity Generators, between 100 kg and 1000 kg of hazardous waste/month (Resource Conservation and Recovery Act (tracking hazardous waste)) - notification Business NAICS classification: SAWMILLS.
EVERGREEN LANE ELEMENTARY (416 EVERGREEN LANE in YREKA, CA)
(National Center for Education Statistics) - STATE ID-6067136 Organizations: YREKA UNION ELEMENTARY (SCHOOL DISTRICT)
GOLD STREET ELEMENTARY (321 N. GOLD ST. in YREKA, CA)
(National Center for Education Statistics) - STATE ID-6050967 Organizations: YREKA UNION ELEMENTARY (SCHOOL DISTRICT)
J EVERITT BARR COURT (805 JUVENILE LANE in YREKA, CA)
(National Center for Education Statistics) - STATE ID-4730032 Organizations: SISKIYOU CO. OFFICE OF EDUCATION (SCHOOL DISTRICT)
JACKSON STREET ELEMENTARY (405 JACKSON ST. in YREKA, CA)
(National Center for Education Statistics) - STATE ID-6050975 Organizations: YREKA UNION ELEMENTARY (SCHOOL DISTRICT)
GEORGIA PACIFIC CORPORATION (OBERLIN RD in YREKA, CA)
Small Quantity Generators, between 100 kg and 1000 kg of hazardous waste/month (Resource Conservation and Recovery Act (tracking hazardous waste)) - notification
BAKER ENVIR CONSULTING ENGIN (550 MAIN ST in YREKA, CA)
National Pollutant Discharge Elimination System NON-MAJOR (Tracking pollutant discharge elimination systems) - permit
CALTRANS DIST 2 YERKA MTC STA (1745 MAIN ST in YREKA, CA)
Small Quantity Generators, between 100 kg and 1000 kg of hazardous waste/month (Resource Conservation and Recovery Act (tracking hazardous waste))
AMERICAN FABRIC CARE (490 SOUTH BROADWAY in YREKA, CA)
SUPERFUND (Superfund database)
ETNA (T42N, R9W, S28 MDM in YREKA, CA)
CRITERIA AND HAZARDOUS AIR POLLUTANT INVENTORY (Inventory of air pollution sources) Business SIC classification: REFUSE SYSTEMS Business NAICS classification: SOLID WASTE LANDFILL.
FORT JONES LANDFILL (T43N, R9W, S2 MDM in YREKA, CA)
CRITERIA AND HAZARDOUS AIR POLLUTANT INVENTORY (Inventory of air pollution sources) Business SIC classification: REFUSE SYSTEMS Business NAICS classification: SOLID WASTE LANDFILL.
GRENADA (T44N, R6W, S28 MDM in YREKA, CA)
CRITERIA AND HAZARDOUS AIR POLLUTANT INVENTORY (Inventory of air pollution sources) Business SIC classification: REFUSE SYSTEMS Business NAICS classification: SOLID WASTE LANDFILL.
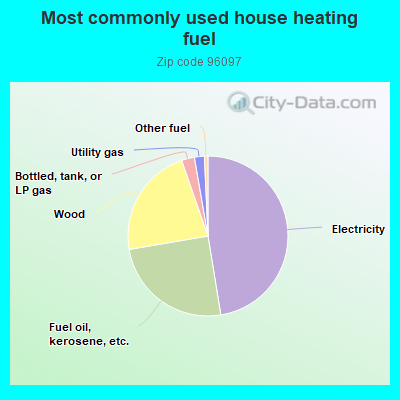
Housing units lacking complete plumbing facilities: 1.8% Housing units lacking complete kitchen facilities: 1.5%
47.3%Electricity
24.8%Fuel oil, kerosene, etc.
22.3%Wood
2.6%Bottled, tank, or LP gas
2.0%Utility gas
0.7%Other fuel
Population in 1990: 9,151. Population change in the 1990s: +377 (+4.1%).
Place of birth for U.S.-born residents:
This state: 7,441
Northeast: 308
Midwest: 317
South: 490
West: 1,224
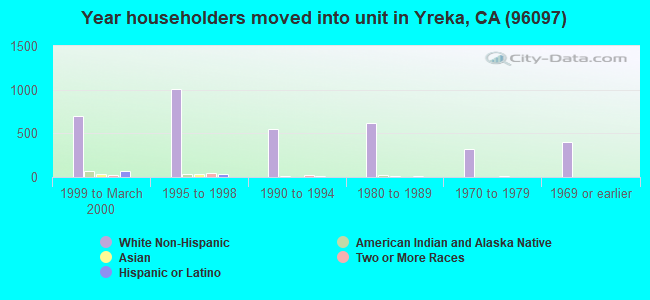
48% of the 96097 zip code residents lived in the same house 5 years ago. Out of people who lived in different houses, 52% lived in this county. Out of people who lived in different counties, 50% lived in California.
84% of the 96097 zip code residents lived in the same house 1 year ago. Out of people who lived in different houses, 51% moved from this county. Out of people who lived in different houses, 27% moved from different county within same state. Out of people who lived in different houses, 17% moved from different state. Out of people who lived in different houses, 3% moved from abroad.
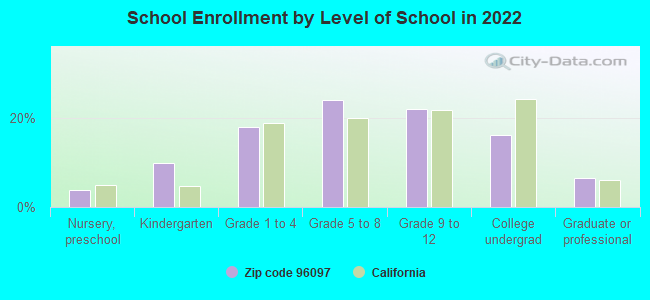
Private vs. public school enrollment:
Students in private schools in grades 1 to 8 (elementary and middle school): 167
Here:
14.7%
California:
10.5%
Students in private schools in grades 9 to 12 (high school): 40
Here:
6.7%
California:
8.5%
Students in private undergraduate colleges: 41
Here:
9.3%
California:
15.9%
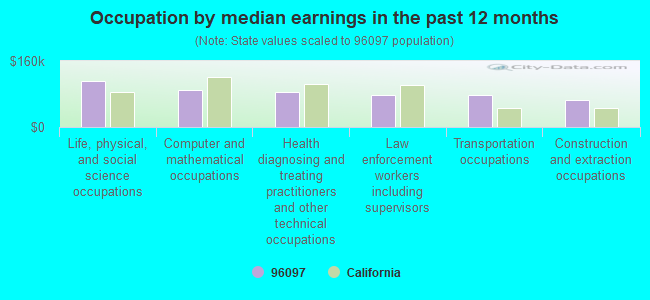
Occupation by median earnings in the past 12 months ($)
112,192Life, physical, and social science occupations
90,007Computer and mathematical occupations
84,019Health diagnosing and treating practitioners and other technical occupations
76,761Law enforcement workers including supervisors
76,446Transportation occupations
64,484Construction and extraction occupations
Companies with federal contracts located in this zip code (YREKA, CA):
CARLOS RODRIGUEZ (1235C PHOOK ST; small business) : $90,000 in 4 contractsfrom 2000 to 2001
$63,000 with Forest Service (disused code: now 12C2) for Forest Tree Planting Services. Signed on 2001-01-15. Completion date: 2001-02-15.
$9,000 with Forest Service (disused code: now 12C2) for Land Treatment Practices Services (plowing/clearing, etc.). Signed on 2000-08-15. Completion date: 2000-09-15.
$9,000, same as above.Signed on 2000-08-15. Completion date: 2000-09-15.
$9,000, same as above.Signed on 2000-06-15. Completion date: 2000-09-15.
RODRIGUEZ, REFORESTATION (3115 FAIRLAND RD; small business)
$36,000 with Forest Service (disused code: now 12C2) for Tree Thinning Services. Signed on 2000-06-15. Completion date: 2000-09-15.
LITTRELL PARTS INC (400 S MAIN ST; small business) : $32,621 in 2 contractsin 2004
$30,903 with Army for Oils and Greases: Cutting, Lubricating, and Hydraulic. Signed on 2004-01-23. Completion date: 2004-01-28.
$1,718, same as above.Signed on 2004-02-23. Completion date: 2004-01-28.
SISKIYOU, COUNTY OF (; small business)
$4,830 with Geological Survey for Water Quality Support Services. Signed on 2003-11-04. Completion date: 2004-09-30.
Top industries in this zip code by the number of employees in 2005:
Health Care and Social Assistance: General Medical and Surgical Hospitals (250-499 employees: 1 establishment)
Accommodation and Food Services: Hotels (except Casino Hotels) and Motels (50-99: 1, 20-49: 1, 10-19: 1, 5-9: 1, 1-4: 2)
Health Care and Social Assistance: Home Health Care Services (50-99: 1, 20-49: 1, 1-4: 1)
Health Care and Social Assistance: Offices of Physicians (except Mental Health Specialists) (20-49: 1, 10-19: 2, 5-9: 3, 1-4: 8)
Finance and Insurance: Commercial Banking (10-19: 5, 5-9: 3)
People in group quarters in 2010:
20 people in other noninstitutional facilities
13 people in correctional facilities intended for juveniles
8 people in emergency and transitional shelters (with sleeping facilities) for people experiencing homelessness
5 people in group homes intended for adults
People in group quarters in 2000:
91 people in local jails and other confinement facilities (including police lockups)
79 people in nursing homes
29 people in other noninstitutional group quarters
19 people in short-term care, detention or diagnostic centers for delinquent children
2 people in hospitals/wards and hospices for chronically ill
2 people in hospices or homes for chronically ill
Fatal accident statistics in 2014:
Fatal accident count: 3
Vehicles involved in fatal accidents: 3
Fatal accidents caused by drunken drivers: 2
Fatalities: 3
Persons involved in fatal accidents: 4
Pedestrians involved in fatal accidents: 0
Fatal accident statistics in 2012:
Fatal accident count: 2
Vehicles involved in fatal accidents: 4
Fatal accidents caused by drunken drivers: 0
Fatalities: 2
Persons involved in fatal accidents: 4
Pedestrians involved in fatal accidents: 0
2005 - 2018 National Fire Incident Reporting System (NFIRS) incidents
Based on the data from the years 2005 - 2018 the average number of fires per year is 31. The highest number of reported fire incidents - 59 took place in 2007, and the least - 9 in 2006. The data has a decreasing trend.
When looking into fire subcategories, the most reports belonged to: Outside Fires (73.7%), and Structure Fires (11.0%).
Fire incident types reported to NFIRS in Zip Code 96097


 Nearest zip codes: 96038, 96044, 96050, 96064, 96034, 96032.


 Based on the data from the years 2005 - 2018 the average number of fires per year is 31. The highest number of reported fire incidents - 59 took place in 2007, and the least - 9 in 2006. The data has a decreasing trend.
 When looking into fire subcategories, the most reports belonged to: Outside Fires (73.7%), and Structure Fires (11.0%).