Estimated zip code population in 2022: 4,522 Zip code population in 2010: 5,555 Zip code population in 2000: 5,063
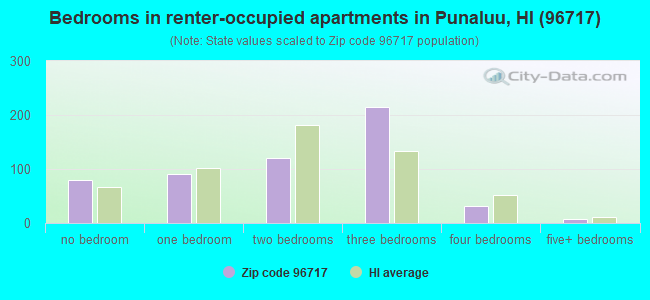
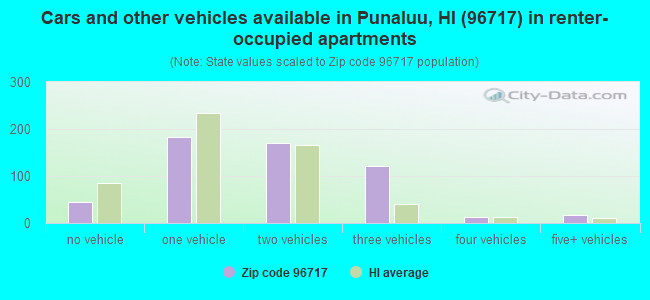
Houses and condos: 1,719 Renter-occupied apartments: 556
% of renters here:
46%
State:
37%
March 2022 cost of living index in zip code 96717: 135.6 (high, U.S. average is 100)
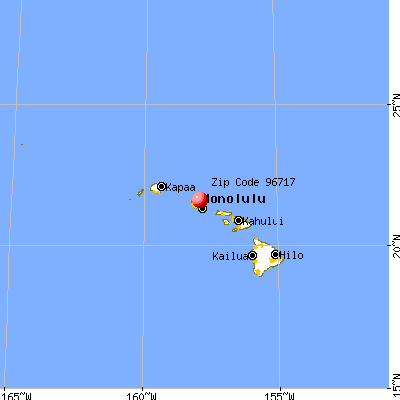
Land area: 24.9 sq. mi. Water area: 2.3 sq. mi.
Population density: 182 people per square mile
(very low).
OSM Map
General Map
Google Map
MSN Map
OSM Map
General Map
Google Map
MSN Map
OSM Map
General Map
Google Map
MSN Map
OSM Map
General Map
Google Map
MSN Map
Please wait while loading the map...
Real estate property taxes paid for housing units in 2022:
This zip code:
0.3% ($2,401)
Hawaii:
0.3% ($2,092)
Median real estate property taxes paid for housing units with mortgages in 2022: $2,564 (0.3%) Median real estate property taxes paid for housing units with no mortgage in 2022: $1,991 (0.3%)
Business Search- 14 Million verified businesses
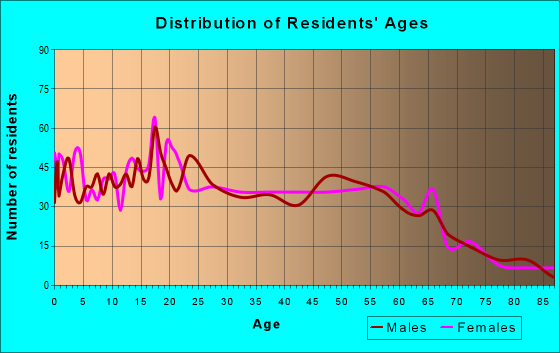
Males: 2,517
(55.7%)
Females: 2,003
(44.3%)
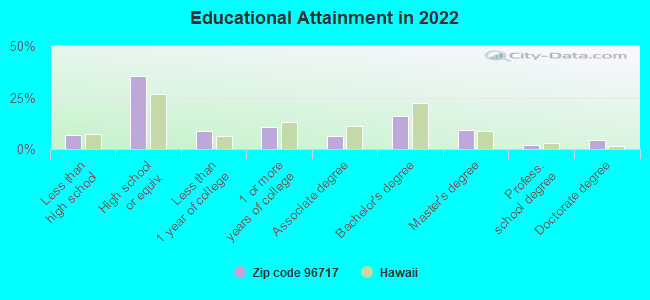
For population 25 years and over in 96717:
High school or higher: 93.0%
Bachelor's degree or higher: 31.8%
Graduate or professional degree: 15.7%
Unemployed: 4.5%
Mean travel time to work (commute): 36.9 minutes
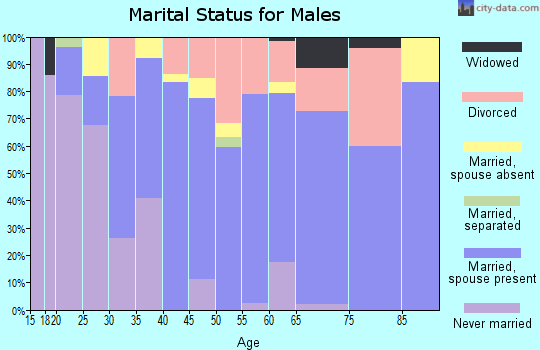
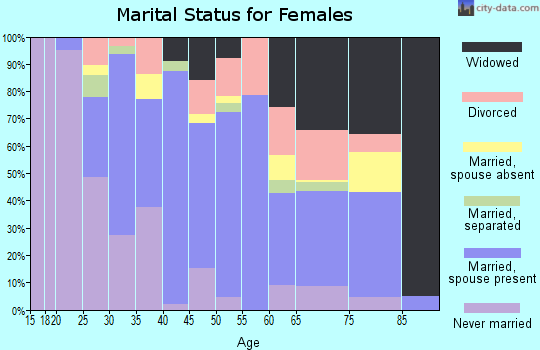
For population 15 years and over in 96717:
Never married: 38.2%
Now married: 47.5%
Separated: 1.6%
Widowed: 5.5%
Divorced: 7.1%
Zip code 96717 compared to state average:
Black race population percentage below state average.
Median age below state average.
Foreign-born population percentage below state average.
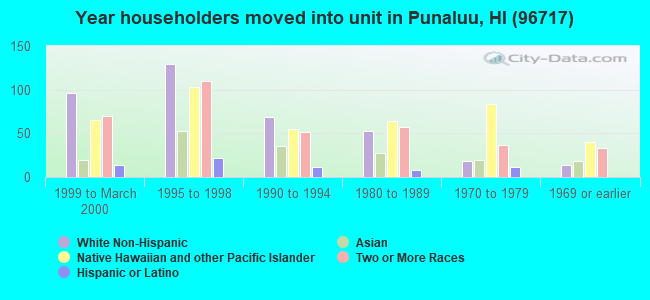
Length of stay since moving in below state average.
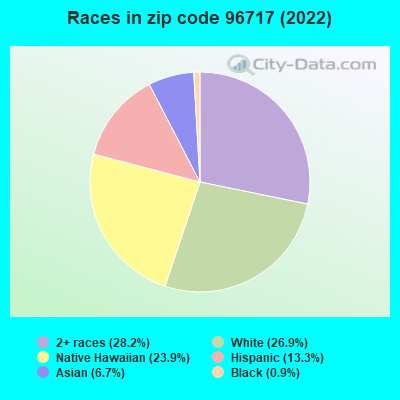
1,27428.2%Two or more races
1,21326.9%White
1,08123.9%Native Hawaiian and Other Pacific Islander
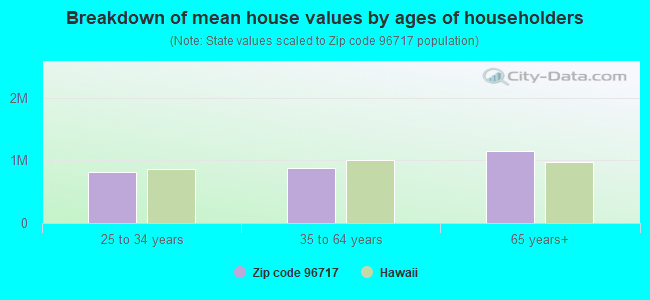
Estimated median house/condo value in 2022: $863,850
96717:
$863,850
Hawaii:
$820,100
According to our research of Hawaii and other state lists, there were 9 registered sex offenders living in 96717 zip code as of April 26, 2024. The ratio of all residents to sex offenders in zip code 96717 is 552 to 1. The ratio of registered sex offenders to all residents in this zip code is near the state average.
Median resident age:
This zip code:
34.6 years
Hawaii median age:
40.8 years
Average household size:
This zip code:
3.7 people
Hawaii:
2.8 people
Averages for the 2020 tax year for zip code 96717, filed in 2021:
Average Adjusted Gross Income (AGI) in 2020: $58,737 (Individual Income Tax Returns)
Here:
$58,737
State:
$72,945
Salary/wage: $50,782 (reported on 83.1% of returns)
Here:
$50,782
State:
$57,697
(% of AGI for various income ranges: 1128.6% for AGIs below $25k, 3578.6% for AGIs $25k-50k, 6731.6% for AGIs $50k-75k, 10020.8% for AGIs $75k-100k, 17517.5% for AGIs $100k-200k)
Taxable interest for individuals: $558 (reported on 21.2% of returns)
This zip code:
$558
Hawaii:
$1,356
(% of AGI for various income ranges: 2.7% for AGIs below $25k, 9.7% for AGIs $25k-50k, 17.4% for AGIs $50k-75k, 16.7% for AGIs $75k-100k, 72.5% for AGIs $100k-200k)
Ordinary dividends: $3,188 (reported on 8.5% of returns)
Here:
$3,188
State:
$6,387
(% of AGI for various income ranges: 2.3% for AGIs below $25k, 11.9% for AGIs $25k-50k, 20.5% for AGIs $50k-75k, 61.7% for AGIs $75k-100k, 214.4% for AGIs $100k-200k)
Net capital gain/loss in AGI: +$12,133 (reported on 9.5% of returns)
Here:
+$12,133
State:
+$23,240
(% of AGI for various income ranges: 30.3% for AGIs $25k-50k, 57.4% for AGIs $50k-75k, 120.0% for AGIs $75k-100k, 1143.1% for AGIs $100k-200k)
Profit/loss from business: +$8,660 (reported on 15.9% of returns)
Here:
+$8,660
State:
+$15,381
(% of AGI for various income ranges: 119.5% for AGIs below $25k, 117.8% for AGIs $25k-50k, 54.7% for AGIs $50k-75k, 119.2% for AGIs $75k-100k, 868.1% for AGIs $100k-200k)
Taxable individual retirement arrangement distribution: $17,525 (reported on 4.2% of returns)
96717:
$17,525
Hawaii:
$19,883
(% of AGI for various income ranges: 433.2% for AGIs $50k-75k, 361.9% for AGIs $100k-200k)
Total itemized deductions: $33,308 (reported on 12.7% of returns)
Here:
$33,308
State:
$33,097
(% of AGI for various income ranges: 234.6% for AGIs $25k-50k, 574.2% for AGIs $50k-75k, 631.7% for AGIs $75k-100k, 2465.6% for AGIs $100k-200k)
Charity contributions: $10,335 (reported on 10.6% of returns)
Here:
$10,335
State:
$7,368
(% of AGI for various income ranges: 30.2% for AGIs below $25k, 107.9% for AGIs $50k-75k, 149.2% for AGIs $75k-100k, 656.9% for AGIs $100k-200k)
Taxes paid: $7,829 (reported on 12.7% of returns)
96717:
$7,829
State:
$7,601
(% of AGI for various income ranges: 44.9% for AGIs $25k-50k, 120.0% for AGIs $50k-75k, 162.5% for AGIs $75k-100k, 623.8% for AGIs $100k-200k)
Earned income credit: $2,451 (reported on 18.5% of returns)
Here:
$2,451
State:
$2,008
(% of AGI for various income ranges: 123.2% for AGIs below $25k, 85.4% for AGIs $25k-50k)
Percentage of individuals using paid preparers for their 2020 taxes: 89.9%
Here:
90%
State:
89%
(% for various income ranges: 90.3% for AGIs below $25k, 89.8% for AGIs $25k-50k, 88.9% for AGIs $50k-75k, 89.5% for AGIs $75k-100k, 92.6% for AGIs $100k-200k, 80.0% for AGIs over 200k)
Averages for the 2012 tax year for zip code 96717, filed in 2013:
Average Adjusted Gross Income (AGI) in 2012: $43,663 (Individual Income Tax Returns)
Here:
$43,663
State:
$57,303
Salary/wage: $39,274 (reported on 86.2% of returns)
Here:
$39,274
State:
$47,500
(% of AGI for various income ranges: 81.0% for AGIs below $25k, 83.2% for AGIs $25k-50k, 75.4% for AGIs $50k-75k, 83.5% for AGIs $75k-100k, 91.9% for AGIs $100k-200k)
Taxable interest for individuals: $388 (reported on 21.2% of returns)
This zip code:
$388
Hawaii:
$1,212
(% of AGI for various income ranges: 0.2% for AGIs below $25k, 0.2% for AGIs $25k-50k, 0.1% for AGIs $50k-75k, 0.2% for AGIs $75k-100k, 0.3% for AGIs $100k-200k)
Ordinary dividends: $3,312 (reported on 8.5% of returns)
Here:
$3,312
State:
$5,430
(% of AGI for various income ranges: 0.6% for AGIs below $25k, 0.2% for AGIs $25k-50k, 0.3% for AGIs $50k-75k, 0.8% for AGIs $75k-100k, 1.5% for AGIs $100k-200k)
Net capital gain/loss in AGI: +$3,036 (reported on 5.8% of returns)
Here:
+$3,036
State:
+$13,910
(% of AGI for various income ranges: 2.0% for AGIs $100k-200k)
Profit/loss from business: +$10,774 (reported on 14.3% of returns)
Here:
+$10,774
State:
+$15,881
(% of AGI for various income ranges: 5.8% for AGIs below $25k, 2.4% for AGIs $25k-50k, 2.8% for AGIs $50k-75k, 3.4% for AGIs $75k-100k, 5.2% for AGIs $100k-200k)
Taxable individual retirement arrangement distribution: $14,511 (reported on 4.8% of returns)
96717:
$14,511
Hawaii:
$15,720
(% of AGI for various income ranges: 2.0% for AGIs $25k-50k, 2.5% for AGIs $50k-75k, 2.8% for AGIs $100k-200k)
Total itemized deductions: $24,757 (30% of AGI, reported on 28.0% of returns)
Here:
$24,757
State:
$25,496
Here:
30.2% of AGI
State:
23.1% of AGI
(% of AGI for various income ranges: 6.8% for AGIs below $25k, 11.0% for AGIs $25k-50k, 16.8% for AGIs $50k-75k, 21.4% for AGIs $75k-100k, 25.4% for AGIs $100k-200k)
Charity contributions: $5,169 (reported on 23.8% of returns)
Here:
$5,169
State:
$3,353
(% of AGI for various income ranges: 0.8% for AGIs below $25k, 1.7% for AGIs $25k-50k, 3.5% for AGIs $50k-75k, 3.9% for AGIs $75k-100k, 4.4% for AGIs $100k-200k)
Taxes paid: $5,791 (reported on 28.0% of returns)
96717:
$5,791
State:
$8,029
(% of AGI for various income ranges: 0.9% for AGIs below $25k, 2.3% for AGIs $25k-50k, 3.1% for AGIs $50k-75k, 4.8% for AGIs $75k-100k, 7.3% for AGIs $100k-200k)
Earned income credit: $2,441 (reported on 25.9% of returns)
Here:
$2,441
State:
$2,113
(% of AGI for various income ranges: 9.0% for AGIs below $25k, 1.8% for AGIs $25k-50k)
Percentage of individuals using paid preparers for their 2012 taxes: 43.4%
Here:
43%
State:
53%
(% for various income ranges: 38.0% for AGIs below $25k, 43.1% for AGIs $25k-50k, 44.0% for AGIs $50k-75k, 50.0% for AGIs $75k-100k, 68.8% for AGIs $100k-200k)
Averages for the 2004 tax year for zip code 96717, filed in 2005:
Average Adjusted Gross Income (AGI) in 2004: $33,509 (Individual Income Tax Returns)
Here:
$33,509
State:
$46,564
Salary/wage: $30,561 (reported on 87.0% of returns)
Here:
$30,561
State:
$39,831
(% of AGI for various income ranges: 115.7% for AGIs below $10k, 84.6% for AGIs $10k-25k, 83.3% for AGIs $25k-50k, 84.7% for AGIs $50k-75k, 86.3% for AGIs $75k-100k, 52.6% for AGIs over 100k)
Taxable interest for individuals: $857 (reported on 33.2% of returns)
This zip code:
$857
Hawaii:
$1,263
(% of AGI for various income ranges: 1.1% for AGIs below $10k, 0.8% for AGIs $10k-25k, 0.8% for AGIs $25k-50k, 0.9% for AGIs $50k-75k, 0.3% for AGIs $75k-100k, 1.2% for AGIs over 100k)
Taxable dividends: $2,283 (reported on 9.9% of returns)
Here:
$2,283
State:
$3,145
(% of AGI for various income ranges: 1.1% for AGIs below $10k, 0.5% for AGIs $10k-25k, 0.1% for AGIs $25k-50k, 0.6% for AGIs $50k-75k, 0.3% for AGIs $75k-100k, 1.8% for AGIs over 100k)
Net capital gain/loss: +$15,455 (reported on 8.2% of returns)
Here:
+$15,455
State:
+$16,059
(% of AGI for various income ranges: -1.6% for AGIs below $10k, -0.4% for AGIs $10k-25k, 0.1% for AGIs $25k-50k, -0.1% for AGIs $50k-75k, 0.6% for AGIs $75k-100k, 19.5% for AGIs over 100k)
Profit/loss from business: +$9,038 (reported on 12.1% of returns)
Here:
+$9,038
State:
+$13,847
(% of AGI for various income ranges: 9.8% for AGIs below $10k, 3.5% for AGIs $10k-25k, 2.3% for AGIs $25k-50k, 0.6% for AGIs $50k-75k, 2.0% for AGIs $75k-100k, 7.6% for AGIs over 100k)
IRA payment deduction: $1,692 (reported on 0.7% of returns)
96717:
$1,692
Hawaii:
$2,867
Total itemized deductions: $19,513 (30% of AGI, reported on 28.6% of returns)
Here:
$19,513
State:
$20,647
Here:
30.3% of AGI
State:
23.5% of AGI
(% of AGI for various income ranges: 16.5% for AGIs below $10k, 9.8% for AGIs $10k-25k, 14.5% for AGIs $25k-50k, 20.3% for AGIs $50k-75k, 19.9% for AGIs $75k-100k, 16.9% for AGIs over 100k)
Charity contributions deductions: $4,038 (6% of AGI, reported on 25.4% of returns)
Here:
$4,038
State:
$2,966
Here:
6.1% of AGI
State:
3.3% of AGI
(% of AGI for various income ranges: 1.3% for AGIs below $10k, 1.3% for AGIs $10k-25k, 2.8% for AGIs $25k-50k, 3.9% for AGIs $50k-75k, 3.8% for AGIs $75k-100k, 3.2% for AGIs over 100k)
Total tax: $4,188 (reported on 62.5% of returns)
96717:
$4,188
State:
$7,224
(% of AGI for various income ranges: 2.3% for AGIs below $10k, 3.6% for AGIs $10k-25k, 5.8% for AGIs $25k-50k, 7.2% for AGIs $50k-75k, 8.0% for AGIs $75k-100k, 14.8% for AGIs over 100k)
Earned income credit: $1,831 (reported on 22.9% of returns)
Here:
$1,831
State:
$1,536
Percentage of individuals using paid preparers for their 2004 taxes: 46.8%
Here:
47%
State:
58%
(% for various income ranges: 39.5% for AGIs below $10k, 49.5% for AGIs $10k-25k, 46.8% for AGIs $25k-50k, 50.9% for AGIs $50k-75k, 48.7% for AGIs $75k-100k, 61.1% for AGIs over 100k)
Likely homosexual households (counted as self-reported same-sex unmarried-partner households)
Lesbian couples: 0.0% of all households
Gay men: 0.6% of all households
Household received Food Stamps/SNAP in the past 12 months: 195 Household did not receive Food Stamps/SNAP in the past 12 months: 1,016
Women who had a birth in the past 12 months: 42 (36 now married, 5 unmarried) Women who did not have a birth in the past 12 months: 845 (397 now married, 446 unmarried)
Housing units in zip code 96717 with a mortgage: 446 (49 second mortgage, 5 home equity loan, 41 both second mortgage and home equity loan) Median monthly owner costs for units with a mortgage: $2,891 Median monthly owner costs for units without a mortgage: $587
Residents with income below the poverty level in 2022:
This zip code:
10.3%
Whole state:
10.2%
Residents with income below 50% of the poverty level in 2022:
This zip code:
7.0%
Whole state:
4.7%
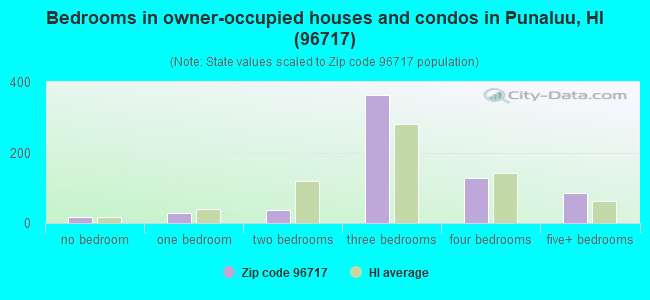
Median number of rooms in houses and condos:
Here:
5.5
State:
5.5
Median number of rooms in apartments:
Here:
4.5
State:
3.9
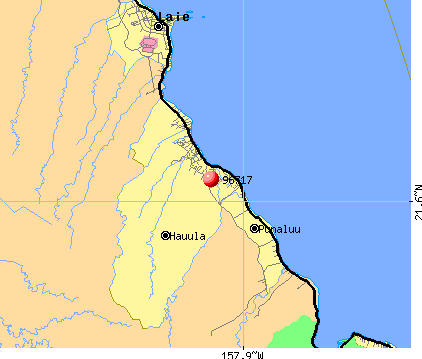
Notable locations in this zip code not listed on our city pages
Notable locations in zip code 96717: Makaiwa (A), Kapa‘ele‘ele Boat Ramp (B), Honolulu Fire Department Station 15 Hauula (C). Display/hide their locations on the map
Churches in zip code 96717 include: Hauula Congregational Church (A), Hauula Seventh-Day Adventist Church (B), North Windward Baptist Chapel (C). Display/hide their locations on the map
Streams, rivers, and creeks: Maipuna Stream (A), Maakua Stream (B), Punalu‘u Stream (C), Kawa Stream (D), Kaluanui Stream (E), Kaipapa‘u Stream (F), Kahana Stream (G). Display/hide their locations on the map
Parks in zip code 96717 include: Punalu‘u Beach Park (1), Hau‘ula Community Park (2), Kahana Valley State Park (3), Kahana Bay Beach Park (4), ‘Aukai Beach Park (5). Display/hide their locations on the map
Beaches: Kaipapa‘u Beach (A), Hau‘ula Beach Park (B), Makao Beach (C), Kaluanui Beach (D), Kapalaoa Beach (E), Kapaka Beach (F). Display/hide their locations on the map
814 married couples with children.
148 single-parent households (63 men, 85 women).
77.9% of residents of 96717 zip code speak English at home.
0.4% of residents speak Spanish at home (67% very well, 33% well).
4.5% of residents speak other Indo-European language at home (89% very well, 11% not well).
14.4% of residents speak Asian or Pacific Island language at home (78% very well, 17% well, 3% not well, 1% not at all).
3.9% of residents speak other language at home (91% very well, 9% well).
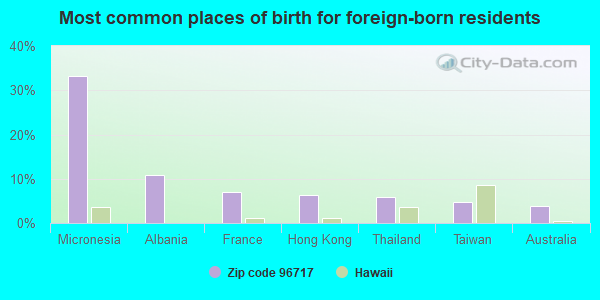
Foreign born population: 449 (9.9%) (70.8% of them are naturalized citizens)
This zip code:
9.9%
Whole state:
17.1%
33%Micronesia
11%Albania
7%France
6%Hong Kong
6%Thailand
5%Taiwan
4%Australia
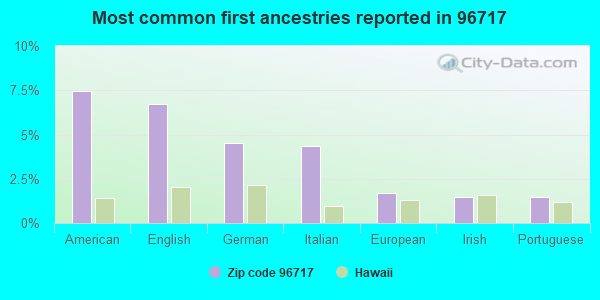
7%American
7%English
5%German
4%Italian
2%European
1%Irish
1%Portuguese
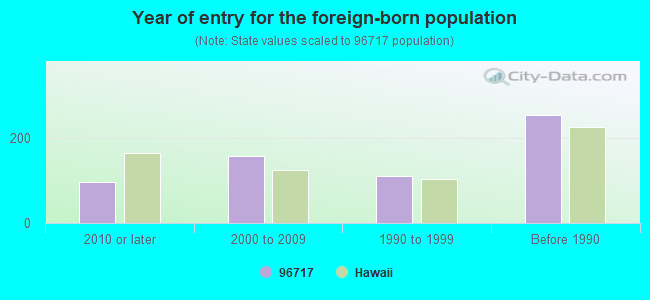
Year of entry for the foreign-born population
952010 or later
1562000 to 2009
1111990 to 1999
253Before 1990
Facilities with environmental interests located in this zip code:
MAKIKI ELECTRONICS (54-122 KAM HWY in HAUULA, HI)
COMPLIANCE ACTIVITY (Tracking inspections of insecticide, fungicide, and rodenticide, and toxic substances) STATE MASTER (New Jersey environmental info) - NJEMS-001214, PESTICIDES - MANUFACTURE
HAUULA ELEMENTARY SCHOOL (54-046 KAMEHAMEHA HIGHWAY in HAUULA, HI)
(Geographic Names Information System) (National Center for Education Statistics) - STATE ID-4-303 Organizations: HAWAII DEPT OF EDUCATION (SCHOOL DISTRICT)
PAYLESS DRUG (54 316 KAMEHAMEHA HWY in HAUULA, HI)
National Pollutant Discharge Elimination System NON-MAJOR (Tracking pollutant discharge elimination systems) - permit
KAHANA SUNSET CONDOMINUMS (KAHANA BAY in KAHANA, HI)
National Pollutant Discharge Elimination System NON-MAJOR (Tracking pollutant discharge elimination systems) - permit
KALIHI-PALAMA BUS FACILITY (811 MIDDLE ST in KALIHI, HI)
National Pollutant Discharge Elimination System NON-MAJOR (Tracking pollutant discharge elimination systems) - permit Business SIC classification: NONCLASSIFIABLE ESTABLISHMENTS
KAMEHAMEHA HIGHWAY 36 WATER (KAMEHAMEHA HWY in PUNALUU, HI)
National Pollutant Discharge Elimination System NON-MAJOR (Tracking pollutant discharge elimination systems) - permit Business SIC classification: NONCLASSIFIABLE ESTABLISHMENTS
KAMEHAMEHA HIGHWAY, REPLACE (NEAR MP 24.4 ALONG ROUTE 83 in HAUULA, HI)
National Pollutant Discharge Elimination System NON-MAJOR (Tracking pollutant discharge elimination systems) - permit Business SIC classification: NONCLASSIFIABLE ESTABLISHMENTS
KOKOLOLIO STREAM BRIDGE REPL (WAIKOLOA RD in HAUULA, HI)
National Pollutant Discharge Elimination System NON-MAJOR (Tracking pollutant discharge elimination systems) - permit Business SIC classification: NONCLASSIFIABLE ESTABLISHMENTS Alternative names: WAIKOLOA TANKS, 300-2 & 300-3
STODDARD FARM GRADING (HAUULA (PUNALUU) in PUNALUU, HI)
National Pollutant Discharge Elimination System NON-MAJOR (Tracking pollutant discharge elimination systems) - permit Business SIC classification: NONCLASSIFIABLE ESTABLISHMENTS
BIO-PLANET PRODUCTS (54-122 KAMEHAMEHA HWY in HAUULA, HI)
COMPLIANCE ACTIVITY (Tracking inspections of insecticide, fungicide, and rodenticide, and toxic substances)
ENFORCEMENT/COMPLIANCE ACTIVITY (Integrated Compliance Information System)
MAKIKI (54 122 KAMEHAMEHA HWY in HAUULA, HI)
COMPLIANCE ACTIVITY (Tracking inspections of insecticide, fungicide, and rodenticide, and toxic substances)
Housing units lacking complete plumbing facilities: 3.3% Housing units lacking complete kitchen facilities: 6.6%
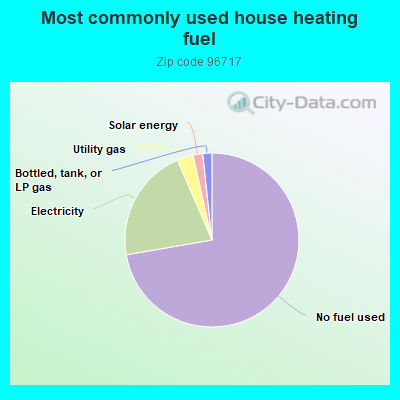
72.5%No fuel used
21.3%Electricity
3.0%Utility gas
1.8%Solar energy
1.7%Bottled, tank, or LP gas
Population in 1990: 3,477. Population change in the 1990s: +1,586 (+45.6%).
Place of birth for U.S.-born residents:
This state: 2,499
Northeast: 109
Midwest: 216
South: 368
West: 735
58% of the 96717 zip code residents lived in the same house 5 years ago. Out of people who lived in different houses, 83% lived in this county. Out of people who lived in different counties, 50% lived in Hawaii.
79% of the 96717 zip code residents lived in the same house 1 year ago. Out of people who lived in different houses, 82% moved from this county. Out of people who lived in different houses, 12% moved from different state. Out of people who lived in different houses, 2% moved from abroad.
Private vs. public school enrollment:
Students in private schools in grades 1 to 8 (elementary and middle school): 97
Here:
17.0%
Hawaii:
21.6%
Students in private schools in grades 9 to 12 (high school): 26
Here:
9.6%
Hawaii:
21.5%
Students in private undergraduate colleges: 85
Here:
46.3%
Hawaii:
23.3%
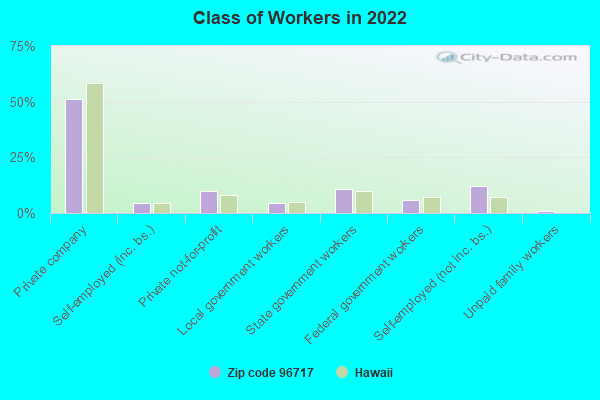
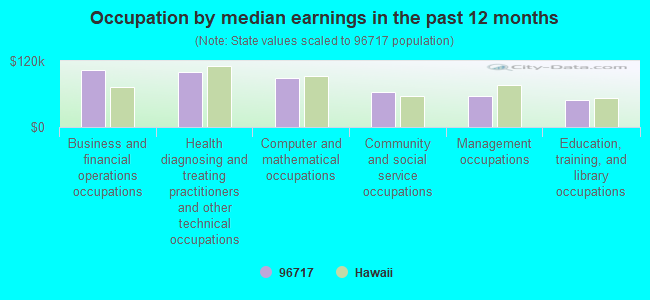
Occupation by median earnings in the past 12 months ($)
103,828Business and financial operations occupations
100,079Health diagnosing and treating practitioners and other technical occupations
89,456Computer and mathematical occupations
64,151Community and social service occupations
55,884Management occupations
48,436Education, training, and library occupations
Companies with federal contracts located in this zip code:
JEFFREY SIEG (54-159 HANAIMOA ST in HAUULA, HI; small business)
$15,682 with Navy for Landscaping/Groundskeeping Services. Signed on 2003-04-18. Completion date: 2003-04-18.
Top industries in this zip code by the number of employees in 2005:
Health Care and Social Assistance: Residential Mental Health and Substance Abuse Facilities (20-49 employees: 1 establishment)
Health Care and Social Assistance: Child and Youth Services (10-19: 1)
Health Care and Social Assistance: Child Day Care Services (10-19: 1)
Accommodation and Food Services: Drinking Places (Alcoholic Beverages) (10-19: 1)
Construction: All Other Specialty Trade Contractors (10-19: 1)
Other Services (except Public Administration): Other Similar Organizations (except Business, Professional, Labor, and Political Organizations) (5-9: 1, 1-4: 1)
Administrative and Support and Waste Management and Remediation Services: Landscaping Services (5-9: 1)
Other Services (except Public Administration): Voluntary Health Organizations (5-9: 1)
People in group quarters in 2010:
295 people in other noninstitutional facilities
54 people in nursing facilities/skilled-nursing facilities
People in group quarters in 2000:
71 people in other noninstitutional group quarters
Fatal accident statistics in 2012:
Fatal accident count: 2
Vehicles involved in fatal accidents: 2
Fatal accidents caused by drunken drivers: 0
Fatalities: 2
Persons involved in fatal accidents: 3
Pedestrians involved in fatal accidents: 1
Fatal accident statistics in 2011:
Fatal accident count: 1
Vehicles involved in fatal accidents: 1
Fatal accidents caused by drunken drivers: 0
Fatalities: 1
Persons involved in fatal accidents: 2
Pedestrians involved in fatal accidents: 0
Home Mortgage Disclosure Act Aggregated Statistics For Year 2009 (Based on 2 full and 2 partial tracts)
A) FHA, FSA/RHS & VA Home Purchase Loans
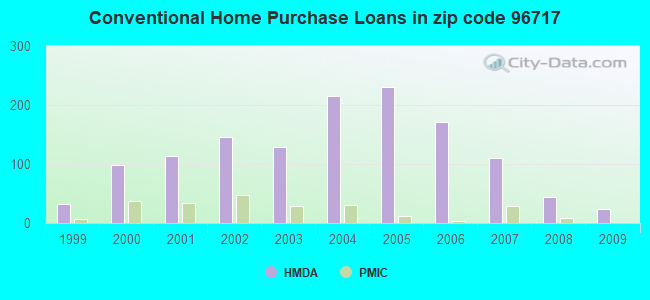
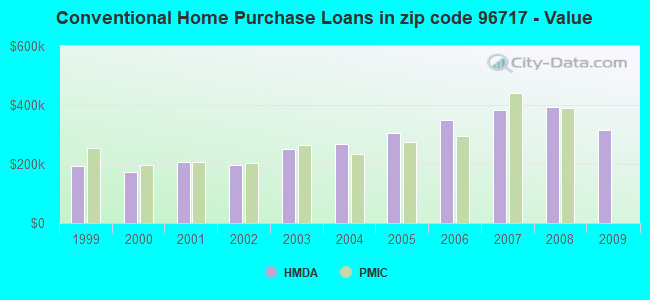
B) Conventional Home Purchase Loans
C) Refinancings
D) Home Improvement Loans
F) Non-occupant Loans on < 5 Family Dwellings (A B C & D)
Number
Average Value
Number
Average Value
Number
Average Value
Number
Average Value
Number
Average Value
LOANS ORIGINATED
22
$492,813
24
$315,905
202
$370,789
17
$227,165
55
$333,742
APPLICATIONS APPROVED, NOT ACCEPTED
0
$0
3
$498,863
19
$380,915
8
$435,542
3
$483,403
APPLICATIONS DENIED
8
$553,391
10
$322,078
102
$418,640
9
$214,954
17
$313,165
APPLICATIONS WITHDRAWN
5
$352,206
0
$0
57
$445,228
0
$0
16
$451,936
FILES CLOSED FOR INCOMPLETENESS
0
$0
0
$0
4
$287,742
0
$0
2
$188,605
Aggregated Statistics For Year 2008 (Based on 2 full and 2 partial tracts)
A) FHA, FSA/RHS & VA Home Purchase Loans
B) Conventional Home Purchase Loans
C) Refinancings
D) Home Improvement Loans
F) Non-occupant Loans on < 5 Family Dwellings (A B C & D)
Number
Average Value
Number
Average Value
Number
Average Value
Number
Average Value
Number
Average Value
LOANS ORIGINATED
5
$616,620
44
$394,253
130
$341,996
26
$278,730
44
$346,733
APPLICATIONS APPROVED, NOT ACCEPTED
0
$0
6
$419,120
24
$398,317
3
$110,750
3
$316,140
APPLICATIONS DENIED
6
$321,927
25
$529,954
124
$372,455
23
$438,370
25
$365,160
APPLICATIONS WITHDRAWN
4
$324,012
16
$491,884
50
$410,078
6
$199,543
15
$438,720
FILES CLOSED FOR INCOMPLETENESS
0
$0
0
$0
4
$413,478
0
$0
0
$0
Aggregated Statistics For Year 2007 (Based on 2 full and 2 partial tracts)
A) FHA, FSA/RHS & VA Home Purchase Loans
B) Conventional Home Purchase Loans
C) Refinancings
D) Home Improvement Loans
F) Non-occupant Loans on < 5 Family Dwellings (A B C & D)
Number
Average Value
Number
Average Value
Number
Average Value
Number
Average Value
Number
Average Value
LOANS ORIGINATED
0
$0
111
$383,082
266
$346,780
34
$306,760
105
$292,323
APPLICATIONS APPROVED, NOT ACCEPTED
0
$0
16
$404,878
78
$408,778
9
$301,541
22
$418,796
APPLICATIONS DENIED
2
$388,815
32
$410,890
228
$432,592
20
$132,548
47
$340,343
APPLICATIONS WITHDRAWN
2
$493,270
26
$560,053
66
$451,648
9
$301,437
25
$292,658
FILES CLOSED FOR INCOMPLETENESS
0
$0
3
$773,283
17
$419,531
2
$67,705
6
$521,543
Aggregated Statistics For Year 2006 (Based on 2 full and 2 partial tracts)
A) FHA, FSA/RHS & VA Home Purchase Loans
B) Conventional Home Purchase Loans
C) Refinancings
D) Home Improvement Loans
F) Non-occupant Loans on < 5 Family Dwellings (A B C & D)
G) Loans On Manufactured Home Dwelling (A B C & D)
Number
Average Value
Number
Average Value
Number
Average Value
Number
Average Value
Number
Average Value
Number
Average Value
LOANS ORIGINATED
2
$237,930
171
$348,158
338
$328,842
69
$229,207
138
$312,465
0
$0
APPLICATIONS APPROVED, NOT ACCEPTED
0
$0
24
$303,825
47
$318,176
5
$92,256
18
$225,170
2
$69,640
APPLICATIONS DENIED
0
$0
60
$418,056
177
$374,441
41
$294,796
42
$319,378
0
$0
APPLICATIONS WITHDRAWN
0
$0
56
$353,365
121
$349,604
10
$227,518
20
$299,146
0
$0
FILES CLOSED FOR INCOMPLETENESS
0
$0
9
$200,380
33
$352,080
2
$259,210
13
$375,355
0
$0
Aggregated Statistics For Year 2005 (Based on 2 full and 2 partial tracts)
A) FHA, FSA/RHS & VA Home Purchase Loans
B) Conventional Home Purchase Loans
C) Refinancings
D) Home Improvement Loans
F) Non-occupant Loans on < 5 Family Dwellings (A B C & D)
Number
Average Value
Number
Average Value
Number
Average Value
Number
Average Value
Number
Average Value
LOANS ORIGINATED
2
$257,275
230
$305,381
315
$332,562
40
$277,359
135
$356,148
APPLICATIONS APPROVED, NOT ACCEPTED
0
$0
46
$256,585
52
$275,540
17
$147,887
19
$204,912
APPLICATIONS DENIED
0
$0
76
$290,366
138
$286,864
36
$178,972
52
$315,209
APPLICATIONS WITHDRAWN
0
$0
54
$332,879
147
$296,184
37
$255,272
28
$360,850
FILES CLOSED FOR INCOMPLETENESS
0
$0
5
$459,348
24
$343,700
2
$608,050
5
$328,682
Aggregated Statistics For Year 2004 (Based on 2 full and 2 partial tracts)
A) FHA, FSA/RHS & VA Home Purchase Loans
B) Conventional Home Purchase Loans
C) Refinancings
D) Home Improvement Loans
F) Non-occupant Loans on < 5 Family Dwellings (A B C & D)
Number
Average Value
Number
Average Value
Number
Average Value
Number
Average Value
Number
Average Value
LOANS ORIGINATED
4
$326,912
216
$268,551
297
$257,816
32
$238,148
90
$276,781
APPLICATIONS APPROVED, NOT ACCEPTED
0
$0
53
$294,124
61
$270,642
4
$188,142
16
$337,982
APPLICATIONS DENIED
2
$217,620
52
$276,294
93
$206,863
19
$115,363
27
$265,286
APPLICATIONS WITHDRAWN
0
$0
50
$288,002
164
$258,633
14
$181,216
26
$236,743
FILES CLOSED FOR INCOMPLETENESS
0
$0
7
$261,946
30
$220,746
2
$178,930
2
$215,730
Aggregated Statistics For Year 2003 (Based on 2 full and 2 partial tracts)
A) FHA, FSA/RHS & VA Home Purchase Loans
B) Conventional Home Purchase Loans
C) Refinancings
D) Home Improvement Loans
F) Non-occupant Loans on < 5 Family Dwellings (A B C & D)
Number
Average Value
Number
Average Value
Number
Average Value
Number
Average Value
Number
Average Value
LOANS ORIGINATED
10
$207,989
128
$250,861
474
$216,262
7
$56,831
98
$213,992
APPLICATIONS APPROVED, NOT ACCEPTED
2
$314,340
18
$184,010
68
$224,092
0
$0
15
$145,798
APPLICATIONS DENIED
0
$0
14
$286,236
115
$222,494
0
$0
38
$190,838
APPLICATIONS WITHDRAWN
2
$190,540
32
$264,751
120
$224,855
0
$0
28
$142,084
FILES CLOSED FOR INCOMPLETENESS
0
$0
3
$443,730
24
$229,420
0
$0
4
$169,260
Aggregated Statistics For Year 2002 (Based on 2 full and 2 partial tracts)
A) FHA, FSA/RHS & VA Home Purchase Loans
B) Conventional Home Purchase Loans
C) Refinancings
D) Home Improvement Loans
F) Non-occupant Loans on < 5 Family Dwellings (A B C & D)
Number
Average Value
Number
Average Value
Number
Average Value
Number
Average Value
Number
Average Value
LOANS ORIGINATED
6
$174,453
146
$195,780
280
$213,768
15
$81,545
97
$198,699
APPLICATIONS APPROVED, NOT ACCEPTED
2
$253,230
28
$229,560
47
$215,620
0
$0
22
$232,619
APPLICATIONS DENIED
2
$128,640
35
$198,445
61
$195,956
7
$22,030
23
$211,607
APPLICATIONS WITHDRAWN
0
$0
15
$217,685
82
$224,223
4
$195,375
10
$190,226
FILES CLOSED FOR INCOMPLETENESS
0
$0
4
$415,025
17
$171,019
0
$0
0
$0
Aggregated Statistics For Year 2001 (Based on 2 full and 2 partial tracts)
A) FHA, FSA/RHS & VA Home Purchase Loans
B) Conventional Home Purchase Loans
C) Refinancings
D) Home Improvement Loans
F) Non-occupant Loans on < 5 Family Dwellings (A B C & D)
Number
Average Value
Number
Average Value
Number
Average Value
Number
Average Value
Number
Average Value
LOANS ORIGINATED
15
$185,556
113
$208,345
182
$183,914
7
$25,577
77
$186,912
APPLICATIONS APPROVED, NOT ACCEPTED
0
$0
18
$241,824
26
$153,886
0
$0
9
$98,360
APPLICATIONS DENIED
0
$0
20
$207,504
64
$192,562
11
$24,685
8
$149,291
APPLICATIONS WITHDRAWN
0
$0
14
$237,235
50
$176,530
2
$8,960
12
$231,485
FILES CLOSED FOR INCOMPLETENESS
0
$0
0
$0
23
$189,802
0
$0
0
$0
Aggregated Statistics For Year 2000 (Based on 2 full and 2 partial tracts)
A) FHA, FSA/RHS & VA Home Purchase Loans
B) Conventional Home Purchase Loans
C) Refinancings
D) Home Improvement Loans
F) Non-occupant Loans on < 5 Family Dwellings (A B C & D)
Number
Average Value
Number
Average Value
Number
Average Value
Number
Average Value
Number
Average Value
LOANS ORIGINATED
11
$207,497
98
$172,885
68
$191,015
22
$8,931
31
$139,045
APPLICATIONS APPROVED, NOT ACCEPTED
6
$162,167
29
$164,979
16
$230,317
3
$20,517
11
$166,362
APPLICATIONS DENIED
0
$0
21
$156,657
40
$188,038
7
$8,447
5
$178,200
APPLICATIONS WITHDRAWN
2
$173,130
13
$142,631
26
$109,897
2
$96,720
4
$61,418
FILES CLOSED FOR INCOMPLETENESS
2
$72,540
2
$216,770
50
$197,052
0
$0
0
$0
Aggregated Statistics For Year 1999 (Based on 1 full and 1 partial tracts)
A) FHA, FSA/RHS & VA Home Purchase Loans
B) Conventional Home Purchase Loans
C) Refinancings
D) Home Improvement Loans
E) Loans on Dwellings For 5+ Families
F) Non-occupant Loans on < 5 Family Dwellings (A B C & D)
Detailed PMIC statistics for the following Tracts:0102.01
, 0102.02
2003 - 2018 National Fire Incident Reporting System (NFIRS) incidents
According to the data from the years 2003 - 2018 the average number of fires per year is 15. The highest number of fires - 24 took place in 2011, and the least - 7 in 2003. The data has a rising trend.
When looking into fire subcategories, the most reports belonged to: Outside Fires (59.5%), and Structure Fires (23.1%).
Fire incident types reported to NFIRS in Zip Code 96717


 Nearest zip codes: 96730, 96762, 96786, 96789, 96731, 96744.
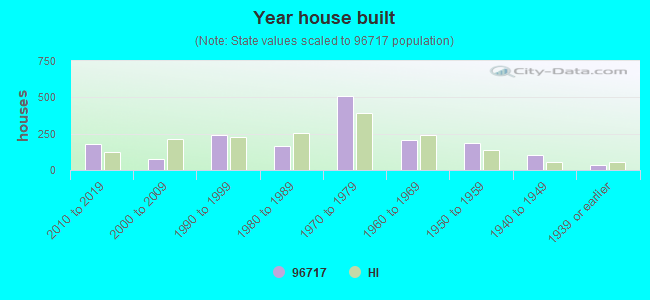


 According to the data from the years 2003 - 2018 the average number of fires per year is 15. The highest number of fires - 24 took place in 2011, and the least - 7 in 2003. The data has a rising trend.
 When looking into fire subcategories, the most reports belonged to: Outside Fires (59.5%), and Structure Fires (23.1%).