Estimated zip code population in 2022: 55,487 Zip code population in 2010: 54,247 Zip code population in 2000: 54,415
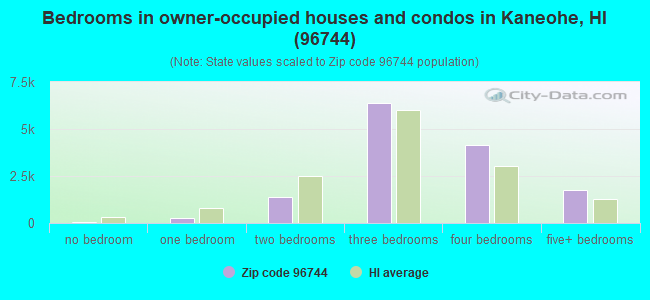
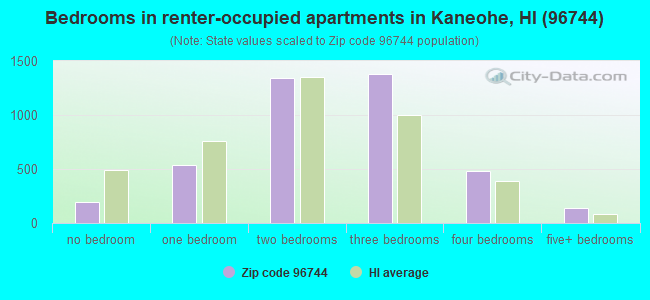
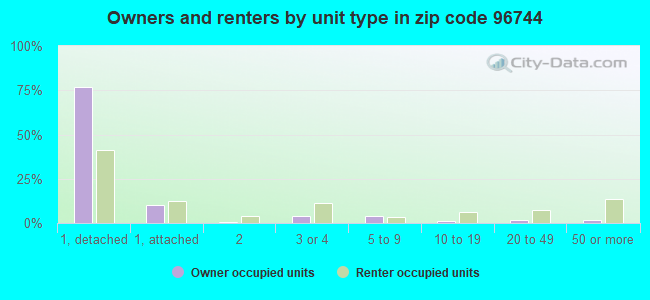
Houses and condos: 18,589 Renter-occupied apartments: 4,138
% of renters here:
23%
State:
37%
March 2022 cost of living index in zip code 96744: 134.2 (high, U.S. average is 100)
Land area: 34.5 sq. mi. Water area: 20.0 sq. mi.
Population density: 1,609 people per square mile
(low).
OSM Map
General Map
Google Map
MSN Map
OSM Map
General Map
Google Map
MSN Map
OSM Map
General Map
Google Map
MSN Map
OSM Map
General Map
Google Map
MSN Map
Please wait while loading the map...
Real estate property taxes paid for housing units in 2022:
This zip code:
0.3% ($2,743)
Hawaii:
0.3% ($2,092)
Median real estate property taxes paid for housing units with mortgages in 2022: $2,853 (0.3%) Median real estate property taxes paid for housing units with no mortgage in 2022: $2,567 (0.3%)
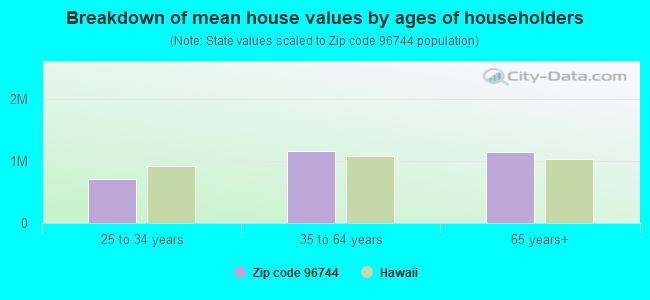
Estimated median house/condo value in 2022: $1,016,761
96744:
$1,016,761
Hawaii:
$820,100
According to our research of Hawaii and other state lists, there were 66 registered sex offenders living in 96744 zip code as of April 27, 2024. The ratio of all residents to sex offenders in zip code 96744 is 826 to 1. The ratio of registered sex offenders to all residents in this zip code is lower than the state average.
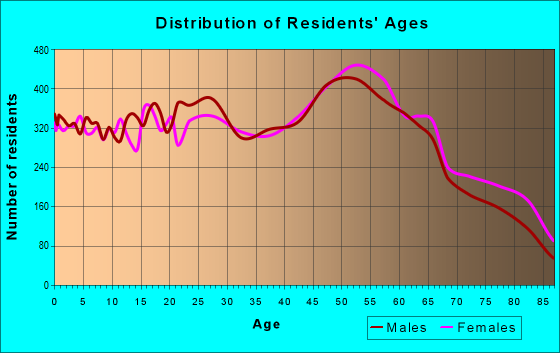
Median resident age:
This zip code:
45.2 years
Hawaii median age:
40.8 years
Average household size:
This zip code:
3.0 people
Hawaii:
2.8 people
Averages for the 2020 tax year for zip code 96744, filed in 2021:
Average Adjusted Gross Income (AGI) in 2020: $83,664 (Individual Income Tax Returns)
Here:
$83,664
State:
$72,945
Salary/wage: $69,938 (reported on 77.4% of returns)
Here:
$69,938
State:
$57,697
(% of AGI for various income ranges: 1186.3% for AGIs below $25k, 3757.0% for AGIs $25k-50k, 6706.2% for AGIs $50k-75k, 10309.0% for AGIs $75k-100k, 20914.8% for AGIs $100k-200k, 80278.7% for AGIs over 200k)
Taxable interest for individuals: $1,024 (reported on 44.7% of returns)
This zip code:
$1,024
Hawaii:
$1,356
(% of AGI for various income ranges: 21.9% for AGIs below $25k, 23.9% for AGIs $25k-50k, 54.4% for AGIs $50k-75k, 95.9% for AGIs $75k-100k, 157.7% for AGIs $100k-200k, 746.9% for AGIs over 200k)
Ordinary dividends: $4,835 (reported on 29.0% of returns)
Here:
$4,835
State:
$6,387
(% of AGI for various income ranges: 39.1% for AGIs below $25k, 52.7% for AGIs $25k-50k, 118.5% for AGIs $50k-75k, 230.2% for AGIs $75k-100k, 389.1% for AGIs $100k-200k, 3778.2% for AGIs over 200k)
Net capital gain/loss in AGI: +$14,705 (reported on 24.3% of returns)
Here:
+$14,705
State:
+$23,240
(% of AGI for various income ranges: 19.6% for AGIs below $25k, 38.9% for AGIs $25k-50k, 98.4% for AGIs $50k-75k, 218.5% for AGIs $75k-100k, 647.8% for AGIs $100k-200k, 15778.7% for AGIs over 200k)
Profit/loss from business: +$17,117 (reported on 14.0% of returns)
Here:
+$17,117
State:
+$15,381
(% of AGI for various income ranges: 73.7% for AGIs below $25k, 101.8% for AGIs $25k-50k, 193.2% for AGIs $50k-75k, 267.6% for AGIs $75k-100k, 637.5% for AGIs $100k-200k, 6931.1% for AGIs over 200k)
Taxable individual retirement arrangement distribution: $19,197 (reported on 13.0% of returns)
96744:
$19,197
Hawaii:
$19,883
(% of AGI for various income ranges: 74.7% for AGIs below $25k, 119.9% for AGIs $25k-50k, 289.1% for AGIs $50k-75k, 466.6% for AGIs $75k-100k, 1020.6% for AGIs $100k-200k, 3798.7% for AGIs over 200k)
Self-employed (Keogh) retirement plans: $22,270 (reported on 0.7% of returns)
96744:
$22,270
Hawaii:
$25,010
(% of AGI for various income ranges: 12.0% for AGIs $50k-75k, 32.6% for AGIs $100k-200k, 726.2% for AGIs over 200k)
Total itemized deductions: $33,276 (reported on 16.8% of returns)
Here:
$33,276
State:
$33,097
(% of AGI for various income ranges: 139.4% for AGIs below $25k, 183.7% for AGIs $25k-50k, 553.5% for AGIs $50k-75k, 911.6% for AGIs $75k-100k, 2403.4% for AGIs $100k-200k, 9992.2% for AGIs over 200k)
Charity contributions: $5,746 (reported on 12.9% of returns)
Here:
$5,746
State:
$7,368
(% of AGI for various income ranges: 4.5% for AGIs below $25k, 13.8% for AGIs $25k-50k, 44.3% for AGIs $50k-75k, 95.6% for AGIs $75k-100k, 309.4% for AGIs $100k-200k, 1855.8% for AGIs over 200k)
Taxes paid: $7,907 (reported on 16.7% of returns)
96744:
$7,907
State:
$7,601
(% of AGI for various income ranges: 13.4% for AGIs below $25k, 24.3% for AGIs $25k-50k, 103.4% for AGIs $50k-75k, 230.8% for AGIs $75k-100k, 673.8% for AGIs $100k-200k, 2197.6% for AGIs over 200k)
Earned income credit: $1,892 (reported on 8.7% of returns)
Here:
$1,892
State:
$2,008
(% of AGI for various income ranges: 62.8% for AGIs below $25k, 48.8% for AGIs $25k-50k, 0.6% for AGIs $50k-75k)
Percentage of individuals using paid preparers for their 2020 taxes: 88.8%
Here:
89%
State:
89%
(% for various income ranges: 88.2% for AGIs below $25k, 89.9% for AGIs $25k-50k, 88.8% for AGIs $50k-75k, 88.9% for AGIs $75k-100k, 87.7% for AGIs $100k-200k, 90.9% for AGIs over 200k)
Averages for the 2012 tax year for zip code 96744, filed in 2013:
Average Adjusted Gross Income (AGI) in 2012: $63,952 (Individual Income Tax Returns)
Here:
$63,952
State:
$57,303
Salary/wage: $54,720 (reported on 80.8% of returns)
Here:
$54,720
State:
$47,500
(% of AGI for various income ranges: 74.8% for AGIs below $25k, 75.9% for AGIs $25k-50k, 68.9% for AGIs $50k-75k, 69.9% for AGIs $75k-100k, 73.5% for AGIs $100k-200k, 52.3% for AGIs over 200k)
Taxable interest for individuals: $862 (reported on 46.0% of returns)
This zip code:
$862
Hawaii:
$1,212
(% of AGI for various income ranges: 0.9% for AGIs below $25k, 0.5% for AGIs $25k-50k, 0.7% for AGIs $50k-75k, 0.7% for AGIs $75k-100k, 0.5% for AGIs $100k-200k, 0.8% for AGIs over 200k)
Ordinary dividends: $3,354 (reported on 27.5% of returns)
Here:
$3,354
State:
$5,430
(% of AGI for various income ranges: 1.4% for AGIs below $25k, 1.0% for AGIs $25k-50k, 1.4% for AGIs $50k-75k, 1.4% for AGIs $75k-100k, 1.2% for AGIs $100k-200k, 2.3% for AGIs over 200k)
Net capital gain/loss in AGI: +$7,347 (reported on 18.8% of returns)
Here:
+$7,347
State:
+$13,910
(% of AGI for various income ranges: 0.2% for AGIs $25k-50k, 0.4% for AGIs $50k-75k, 0.4% for AGIs $75k-100k, 1.4% for AGIs $100k-200k, 9.1% for AGIs over 200k)
Profit/loss from business: +$15,950 (reported on 13.6% of returns)
Here:
+$15,950
State:
+$15,881
(% of AGI for various income ranges: 4.9% for AGIs below $25k, 2.5% for AGIs $25k-50k, 2.2% for AGIs $50k-75k, 2.9% for AGIs $75k-100k, 2.7% for AGIs $100k-200k, 6.4% for AGIs over 200k)
Taxable individual retirement arrangement distribution: $15,044 (reported on 12.3% of returns)
96744:
$15,044
Hawaii:
$15,720
(% of AGI for various income ranges: 2.9% for AGIs below $25k, 2.1% for AGIs $25k-50k, 2.8% for AGIs $50k-75k, 3.0% for AGIs $75k-100k, 2.9% for AGIs $100k-200k, 3.7% for AGIs over 200k)
Self-employment retirement plans: $18,161 (reported on 0.8% of returns)
96744:
$18,161
Hawaii:
$20,355
(% of AGI for various income ranges: 0.1% for AGIs $75k-100k, 0.2% for AGIs $100k-200k, 0.8% for AGIs over 200k)
Total itemized deductions: $25,841 (23% of AGI, reported on 36.6% of returns)
Here:
$25,841
State:
$25,496
Here:
23.4% of AGI
State:
23.1% of AGI
(% of AGI for various income ranges: 10.6% for AGIs below $25k, 9.9% for AGIs $25k-50k, 13.3% for AGIs $50k-75k, 16.0% for AGIs $75k-100k, 17.2% for AGIs $100k-200k, 15.4% for AGIs over 200k)
Charity contributions: $3,190 (reported on 30.7% of returns)
Here:
$3,190
State:
$3,353
(% of AGI for various income ranges: 0.7% for AGIs below $25k, 1.1% for AGIs $25k-50k, 1.5% for AGIs $50k-75k, 1.7% for AGIs $75k-100k, 1.7% for AGIs $100k-200k, 1.7% for AGIs over 200k)
Taxes paid: $8,158 (reported on 36.4% of returns)
96744:
$8,158
State:
$8,029
(% of AGI for various income ranges: 1.7% for AGIs below $25k, 1.8% for AGIs $25k-50k, 3.1% for AGIs $50k-75k, 4.3% for AGIs $75k-100k, 5.6% for AGIs $100k-200k, 7.5% for AGIs over 200k)
Earned income credit: $1,915 (reported on 11.5% of returns)
Here:
$1,915
State:
$2,113
(% of AGI for various income ranges: 4.2% for AGIs below $25k, 0.7% for AGIs $25k-50k)
Percentage of individuals using paid preparers for their 2012 taxes: 51.2%
Here:
51%
State:
53%
(% for various income ranges: 44.3% for AGIs below $25k, 46.7% for AGIs $25k-50k, 55.2% for AGIs $50k-75k, 58.7% for AGIs $75k-100k, 57.8% for AGIs $100k-200k, 72.6% for AGIs over 200k)
Averages for the 2004 tax year for zip code 96744, filed in 2005:
Average Adjusted Gross Income (AGI) in 2004: $51,043 (Individual Income Tax Returns)
Here:
$51,043
State:
$46,564
Salary/wage: $45,567 (reported on 82.0% of returns)
Here:
$45,567
State:
$39,831
(% of AGI for various income ranges: 100.1% for AGIs below $10k, 74.6% for AGIs $10k-25k, 77.2% for AGIs $25k-50k, 75.1% for AGIs $50k-75k, 76.3% for AGIs $75k-100k, 67.7% for AGIs over 100k)
Taxable interest for individuals: $928 (reported on 60.7% of returns)
This zip code:
$928
Hawaii:
$1,263
(% of AGI for various income ranges: 4.1% for AGIs below $10k, 1.5% for AGIs $10k-25k, 1.0% for AGIs $25k-50k, 1.0% for AGIs $50k-75k, 1.0% for AGIs $75k-100k, 1.1% for AGIs over 100k)
Taxable dividends: $2,167 (reported on 30.8% of returns)
Here:
$2,167
State:
$3,145
(% of AGI for various income ranges: 3.5% for AGIs below $10k, 1.2% for AGIs $10k-25k, 1.0% for AGIs $25k-50k, 1.0% for AGIs $50k-75k, 1.0% for AGIs $75k-100k, 1.7% for AGIs over 100k)
Net capital gain/loss: +$8,752 (reported on 22.8% of returns)
Here:
+$8,752
State:
+$16,059
(% of AGI for various income ranges: 0.7% for AGIs below $10k, 0.2% for AGIs $10k-25k, 0.4% for AGIs $25k-50k, 0.8% for AGIs $50k-75k, 1.2% for AGIs $75k-100k, 9.1% for AGIs over 100k)
Profit/loss from business: +$13,409 (reported on 14.0% of returns)
Here:
+$13,409
State:
+$13,847
(% of AGI for various income ranges: 2.1% for AGIs below $10k, 4.1% for AGIs $10k-25k, 2.4% for AGIs $25k-50k, 2.1% for AGIs $50k-75k, 2.8% for AGIs $75k-100k, 5.4% for AGIs over 100k)
Profit/loss from farming: +$2,229 (reported on 0.5% of returns)
Here:
+$2,229
State:
-$719
(% of AGI for various income ranges: 0.1% for AGIs $10k-25k, 0.1% for AGIs $25k-50k, 0.0% for AGIs $50k-75k, -0.0% for AGIs $75k-100k, -0.0% for AGIs over 100k)
IRA payment deduction: $2,902 (reported on 2.8% of returns)
96744:
$2,902
Hawaii:
$2,867
(% of AGI for various income ranges: 0.3% for AGIs below $10k, 0.2% for AGIs $10k-25k, 0.3% for AGIs $25k-50k, 0.2% for AGIs $50k-75k, 0.1% for AGIs $75k-100k, 0.1% for AGIs over 100k)
Self-employed pension: $11,831 (reported on 1.2% of returns)
Here:
$11,831
Hawaii:
$15,523
(% of AGI for various income ranges: 0.1% for AGIs $10k-25k, 0.1% for AGIs $25k-50k, 0.1% for AGIs $50k-75k, 0.2% for AGIs $75k-100k, 0.5% for AGIs over 100k)
Total itemized deductions: $20,952 (24% of AGI, reported on 38.5% of returns)
Here:
$20,952
State:
$20,647
Here:
24.0% of AGI
State:
23.5% of AGI
(% of AGI for various income ranges: 12.1% for AGIs below $10k, 9.9% for AGIs $10k-25k, 12.4% for AGIs $25k-50k, 16.8% for AGIs $50k-75k, 18.2% for AGIs $75k-100k, 17.0% for AGIs over 100k)
Charity contributions deductions: $2,822 (3% of AGI, reported on 34.9% of returns)
Here:
$2,822
State:
$2,966
Here:
3.1% of AGI
State:
3.3% of AGI
(% of AGI for various income ranges: 0.6% for AGIs below $10k, 0.9% for AGIs $10k-25k, 1.4% for AGIs $25k-50k, 2.0% for AGIs $50k-75k, 2.2% for AGIs $75k-100k, 2.2% for AGIs over 100k)
Total tax: $7,087 (reported on 80.0% of returns)
96744:
$7,087
State:
$7,224
(% of AGI for various income ranges: 2.7% for AGIs below $10k, 4.6% for AGIs $10k-25k, 7.4% for AGIs $25k-50k, 9.0% for AGIs $50k-75k, 10.1% for AGIs $75k-100k, 15.8% for AGIs over 100k)
Earned income credit: $1,529 (reported on 9.8% of returns)
Here:
$1,529
State:
$1,536
Percentage of individuals using paid preparers for their 2004 taxes: 54.8%
Here:
55%
State:
58%
(% for various income ranges: 45.0% for AGIs below $10k, 53.7% for AGIs $10k-25k, 54.4% for AGIs $25k-50k, 58.1% for AGIs $50k-75k, 58.8% for AGIs $75k-100k, 63.2% for AGIs over 100k)
Likely homosexual households (counted as self-reported same-sex unmarried-partner households)
Lesbian couples: 0.0% of all households
Gay men: 0.0% of all households
Household received Food Stamps/SNAP in the past 12 months: 1,380 Household did not receive Food Stamps/SNAP in the past 12 months: 16,568
Women who had a birth in the past 12 months: 420 (330 now married, 92 unmarried) Women who did not have a birth in the past 12 months: 10,513 (4,071 now married, 6,460 unmarried)
Housing units in zip code 96744 with a mortgage: 9,177 (1,941 second mortgage, 187 home equity loan, 1,579 both second mortgage and home equity loan) Houses without a mortgage: 442
Median monthly owner costs for units with a mortgage: $3,066 Median monthly owner costs for units without a mortgage: $653
Residents with income below the poverty level in 2022:
This zip code:
6.9%
Whole state:
10.2%
Residents with income below 50% of the poverty level in 2022:
This zip code:
2.3%
Whole state:
4.7%
Median number of rooms in houses and condos:
Here:
6.2
State:
5.5
Median number of rooms in apartments:
Here:
4.6
State:
3.9
Notable locations in this zip code not listed on our city pages
Notable locations in zip code 96744: Kualoa Ranch (A), Waikāne Camp (B), Kahalu‘u Landing (C), He‘eia Landing (D), Kahua Hau (E), Kahua Kuku (F), Kahua Kuou (G), Kahua Lehua (H), Kahua Nui (I), Pa Launa (J), Kāne‘ohe Yacht Club (K), Pali Golf Course (L), Waiāhole Camp (M), Kāne‘ohe Fishing Pier (N), Camp Kokokahi (O), Halekipa Camp (P), Bay View Golf Center (Q), Hale No‘eau (R), Hale Na‘auao (S), Hale Manaleo (T). Display/hide their locations on the map
Shopping Centers: Temple Valley Shopping Center (1), Windward City Shopping Center (2), Windward Mall Shopping Center (3), Kāne‘ohe Bay Shopping Center (4), Kāne‘ohe Shopping Center (5). Display/hide their locations on the map
Churches in zip code 96744 include: Kaneohe Higashi Hongwanji (A), Calvary Episcopal Church (B), Pali View Baptist Church (C), Church of the Nazarene (D), Waikane Congregational Church (E), Our Lady of Mount Carmel Church (F), Saint Mark Lutheran Church (G), Saint Anns Church (H), Door of Faith Church (I). Display/hide their locations on the map
Cemeteries: Valley of the Temples (1), Hawaiian Memorial Park (2), Our Lady of Mount Carmel Cemetery (3), Waikane Congregational Church Cemetery (4), Heeia Japanese Cemetery (5). Display/hide their locations on the map
Lakes and reservoirs: Oohope Pond (A), Mōli‘i Pond (B), Kahalu‘u Pond (C), He‘eia Pond (D), Kanohuluiwi Fish Pond (E), Waokele Pond (F), ‘Āpua Fishpond (G), Waikapoki Fish Pond (H). Display/hide their locations on the map
Streams, rivers, and creeks: Waiāhole Stream (A), Kea‘ahala Stream (B), Waianu Stream (C), Uwao Stream (D), Waihe‘e Stream (E), Piho Stream (F), Kawa Stream (G), Kapunahala Stream (H), Luluku Stream (I). Display/hide their locations on the map
Parks in zip code 96744 include: Ho‘omaluhia Park (1), Heeia Playground (2), Kahalu‘u Regional Park (3), Waihee Valley Nature Park (4), Kaneohe Community Park (5), Kailuapuhi Neighborhood Park (6), Kāne‘ohe Park (7), Kualoa Regional Park (8), Kaluapuhi Neighborhood Park (9). Display/hide their locations on the map
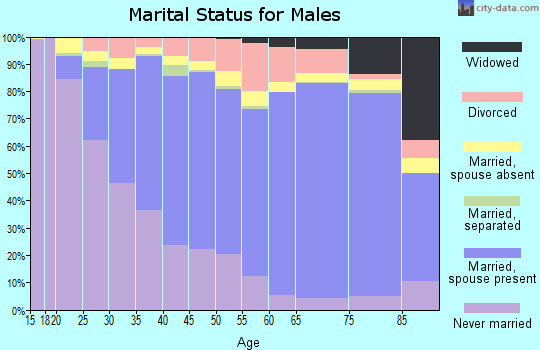
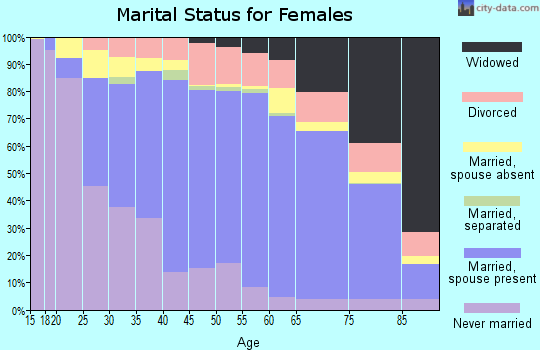
5,092 married couples with children.
1,965 single-parent households (633 men, 1,332 women).
89.8% of residents of 96744 zip code speak English at home.
1.3% of residents speak Spanish at home (76% very well, 22% well, 1% not well, 1% not at all).
1.4% of residents speak other Indo-European language at home (87% very well, 11% well, 2% not well).
8.5% of residents speak Asian or Pacific Island language at home (62% very well, 24% well, 13% not well, 1% not at all).
0.5% of residents speak other language at home (84% very well, 16% well).
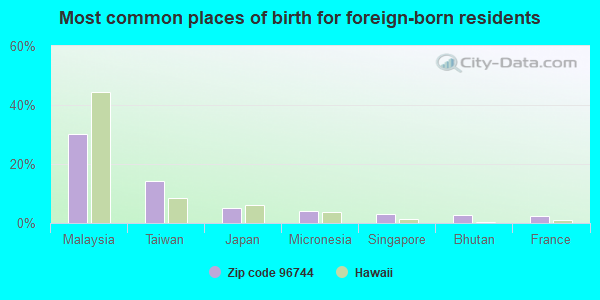
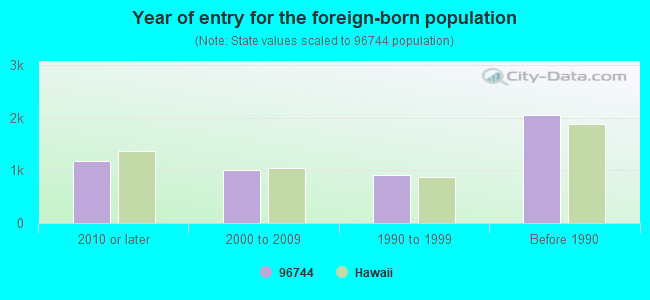
Foreign born population: 3,859 (7.0%) (65.5% of them are naturalized citizens)
Major facilities with environmental interests located in this zip code:
STATE OF HAWAII CASTLE HIGH SCHOOL (45-386 KANEOHE BAY DR in KANEOHE, HI)
SOLID WASTE PROGRAM (Hawaii Office Of Solid Waste) COMPLIANCE ACTIVITY (Tracking inspections of insecticide, fungicide, and rodenticide, and toxic substances) (National Center for Education Statistics) - STATE ID-4-301 Large Quantity Generators, more that 1000 kg of hazardous waste/month (Resource Conservation and Recovery Act (tracking hazardous waste)) - notification Organizations: HAWAII DEPT OF EDUCATION (SCHOOL DISTRICT)
Alternative names: CASTLE HIGH SCHOOL COMMUNITY RECYCLING CENTER, JAMES B CASTLE HIGH SCHOOL
AHUIMANU ELEMENTARY SCHOOL (47-470 HUI AEKO PLACE in KANEOHE, HI)
(Geographic Names Information System) COMPLIANCE ACTIVITY (Tracking inspections of insecticide, fungicide, and rodenticide, and toxic substances) (National Center for Education Statistics) - STATE ID-4-335 Organizations: HAWAII DEPT OF EDUCATION (SCHOOL DISTRICT)
Alternative names: AHUIMANU ELEM. SCHOOL
PUOHALA ELEMENTARY SCHOOL (45-233 KULAULI STREET in KANEOHE, HI)
(Geographic Names Information System) STATE MASTER (HEER-FRS) (National Center for Education Statistics) - STATE ID-4-314 Organizations: HAWAII DEPT OF EDUCATION (SCHOOL DISTRICT)
ARCO AM/PM #82107 (TEXACO 61-100-0152) (47-256 HUI IWA STREET in KANEOHE, HI)
STATE MASTER (HEER-FRS) STATE MASTER (Hawaii environmental compliance and hazardous materials tracking) UNDERGROUND STORAGE TANK PROGRAM (Hawaii Underground Storage Tank Program) (Integrated Compliance Information System) - ICIS-09-2000-0014, FORMAL ENFORCEMENT ACTION Business SIC classification: GASOLINE SERVICE STATIONS Alternative names: ARCO 82107, ARCO GAS STA 82107
BENJAMIN PARKER ELEMENTARY SCHOOL (45-259 WAIKALUA RD in KANEOHE, HI)
(Geographic Names Information System) COMPLIANCE ACTIVITY (Tracking inspections of insecticide, fungicide, and rodenticide, and toxic substances) (National Center for Education Statistics) - STATE ID-4-323 Organizations: HAWAII DEPT OF EDUCATION (SCHOOL DISTRICT)
WAIAHOLE ELEMENTARY SCHOOL (48-215 WAIAHOLE VALLEY ROAD in KANEOHE, HI)
(Geographic Names Information System) (National Center for Education Statistics) - STATE ID-4-326 Organizations: HAWAII DEPT OF EDUCATION (SCHOOL DISTRICT)
HAWAII WHOLESALE FUMIGATORS (45-1048 KAMEHAMEHA HWY RM 203 in KANEOHE, HI)
(Integrated Compliance Information System) - ICIS-09-1988-0006, FORMAL ENFORCEMENT ACTION COMPLIANCE ACTIVITY (Tracking inspections of insecticide, fungicide, and rodenticide, and toxic substances) Business SIC classification: FARM SUPPLIES Alternative names: JOSE LOPEZ URQUIDI DBA HAWAII
HEEIA ELEMENTARY SCHOOL (46-202 HAIKU ROAD in KANEOHE, HI)
(Geographic Names Information System) (National Center for Education Statistics) - STATE ID-4-304 Organizations: HAWAII DEPT OF EDUCATION (SCHOOL DISTRICT)
KAHALUU ELEMENTARY SCHOOL (47-280 WAIHEE ROAD in KANEOHE, HI)
(Geographic Names Information System) (National Center for Education Statistics) - STATE ID-4-306 Organizations: HAWAII DEPT OF EDUCATION (SCHOOL DISTRICT)
KANEOHE ELEMENTARY SCHOOL (45-495 KAMEHAMEHA HIGHWAY in KANEOHE, HI)
(Geographic Names Information System) (National Center for Education Statistics) - STATE ID-4-313 Organizations: HAWAII DEPT OF EDUCATION (SCHOOL DISTRICT)
KAPUNAHALA ELEMENTARY SCHOOL (45-828 ANOI ROAD in KANEOHE, HI)
(Geographic Names Information System) (National Center for Education Statistics) - STATE ID-4-315 Organizations: HAWAII DEPT OF EDUCATION (SCHOOL DISTRICT)
HAKIPU'U LEARNING CENTER - A PUBLIC CHARTER SCHOOL (45-720 KEAAHALA ROAD in KANEOHE, HI)
(National Center for Education Statistics) - STATE ID-4-546 Organizations: HAWAII DEPT OF EDUCATION (SCHOOL DISTRICT)
HAWAII STATE HOSPITAL (45-710 KEAAHALA RD in KANEOHE, HI)
STATE MASTER (HEER-FRS) STATE MASTER (Hawaii environmental compliance and hazardous materials tracking) UNDERGROUND STORAGE TANK PROGRAM (Hawaii Underground Storage Tank Program) COMPLIANCE ACTIVITY (Tracking inspections of insecticide, fungicide, and rodenticide, and toxic substances) Conditionally Exempt Small Quantity Generators, less than 100 kg/month of hazardous waste (Resource Conservation and Recovery Act (tracking hazardous waste)) - notification Business SIC classification: PSYCHIATRIC HOSPITALS Business NAICS classification: GENERAL AUTOMOTIVE REPAIR. Organizations: STATE OF HAWAII (CONTACT/OWNER)
Alternative names: HAWAIIAN STATE HOSPITAL
Housing units lacking complete plumbing facilities: 0.4% Housing units lacking complete kitchen facilities: 1.3%
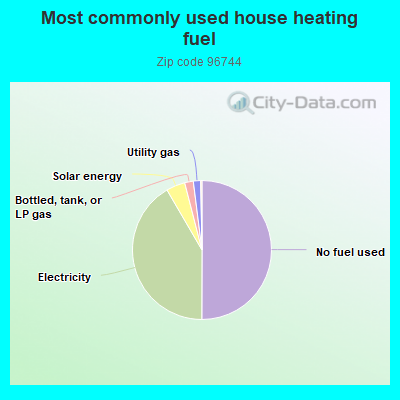
50.1%No fuel used
41.6%Electricity
4.4%Solar energy
2.0%Bottled, tank, or LP gas
1.7%Utility gas
Population in 1990: 55,236.
Place of birth for U.S.-born residents:
This state: 38,912
Northeast: 1,619
Midwest: 2,097
South: 2,187
West: 5,754
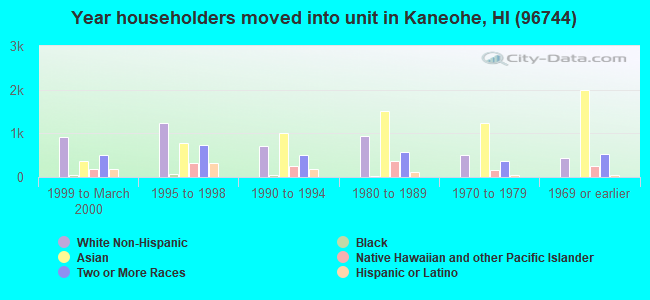
69% of the 96744 zip code residents lived in the same house 5 years ago. Out of people who lived in different houses, 74% lived in this county. Out of people who lived in different counties, 50% lived in Hawaii.
91% of the 96744 zip code residents lived in the same house 1 year ago. Out of people who lived in different houses, 62% moved from this county. Out of people who lived in different houses, 5% moved from different county within same state. Out of people who lived in different houses, 26% moved from different state. Out of people who lived in different houses, 7% moved from abroad.
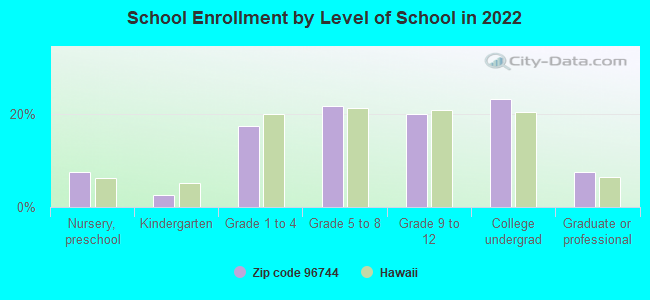
Private vs. public school enrollment:
Students in private schools in grades 1 to 8 (elementary and middle school): 1,654
Here:
34.9%
Hawaii:
21.6%
Students in private schools in grades 9 to 12 (high school): 928
Here:
38.8%
Hawaii:
21.5%
Students in private undergraduate colleges: 1,021
Here:
36.0%
Hawaii:
23.3%
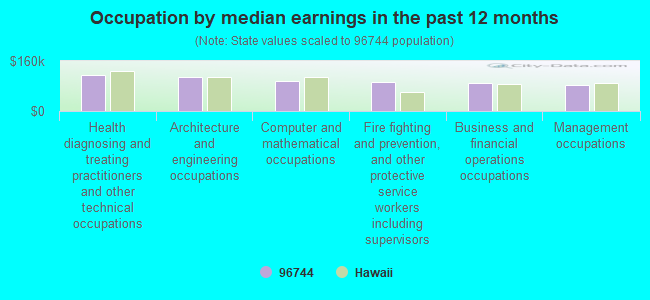
Occupation by median earnings in the past 12 months ($)
114,170Health diagnosing and treating practitioners and other technical occupations
107,784Architecture and engineering occupations
97,438Computer and mathematical occupations
92,675Fire fighting and prevention, and other protective service workers including supervisors
89,187Business and financial operations occupations
82,103Management occupations
Companies with biggest federal contracts located in this zip code (KANEOHE, HI):
DONALDSON ENTERPRISES INC (45-1055 KAMEHAMEHA SUITE 2; small business) : $6,668,617 in 43 contractsfrom 1999 to 2006
Contracts for Other Environmental Services, Studies, and Analytical Support, Other Special Studies and Analyses, Environmental Studies and Assessments, Hazardous Substance Removal, Cleanup, and Disposal Services and Operational Support by Army Signed by year:2000: $197,608; 2001: $950,740; 2002: $1,601,498; 2003: $1,387,756; 2004: $977,643; 2005: $1,273,665; 2006: -$73.
Biggest contracts:
$740,261 with Army for Other Environmental Services, Studies, and Analytical Support. Signed on 2003-09-30. Completion date: 2003-09-28.
$504,210 with Army for Other Special Studies and Analyses. Signed on 2002-03-28. Completion date: 2003-12-28.
$498,973 with Army for Other Environmental Services, Studies, and Analytical Support. Signed on 2004-09-29. Completion date: 2005-09-28.
$490,709 with Army for Other Special Studies and Analyses. Signed on 2001-12-28. Completion date: 2003-12-28.
ED YAMASHIRO, INC (45-552 KAMEHAMEHA HWY; small business) : $4,722,771 in 63 contractsfrom 1999 to 2006
Contracts for Motor Charter for Things, Other Vehicle Charter for Transportation of Things, Other Cargo and Freight Services, Passenger Motor Charter Service, and moreby Army, U.S. Coast Guard Signed by year:2000: $435,847; 2001: $257,373; 2002: $282,561; 2003: $1,092,243; 2004: $750,849; 2005: $1,168,119; 2006: $520,668.
Biggest contracts:
$264,447 with Army for Motor Charter for Things. Signed on 2005-12-30. Completion date: 2006-03-31.
$238,942 with Army for Other Vehicle Charter for Transportation of Things. Signed on 2006-05-23. Completion date: 2006-09-30.
$227,035 with Army for Other Cargo and Freight Services. Signed on 2003-02-05. Completion date: 2003-03-31.
$221,742 with Army for Motor Charter for Things. Signed on 2006-04-29. Completion date: 2006-05-31.
KUNIO MIYAZAWA,M D (44-031 KAIMALU PLACE; small business) : $638,875 in 8 contractsfrom 1999 to 2003
Contracts for Gynecology Services, Other Medical Services, Chemical/Biological Studies and Analyses by Army, Department of Veterans Affairs Signed by year:2000: $343,600; 2001: $117,975; 2002: $29,550; 2003: $29,550; 2004: $0; 2005: $0; 2006: $0.
Biggest contracts:
$118,200 with Army for Gynecology Services. Signed on 2000-11-14. Completion date: 2002-09-30.
$118,200, same as above.Signed on 1999-10-28. Completion date: 1999-10-30.
$117,975, same as above.Signed on 2001-12-07. Completion date: 2002-09-30.
$110,000 with Department of Veterans Affairs for Other Medical Services. Signed on 2000-04-15. Completion date: 2001-03-15.
GOMES SCHOOL BUS SERVICE LTD (47-114 WAILEHUA RD; small business) : $458,152 in 28 contractsfrom 2000 to 2006
Contracts for Passenger Motor Vehicles, Passenger Motor Charter Service, Other Professional Services, Miscellaneous Items by Navy, U.S. Coast Guard, Air Force Signed by year:2000: $74,400; 2001: $0; 2002: $0; 2003: $25,850; 2004: $168,740; 2005: $179,533; 2006: $9,629.
Biggest contracts:
$108,675 with Navy for Passenger Motor Vehicles. Signed on 2005-06-29. Completion date: 2005-06-30.
$101,250, same as above.Signed on 2004-07-07. Completion date: 2005-06-30.
$37,920 with Navy for Passenger Motor Charter Service. Signed on 2000-12-29. Completion date: 2001-08-09.
$36,480, same as above.Signed on 2000-07-01. Completion date: 2000-12-31.
CHRISTINA PERREIRA (45-605 UHILEHUA STREET; small business) : $457,884 in 8 contractsfrom 2003 to 2004
Contracts for Maintenance, Repair and Rebuilding of Equipment -- Plumbing, Heating, and Waste Disposal Equipment by Army Signed by year:2000: $0; 2001: $0; 2002: $0; 2003: $201,026; 2004: $256,858; 2005: $0; 2006: $0.
Biggest contracts:
$100,513 with Army for Maintenance, Repair and Rebuilding of Equipment -- Plumbing, Heating, and Waste Disposal Equipment. Signed on 2004-03-16. Completion date: 2004-05-31.
$100,513, same as above.Signed on 2003-10-09. Completion date: 2003-12-31.
$100,513, same as above.Signed on 2004-02-03. Completion date: 2004-03-31.
$100,513, same as above.Signed on 2003-07-31. Completion date: 2003-09-30.
CURTIS FALTSTROM (45-305 PALIIKI PLACE; small business) : $452,867 in 6 contractsfrom 2000 to 2004
Contracts for Other Professional Services, Automated Information System Design and Integration Services by Army Signed by year:2000: $124,000; 2001: $0; 2002: $151,813; 2003: $87,127; 2004: $89,927; 2005: $0; 2006: $0.
Biggest contracts:
$89,927 with Army for Other Professional Services. Signed on 2004-10-15. Completion date: 2002-09-30.
$87,127, same as above.Signed on 2003-11-17. Completion date: 2002-09-30.
$86,342, same as above.Signed on 2002-12-10. Completion date: 2002-09-30.
$81,500 with Army for Automated Information System Design and Integration Services. Signed on 2000-11-28. Completion date: 2001-09-30.
YANO, KARA ELIZABETH (46-128 HUMU STREET; small business) : $381,750 in 6 contractsfrom 2002 to 2005
Contracts for Other Medical Services by Army Signed by year:2000: $0; 2001: $0; 2002: $62,010; 2003: $63,480; 2004: $131,680; 2005: $124,580; 2006: $0.
Biggest contracts:
$124,580 with Army for Other Medical Services. Signed on 2005-06-09. Completion date: 2004-09-30.
$124,572, same as above.Signed on 2004-08-05. Completion date: 2004-09-30.
$63,480, same as above.Signed on 2003-10-01. Completion date: 2004-09-30.
$62,010, same as above.Signed on 2002-10-21. Completion date: 2002-10-21.
KNG GROUP LLC (44-030 KAIMALU PL; small business) : $287,603 in 4 contractsfrom 2003 to 2005
$159,023 with Navy for Trash/Garbage Collection Services - Including Portable Sanitation Services. Signed on 2003-03-28. Completion date: 2003-05-31.
$61,100 with Navy for Miscellaneous Items. Signed on 2005-09-21. Completion date: 2005-11-20.
$49,880 with Navy for Plastics Fabricated Materials. Taking place in TN. Signed on 2004-08-11. Completion date: 2004-10-15.
$17,600 with Navy for Miscellaneous Items. Signed on 2004-10-08. Completion date: 2004-10-11.
BEAR MACHINERY, INC (46-153 MALINA PL; small business) : $271,595 in 3 contractsin 2002
$111,125 with Navy for Miscellaneous Prefabricated Structures. Signed on 2002-08-02. Completion date: 2002-09-30.
$102,500, same as above.Signed on 2002-09-05. Completion date: 2002-12-31.
$57,970 with Navy for Chemical Weapons and Equipment. Signed on 2002-03-25. Completion date: 2002-04-26.
T IIDA CONTRACTING, LTD (45-558 KAMEHAMEHA HWY STE; small business) : $245,813 in 15 contractsfrom 1999 to 2003
Contracts for Maintenance, Repair or Alteration of Real Property -- Troop Housing Facilities by Navy Signed by year:2000: $52,567; 2001: $7,935; 2002: $164,940; 2003: $978; 2004: $0; 2005: $0; 2006: $0.
Biggest contracts:
$79,227 with Navy for Maintenance, Repair or Alteration of Real Property -- Troop Housing Facilities. Signed on 2002-06-14. Completion date: 2000-11-30.
$40,265, same as above.Signed on 2002-04-12. Completion date: 2000-11-30.
$26,519, same as above.Signed on 2000-03-01. Completion date: 2000-11-16.
$19,393, same as above.Signed on 1999-11-22. Completion date: 2000-11-02.
Top industries in this zip code by the number of employees in 2005:
2003 - 2018 National Fire Incident Reporting System (NFIRS) incidents
Based on the data from the years 2003 - 2018 the average number of fire incidents per year is 77. The highest number of reported fire incidents - 107 took place in 2007, and the least - 26 in 2003. The data has a rising trend.
When looking into fire subcategories, the most reports belonged to: Outside Fires (45.5%), and Structure Fires (27.4%).
Fire incident types reported to NFIRS in Zip Code 96744


+$2,229
-$719
(% of AGI for various income ranges: 0.1% for AGIs $10k-25k, 0.1% for AGIs $25k-50k, 0.0% for AGIs $50k-75k, -0.0% for AGIs $75k-100k, -0.0% for AGIs over 100k) Nearest zip codes: 96863, 96701, 96734, 96730, 96817, 96859.
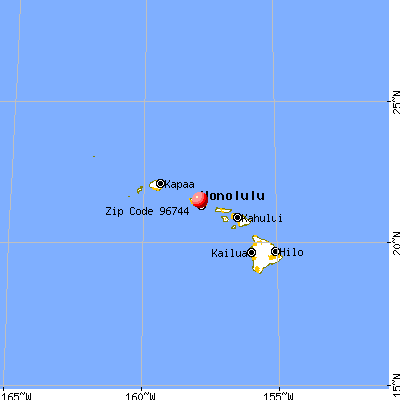


 Based on the data from the years 2003 - 2018 the average number of fire incidents per year is 77. The highest number of reported fire incidents - 107 took place in 2007, and the least - 26 in 2003. The data has a rising trend.
 When looking into fire subcategories, the most reports belonged to: Outside Fires (45.5%), and Structure Fires (27.4%).